What Is The Relative Strength Index (RSI) in Crypto?


The Relative Strength Index (RSI) is a widely used momentum indicator designed to spot when an asset might be overbought (price too high) or oversold (price too low). Think of it as a tool that measures how quickly an asset’s price has been rising or falling, giving you insight into possible trend reversals.
Due to crypto’s highly volatile nature, RSI can be a valuable tool. It offers traders a quick and reliable way to gauge market momentum, making it easier to decide when to buy, sell, or hold. Unlike traditional markets, where trends develop more slowly, crypto demands precision — and RSI can be your edge.
Key Takeaways
- RSI is useful in volatile crypto markets as it helps traders spot potential trend reversals and optimal entry or exit points.
- Customizable thresholds, such as 80/20 for high volatility or 65/35 for steadier markets, make RSI more adaptable for crypto trading strategies.
- Advanced techniques, like hidden divergences and failure swings, refine RSI analysis by confirming trends or signaling sentiment shifts.
- Tools like RSI heatmaps provide seamless tracking, real-time analysis, and multi-asset insights for traders of all levels.
What Is the Relative Strength Index (RSI)?
The Relative Strength Index (RSI), developed by J. Welles Wilder, is a momentum oscillator that measures the strength of an asset’s price movements. It operates on a scale from 0 to 100, helping traders identify whether a cryptocurrency is overbought (potentially overpriced) or oversold (potentially underpriced).
By analyzing price changes over a specific time period, RSI can signal when a trend reversal might be coming. This makes it a handy tool for deciding when to buy or sell, especially in markets prone to rapid fluctuations.
RSI Formula and Calculation
Here’s how to calculate the Relative Strength Index step by step:
Step 1: Price Change (Δt)
This is the difference between the current closing price and the previous one:
Δt = Pricet – Pricet-1
Explanation: For each period (typically 1 day), subtract the previous close from the current close. This gives you the daily gain or loss.
Step 2: Separate Gains and Losses
Gaint = max(Δt, 0)
Losst = max(-Δt, 0)
Explanation: If the price went up, the gain is recorded and the loss is zero. If it went down, the gain is zero and the loss is the absolute value of the change. This separation is key to understanding upward vs. downward momentum.
Step 3: Calculate the Initial Average Gain and Loss
AvgGain14 = (Sum of Gains over 14 periods) / 14
AvgLoss14 = (Sum of Losses over 14 periods) / 14
Explanation: Start by taking the average of the first 14 gains and losses. These are simple arithmetic means and serve as the seed values for smoothing in later steps.
Step 4: Smooth the Averages (Wilder’s Method)
AvgGaint = ((AvgGaint-1 × (n – 1)) + Gaint) / n
AvgLosst = ((AvgLosst-1 × (n – 1)) + Losst) / n
Explanation: Instead of recalculating full averages every time, use smoothing, like exponential moving averages. This gives more weight to recent data without being overly reactive. The standard period n is 14.
Step 5: Calculate Relative Strength (RS)
RSt = AvgGaint / AvgLosst
Explanation: Relative Strength compares bullish and bearish momentum. A value >1 means recent gains outweigh losses; Step 6: Calculate the RSI
RSIt = 100 – (100 / (1 + RSt))
Explanation: This final formula compresses RS into a 0–100 scale. If RS = 1 (equal gains/losses), RSI = 50. Above 70 is typically overbought, and below 30 is oversold, though these thresholds can be adjusted based on trend strength.
Why Is RSI Useful in Crypto?
The cryptocurrency market is known for its sharp and unpredictable price movements, sometimes analyzed by depth charts on well-known crypto aggregators, making it challenging to predict trends. That’s where technical indicators like RSI come in – they simplify the data and highlight potential turning points, helping traders act with more confidence.
RSI is particularly useful for spotting:
- Overbought conditions: When RSI is above 70, it may indicate a price drop is coming.
- Oversold conditions: When RSI is below 30, it could signal a price recovery.
While RSI is powerful on its own, it works even better alongside other tools like the Moving Average Convergence Divergence (MACD). RSI shows when a trend might reverse, while MACD gives more context about the trend’s direction and strength. Together, they provide a clearer picture of what’s happening in the market.
Understanding RSI Levels: Key Thresholds
The RSI indicator is most effective when you understand its key levels and how they signal market conditions. These thresholds guide traders on when to enter or exit trades, helping them anticipate reversals or continuations in price trends.
Overbought vs. Oversold
Overbought (RSI > 70):
When RSI crosses above 70, it signals the asset might be overvalued after a period of strong price gains. This doesn’t guarantee an immediate price drop but suggests that the upward momentum could be slowing down.
Example: If Bitcoin’s RSI reaches 75 during a rally, it may signal caution. Traders might sell part of their holdings or adjust stop-loss levels to protect profits.
Oversold (RSI
When the RSI drops below 30, it indicates the asset could be undervalued due to extended selling pressure. This often signals that a price rebound or trend reversal may be near.
Example: If Ethereum’s RSI hits 25 after a prolonged downtrend, it may be a good opportunity to watch for recovery signs or consider entering a trade.
What is a “good” RSI for buying?
RSI below 30 is generally a buy signal, but the asset’s broader trend should also be considered. RSI is most effective in consolidating or sideways markets.
Is a higher RSI better?
Not always. While an RSI above 70 shows strong momentum, it also suggests the asset may be overbought and at risk of a pullback. Use RSI as one part of your analysis, not the sole deciding factor.
Customizing RSI Levels in Crypto
The default RSI levels (70/30) work well in most markets, but the cryptocurrency market often demands a more tailored approach. Given the frequent and sharp price swings, traders sometimes adjust these levels to minimize false signals.
For highly volatile cryptocurrencies, some traders use an overbought level of 80 and an oversold level of 20. This adjustment accounts for the extreme price movements typical in crypto markets, ensuring that RSI signals are more meaningful.
However, in less volatile conditions, adjusting the thresholds to 65/35 might help capture earlier signals while maintaining reliability.
These customized levels allow traders to fine-tune RSI to align with their strategy and the specific behavior of the asset they’re analyzing. Whether day trading or holding for the long term, experimenting with RSI settings can improve its accuracy in predicting market reversals.
Basic RSI Crypto Trading Strategies
RSI provides clear signals that traders can use to refine their decision-making process. Let’s discuss the practical strategies that the navigator offers to effectively navigate price trends.
Overbought/Oversold Signals
As mentioned earlier, overbought (RSI > 70) and oversold (RSI shorting if DOGE hits RSI 75 on the 4-hour chart after a strong rally. Conversely, if RSI drops to 25 after a sharp decline, it could signal a bounce opportunity.
This method is particularly effective in consolidating or mildly trending markets where price momentum is less erratic. Always confirm with price action — look for reversal candlestick patterns or support/resistance levels before entering trades.
Divergences (Bullish and Bearish)
Divergences occur when RSI and price movements contradict each other, signaling that the current momentum may be weakening. These signals can help traders anticipate trend reversals:
Bullish Divergence
This happens when the RSI forms higher lows while the asset’s price makes lower lows, indicating that selling pressure is easing and an upward reversal could follow.
Example: If Solana’s price hits a new low but the RSI rises from 25 to 35, it suggests the potential for a recovery as bearish momentum fades.
Bearish Divergence
When RSI forms lower highs while the asset’s price makes higher highs, it signals weakening buying momentum, which could precede a price drop.
Example: If Ethereum’s price climbs to a new high but the RSI falls from 75 to 68, this may indicate that the rally is losing strength, presenting a potential opportunity to sell.
Advanced RSI Crypto Trading Strategies
RSI offers advanced techniques for traders with more experience to uncover deeper market insights. Methods like hidden divergences and failure swings go beyond basic signals, helping traders confirm trends and spot potential reversals with greater precision.
Hidden Divergences
Hidden divergences are subtle variations of the divergence concept mentioned above, but they focus on confirming ongoing trends rather than signaling reversals.
Bullish Hidden Divergence
A bullish hidden divergence occurs when the price forms a higher low while the RSI forms a lower low, signaling strength in an uptrend.
Bullish Hidden Divergence
Conversely, a bearish hidden divergence appears when the price forms a lower high while the RSI creates a higher high, indicating weakening momentum in a downtrend. These patterns help traders solidify their positions or avoid premature exits.
Failure Swings
Failure swings take RSI analysis a step further by focusing on its inability to sustain a movement beyond critical levels like 30 or 70.
Bullish Failure Swing
A bullish failure swing happens when the RSI dips below 30 but rebounds without reaching a new low, signaling that buyers are regaining control.
Bearish Failure Swing
Conversely, a bearish failure swing occurs when the RSI exceeds 70 but fails to form a new high, suggesting declining momentum. These patterns are particularly useful for confirming shifts in market sentiment.
Tools and Platforms for Tracking RSI in Crypto
Tracking RSI effectively requires the right tools tailored to crypto’s fast-moving market. These tools range from general trading platforms to specialized crypto trackers, offering varying levels of functionality and customization.
Popular RSI Tools for Crypto
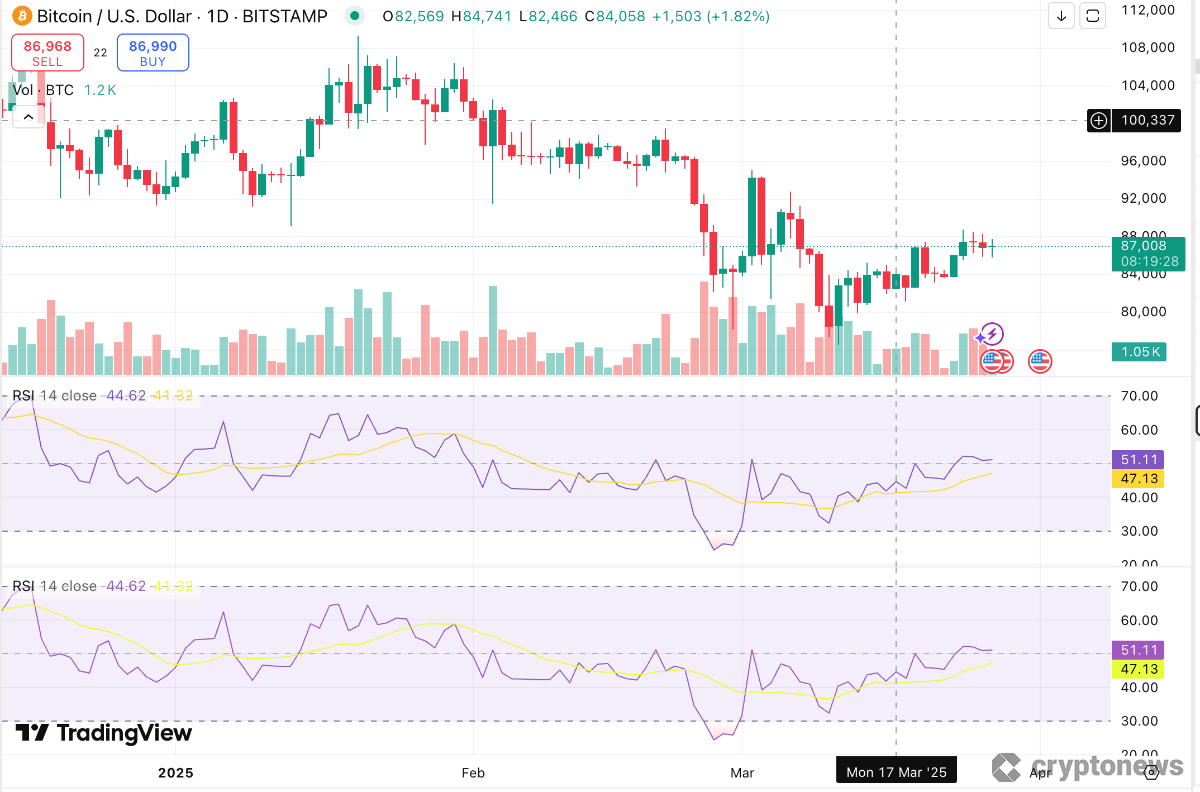
TradingView is a popular charting platform known for its robust RSI analysis capabilities. Users can easily overlay RSI onto price charts, customize its settings, and even apply community-created scripts for advanced strategies. Its intuitive interface makes it accessible for beginners, while its advanced tools cater to seasoned traders.
For instance, you can use TradingView to analyze Bitcoin’s RSI across different time frames, adjusting between the standard 14-day period or custom settings tailored to your strategy.
The platform also offers multi-timeframe analysis, customization options, and a wide range of community-shared indicators, making it a go-to resource for detailed RSI tracking and strategy development.
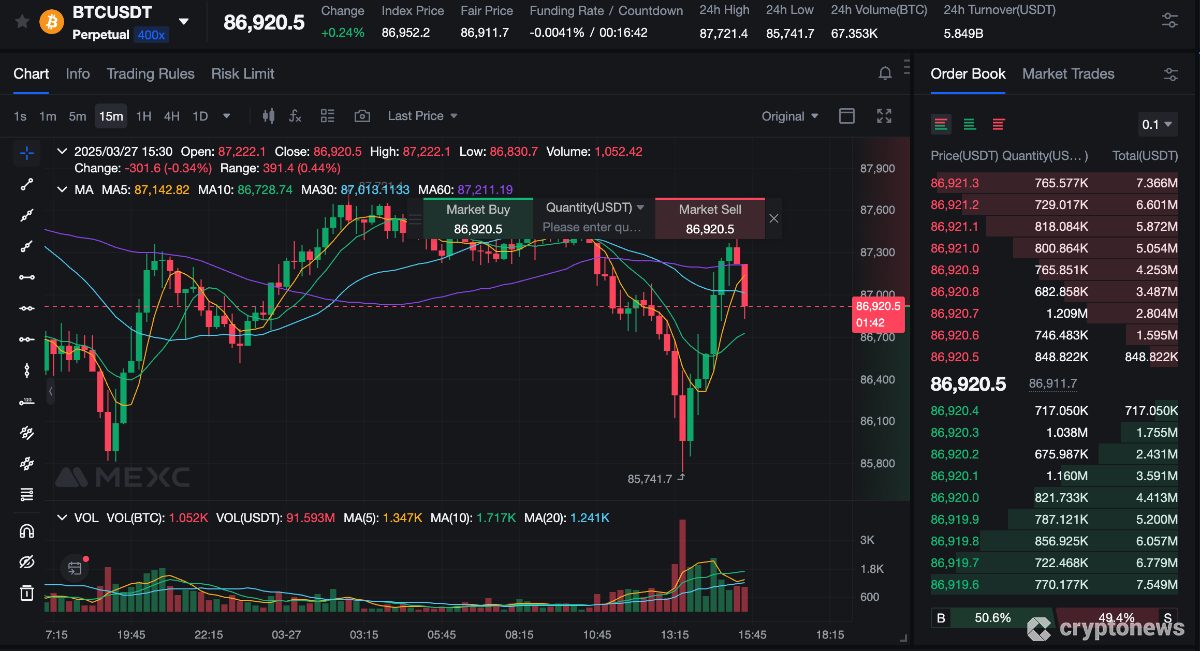
MEXC, a leading cryptocurrency exchange, also provides powerful tools for tracking RSI directly within its trading platform. By integrating advanced charting features, MEXC allows users to analyze RSI trends seamlessly while managing trades in real time.
RSI Heatmaps and Trackers
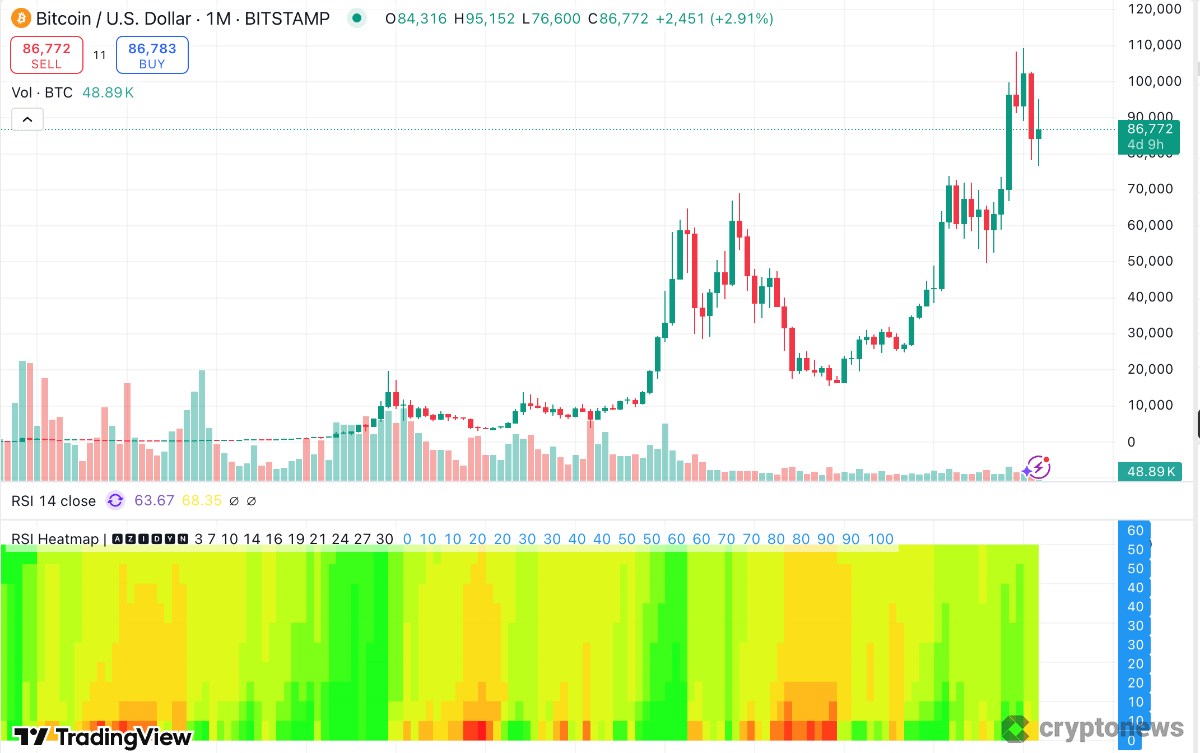
Crypto-specific tools like RSI heatmaps and trackers are excellent for quickly gauging RSI trends across multiple assets. Crypto RSI Heatmaps, offered by platforms like CryptoQuant and IntoTheBlock, visually display aggregated RSI data for various tokens.
These heatmaps are particularly useful for identifying opportunities at a glance. For example, if a heatmap shows that most altcoins have an RSI below 30, it could signal a market-wide oversold condition and potential buying opportunities.
Meanwhile, custom RSI trackers from tools like CoinGecko and Messari allow traders to monitor RSI for specific coins or portfolios. These platforms offer a more personalized approach to tracking RSI trends, ensuring you stay informed about your chosen assets.
Setting Alerts and Customization Options
Setting RSI alerts ensures that traders don’t need to monitor charts constantly. Platforms like TradingView make it easy to set up notifications triggered when RSI crosses specific thresholds, such as 30 or 70, or when divergences appear. For example, you can configure an alert to notify you if Bitcoin’s RSI drops below 30 on a 4-hour chart, signaling a potential buying opportunity.
These alerts are highly customizable, allowing traders to adjust thresholds or time frames based on their strategies. For short-term trading, consider setting alerts for higher-sensitivity RSI levels, such as 80/20, to capture rapid market movements.
Long-term traders may prefer sticking with standard levels like 70/30 to focus on broader trends. These features ensure you’re always up-to-date on key RSI signals, no matter your trading style.
Choosing the Best RSI Settings for Crypto
Customizing RSI settings to match your trading style and market conditions is critical to maximizing its effectiveness.
Time Frames and Period Settings
The default RSI setting of 14 periods strikes a balance between sensitivity and reliability, making it suitable for most markets, including crypto. However, crypto’s notorious volatility might necessitate adjustments.
Short-term traders often reduce the RSI period to 7, enabling quicker signals that are better for fast-paced trading. On the other hand, long-term traders might prefer extending the period to 21 to smooth out fluctuations and focus on more consistent trends.
Adjusting for Different Market Conditions
When adjusting RSI for different market conditions, flexibility is key. During bull markets, RSI often hovers above 70 due to sustained upward momentum. In such cases, using thresholds like 90/10 instead of 70/30 can prevent premature exits and allow traders to ride the trend longer.
For instance, during Bitcoin’s 2024 bull run, adopting 90/10 settings helped traders hold positions through temporary pullbacks, maximizing gains. Conversely, in bear markets, where trends frequently test lower thresholds, settings like 60/20 can be more effective for catching reversals early and adapting to weaker market conditions.
Testing and Refining Your RSI Strategy
Testing and refining RSI strategies is an essential part of optimizing performance. Backtesting allows traders to evaluate how their chosen RSI settings would have performed in historical scenarios. Demo trading platforms, such as MEXC, Margex, and Binance, offer risk-free environments for this purpose.
For example, a trader could test RSI divergences on Ethereum across multiple time frames in a demo account to understand how reliable these signals are under different conditions. Analyzing the results — such as how often RSI signals lead to profitable trades — helps refine the settings, ensuring they align with the trader’s goals and the asset’s behavior.
Limitations and Risks of Using RSI in Crypto
While RSI is a powerful tool for identifying momentum shifts, it has limitations, especially in the volatile crypto market. One major issue is the potential for false signals.
For example, during a strong bull market, the RSI can remain above 70 for extended periods, suggesting overbought conditions that might mislead traders into selling too early, causing them to miss out on additional profits.
However, in sharp downtrends, the RSI can stay below 30 as prices continue to fall, leading traders to enter prematurely, expecting a reversal that doesn’t materialize.
To mitigate these risks, it’s essential to combine RSI with other indicators. Pairing RSI with tools like MACD, moving averages, or Bollinger Bands can provide additional confirmation and reduce the likelihood of acting on false signals.
One effective approach is to use RSI to identify entry points while verifying trends with a 200-day moving average. Volume analysis also adds context, as increased trading volume during an RSI divergence strengthens its validity.
Enhancing RSI With Other Indicators
Combining RSI with other technical indicators can provide a more comprehensive market view, reducing false signals and improving trading accuracy.
Pairing RSI With Moving Averages
Moving averages smooth out price data, making identifying trends easier and helping confirm RSI momentum signals.
For instance, if the RSI indicates an oversold condition, checking whether the price is near a 200-day moving average can validate a potential upward bounce. Shorter-term moving averages, such as the 50-day, are more effective for active traders, while swing traders may benefit from the longer-term 200-day average.
Using Bollinger Bands With RSI
Bollinger Bands measure price volatility, and when paired with RSI, they can highlight more reliable overbought or oversold conditions. For example, when the RSI falls below 30 and the price touches the lower Bollinger Band, it could signal a strong buying opportunity. However, it’s crucial to watch for consolidations near the bands to avoid acting on false breakouts.
MACD and RSI for Divergence Confirmation
The MACD indicator tracks momentum changes and works exceptionally well for verifying RSI divergences. A bullish divergence on RSI, where RSI forms lower lows while price forms higher lows, gains more credibility if the MACD line crosses upward simultaneously.
Traders can also monitor the MACD histogram for early signs of divergence, enhancing the reliability of buy or sell signals.
Practical Tips for Effective RSI Use in Crypto
Mastering RSI in crypto trading requires adaptability and combining technical insights with risk management.
Adapt RSI to Market Conditions
Crypto markets are notoriously volatile, so adjusting RSI thresholds is crucial. For assets with high price swings, setting thresholds to 80/20 instead of the default 70/30 helps filter out false signals.
Additionally, analyzing an asset’s trend is vital; in strong bull markets, RSI levels may naturally skew higher, while in bear markets, they may trend lower.
Combine RSI With Fundamental Analysis
RSI signals are most reliable when cross-checked with fundamental insights. Monitoring news about regulations, partnerships, or market sentiment can help validate RSI indications.
For example, an oversold RSI during favorable news about a token upgrade might suggest an undervalued buying opportunity. Similarly, key events like token unlocks or macroeconomic developments can provide context for interpreting RSI movements.
Risk Management Tips
Managing risk is essential when trading with RSI. Here’s the gist of how to trade smarter and reduce false signals using key risk controls:
- Combine RSI with trend indicators to avoid false signals in strong, bullish, or bearish markets.
- Use RSI on higher timeframes for more reliable signals and less noise.
- Set stop-losses below support or above resistance to limit downside risk.
- Avoid trading solely on RSI — confirm signals with volume, price action, or moving averages.
- Adjust RSI thresholds (e.g., 80/20) during strong trends to reduce premature entries and exits.
Final Thoughts on Crypto RSI
The RSI is a powerful tool for identifying momentum shifts and potential price reversals in the crypto market. While it offers valuable insights, it works best when used alongside other indicators like MACD or Bollinger Bands and informed by market fundamentals.
To maximize RSI’s effectiveness, backtest your strategies and use sound risk management techniques. Crypto markets are inherently unpredictable, but RSI can help you navigate them more confidently. Explore our technical indicators guide to expand your knowledge and refine your strategies.
👉 Learn More: 10 Best Technical Indicators for Crypto Trading in 2026
FAQs
How does the RSI differ when applied to various timeframes in crypto trading?
Can RSI be effectively used for long-term crypto investments?
What is RSI lag, and how can traders adjust their strategies to account for it?
How does volume impact RSI signals in crypto trading?
2M+
250+
8
70


About Cryptonews
Our goal is to offer a comprehensive and objective perspective on the cryptocurrency market, enabling our readers to make informed decisions in this ever-changing landscape.
Our editorial team of more than 70 crypto professionals works to maintain the highest standards of journalism and ethics. We follow strict editorial guidelines to ensure the integrity and credibility of our content.
Whether you’re looking for breaking news, expert opinions, or market insights, Cryptonews has been your go-to destination for everything cryptocurrency since 2017.

 Leon Waters

 Camila Karam
 Anatol Antonovici