
Dogecoin (DOGE) Price Prediction 2026, 2027 – 2030
We believe in full transparency with our readers. Some of our content includes affiliate links, and we may earn a commission through these partnerships. However, this potential compensation never influences our analysis, opinions, or reviews. Our editorial content is created independently of our marketing partnerships, and our ratings are based solely on our established evaluation criteria. Read More


As the first-ever meme coin, Dogecoin will always dominate the headlines of crypto news outlets. In recent years, it has increasingly gained exposure to TradFi and institutional investors. Financial products tied to  DOGE +1.01% have emerged, including ETPs and derivatives. Meanwhile, the Dogecoin Foundation has continued development initiatives, including plans for new self-custodial wallet tools.
However, the broader crypto market has recently experienced heightened volatility following a sharp correction from its previous year highs, reflecting macroeconomic uncertainty and fluctuating liquidity conditions. Our Dogecoin price forecast therefore examines whether DOGE can maintain its current valuation levels and market relevance going forward.
As of July 2, 2026, Dogecoin is trading at $0.074, reflecting a partial recovery from earlier market declines, but it remains some considerable distance away from its all-time high of $0.75.
This Dogecoin price prediction guide will analyze the potential future of this popular cryptocurrency and evaluate how factors such as institutional participation, meme coin sector trends, and broader crypto market cycles may influence its long-term trajectory.
Maxi Doge – Top Alternative to Dogecoin
![]()
![]()


Dogecoin Price Prediction Overview
Launched in 2013, Dogecoin is currently ranked the 9th largest cryptocurrency with a market cap of over $10.98B. The list below briefly summarizes our year-by-year Dogecoin prediction for 2026–2030, reflecting current market dynamics and evolving investor sentiment within the meme-coin sector.
- By the end of 2026, Dogecoin’s price is likely to remain closely tied to broader crypto market sentiment and liquidity conditions. Social media attention and community engagement will still play an important role, but institutional products, regulatory clarity, and Bitcoin’s performance may increasingly influence DOGE’s price movements as the market matures.
- By the end of 2027, Dogecoin’s trajectory may depend on whether the meme coin sector stabilizes around a small number of highly liquid assets or continues to expand through speculative launches. Continued ecosystem development could support DOGE’s relevance, though price growth would likely remain highly sensitive to market cycles.
- By the end of 2030, Dogecoin could remain one of the dominant meme coins if it continues to retain strong liquidity, exchange support, and cultural relevance. However, the long-term outlook for the sector remains uncertain, as meme coins are still largely driven by market sentiment rather than fundamental utility.
DOGE Price Potential Highs & Lows (2026–2030)
| Year | Potential Low | Average Price | Potential High |
|---|---|---|---|
| 2026 | $0.078 | $0.083 | $0.087 |
| 2027 | $0.087 | $0.10 | $0.11 |
| 2030 | $0.15 | $0.28 | $0.48 |
Dogecoin Latest Events
- Ongoing in 2026: Continued speculation around potential payment integrations on X keeps Dogecoin closely tied to Elon Musk crypto coins, although no full-scale implementation has yet been confirmed.
- September 18, 2025: The first U.S.-based Dogecoin exchange-traded product debuted, launched by REX-Osprey, providing a new avenue for investors to gain exposure to DOGE through traditional brokerage accounts.
- Throughout 2025: The Dogecoin Foundation laid out ambitious plans focusing on Dogebox infrastructure upgrades, scaling solutions, and integrating DOGE payments across up to 1 million merchants, supported by community figures including Vitalik Buterin.
- May 2025: The 2nd Global Dogecoin Consensus Conference (GDCC 2025) was held in Dubai. It brought together community leaders, developers, miners, and ecosystem partners to discuss Dogecoin’s future developments, Layer1 upgrades, mining ecosystem, and adoption strategies.
- April 2025: Coinbase launched Dogecoin futures trading, giving professional traders a new way to interact with DOGE. This new development is likely to impact the price of DOGE, as it brings greater liquidity and potentially more price fluctuations due to the involvement of more institutional traders.
- January 2025: Grayscale introduced the Dogecoin Trust, enabling institutional investors to gain exposure to DOGE without owning the asset directly. This move is considered a significant step toward mainstream adoption, as it offers a regulated investment option.
- November 13, 2024: Donald Trump announced that Elon Musk and Vivek Ramaswamy will lead the Department of Government Efficiency (DOGE). The name ‘DOGE’ is no coincidence, with Elon Musk being a notorious Dogecoin supporter.
- November 5, 2024: Following the U.S. Presidential election in November 2024, Dogecoin saw a 115% price surge, reflecting heightened market enthusiasm. Dogecoin recorded its highest trading volume in two years, driven by growing adoption and bullish market conditions.
- October 2024: Expanding its reach in decentralized finance (DeFi), Dogecoin became usable for staking and lending in October 2024.
- September 2024: X (formerly Twitter) integrated Dogecoin for tipping and payments in September 2024, adding a new utility for the cryptocurrency.
Dogecoin Price Prediction for 2026
Our experts predict Dogecoin DOGE +1.01% could trade between $0.078 and $0.087 in 2026, with most forecasts averaging around $0.083.
These wide ranges highlight the continued volatility typical of meme coin assets and the influence of broader crypto market cycles. Dogecoin’s price still tends to react strongly to social media trends and community sentiment, with Elon Musk’s public comments historically triggering short-term price volatility.
However, the asset is increasingly influenced by broader market factors such as institutional participation, crypto exchange liquidity, and the overall performance of major cryptocurrencies like Bitcoin.
Month Potential Low Average Price Potential High August 2026 $0.075 $0.077 $0.078 September 2026 $0.077 $0.080 $0.083 October 2026 $0.078 $0.083 $0.087 November 2026 $0.080 $0.086 $0.092 December 2026 $0.081 $0.089 $0.097 January 2027 $0.083 $0.092 $0.10 February 2027 $0.084 $0.095 $0.10 March 2027 $0.086 $0.098 $0.11 April 2027 $0.087 $0.10 $0.11 May 2027 $0.089 $0.10 $0.12 June 2027 $0.090 $0.10 $0.12 July 2027 $0.092 $0.11 $0.12
Broader crypto trends, like Bitcoin’s performance, also play a big role in shaping DOGE’s value. During bullish market phases, meme coins often experience amplified price movements, while periods of risk aversion tend to impact them more severely than larger, utility-focused cryptocurrencies.
Investment products tied to Dogecoin, including exchange-traded products and institutional investment vehicles, have expanded access for traditional investors, potentially increasing liquidity and market participation.
Meanwhile, the Dogecoin Foundation has outlined ecosystem initiatives such as improved wallet infrastructure and merchant-focused tools designed to make DOGE easier to use for payments and everyday transactions.

Despite optimistic predictions, DOGE remains highly speculative. Prices could swing wildly due to shifting hype or market downturns. Investors should stay cautious, as meme coins often react strongly to news and sentiment rather than fundamentals.
This means Dogecoin’s valuation may continue to fluctuate significantly depending on macroeconomic conditions, market liquidity, and the overall sentiment toward the meme-coin sector.
Dogecoin Price Prediction for 2027
By 2027, Dogecoin’s price will likely depend on whether the meme coin sector consolidates around a few dominant assets or continues to fragment across thousands of speculative tokens. As the largest meme coin by market capitalization, DOGE may retain strong liquidity and exchange support, which could help it remain one of the sector’s core assets.
If the broader cryptocurrency market enters another bullish phase, Dogecoin could benefit from renewed retail participation and increased risk appetite. In that scenario, analysts estimate DOGE could trade between $0.087 and $0.11 during 2027, with an average forecast of around $0.10.
Institutional investment vehicles tied to DOGE, along with ecosystem developments such as improved wallet infrastructure and merchant-focused tools proposed by the Dogecoin Foundation, may also support continued market activity. However, Dogecoin is still largely driven by sentiment and community momentum rather than underlying utility.
As a result, DOGE could remain highly volatile throughout 2027, with price movements closely tied to Bitcoin’s performance, overall crypto market liquidity, and the level of interest in meme coins compared with other emerging sectors of the digital asset market.
Dogecoin Price Prediction for 2030
The further into the future we peer, the harder it is to make accurate predictions for all cryptocurrencies, especially meme coins, whose price is typically supported by speculation. However, there are a few facts we can use to create an informed Dogecoin price forecast for 2030.
The world of cryptocurrencies is evolving rapidly, and by 2030,regulatory frameworks and institutional participation may be considerably more developed than they are today. There is also ongoing discussion around broader payment adoption for digital assets, including meme coins like Dogecoin.
Will this mean the disappearance of meme coins, or will they have to evolve additional use cases to stay relevant?
While the Dogecoin Foundation continues exploring ecosystem improvements such as wallet tools and payment infrastructure, the network itself is expected to remain relatively simple compared with newer blockchain platforms, we can expect limited but continued use of DOGE in niche payment communities. Will X be one of them? Only time will tell.
If the history of Bitcoin Halving events repeats itself, the market could be entering a consolidation phase following the potential bull cycle triggered by the 2028 Bitcoin halving.

All of this combined leads us to predict that Dogecoin could remain highly cyclical and sentiment-driven, with our Dogecoin price prediction for 2030 suggesting a potential range between $0.15 and $0.48.
Price Predictions of Other Analysts for Dogecoin
Below, we’ve summarized several recent forecasts from analysts and research platforms to provide a broader perspective on how the market views Dogecoin’s long-term potential.
CoinCodex projects relatively modest growth compared with some bullish narratives. According to its forecasting model, Dogecoin could reach around $0.1189 by the end of 2026 and approximately $0.1565 by 2030, reflecting gradual appreciation rather than explosive gains.
DigitalCoinPrice takes a more optimistic view. Its projections suggest DOGE could average about $0.50 by 2027 and potentially approach $0.79 by 2030 if market conditions turn favorable.
Long-term forecasts by Yahoo Finance analysts vary widely depending on assumptions about adoption and market cycles. Some analysts cited by financial outlets estimate Dogecoin could reach around $1.50 by 2030 if broader cryptocurrency adoption continues to expand.
However, forecasts differ significantly across the industry. MEXC‘s conservative models suggest DOGE may remain closer to the $0.16–$0.21 range by 2030, highlighting the uncertainty surrounding meme-coin valuations and their dependence on market sentiment rather than fundamental utility.
Overall, analyst opinions show that Dogecoin’s long-term outlook remains highly debated, with projections ranging from modest growth to much more bullish scenarios depending on adoption, regulation, and the direction of the broader crypto market.
Doge Price History: Summarized
- 2013: With an initial circulating supply of approximately 100 billion coins before later transitioning to an inflationary supply model, DOGE launched in 2013 and its first listed price on CoinMarketCap is $0.0002993 on December 16, 2013.
- 2021: Backed by sporadic tweets and public comments from Elon Musk, Dogecoin increased by 246,342% from its opening price of $0.0002993 to an ATH of $0.7376 on May 8, 2021.
- 2021: After May 8, 2021, when Musk appeared on SNL, Dogecoin dropped more than 43% in 2 days, highlighting the cryptocurrency’s sensitivity to media events and market sentiment.
- 2022–2023: Following the 2021 bull market peak, Dogecoin experienced a prolonged correction alongside the wider cryptocurrency market, with prices largely consolidating below $0.10 during much of this period.
- 2024: Dogecoin experienced renewed volatility during the broader crypto market recovery, with trading activity increasing as meme coins regained popularity among retail investors.
- 2025: Over the last 12 months, Dogecoin has increased around -, reflecting continued market volatility and shifting sentiment across the meme coin sector.
- 2026: Dogecoin remains the largest meme coin by market capitalization, continuing to attract strong trading volumes despite the broader cooling of speculative meme-token activity.
Still regarded as a top meme coin, DOGE has regularly attracted high levels of volatility. Dogecoin is a fork of Litecoin (itself a fork from Bitcoin) created in 2013, originally launched as a parody cryptocurrency but later evolving into one of the most widely recognized meme-coin assets in the crypto market.
| Coin Name | Dogecoin (DOGE) |
|---|---|
| Dogecoin Price | $0.074 |
| Dogecoin ATH | $0.75 (May 8, 2021) |
| Dogecoin Price Change 24h | ▲ 1.0100% |
| Dogecoin Price Change 7d | ▼ -0.75% |
| Dogecoin Market Cap | $10.98B |
| Circulating Supply | 148.31B |
Dogecoin Tokenomics & Launch
Dogecoin was launched through a fair launch process (meaning no presale, no premine, no token allocation to developers, and no fundraising). According to CoinMarketCap, Dogecoin’s first price is recorded on December 16, 2013, as $0.0002993 per token.
Dogecoin has a “diminishing inflation rate” as a maximum of 5 billion tokens can be added to the total supply each year. This cap on token distribution means that each year the rate of Dogecoin inflation actually goes down.
Created by Billy Markus and Jackson Palmer, the token was originally launched as a fun cryptocurrency token and an alternative to Bitcoin, incorporating the popular Shiba Inu dog meme as its logo to help it be a crypto with more mass appeal. This has since spurned a whole slew of dog- and doge-themed meme tokens.
Before becoming one of the best cryptocurrencies to buy, Dogecoin traded sideways for nearly 7 years, between 2013 to 2020, with a brief spike from $0.001045 to $0.01507 in late 2018, an increase of 1,342%. After that spike Dogecoin settled back into a trading range between $0.002 and $0.004.
Best Place to Buy Dogecoin
When purchasing DOGE +1.01%, selecting a trustworthy wallet is very important for secure storage and efficient management. Best Wallet is an excellent choice, offering a easy-to-use experience for both beginners and experienced cryptocurrency users. The wallet’s intuitive mobile interface allows for easy navigation, allowing users to manage their DOGE holdings effortlessly.
Security is a top priority with Best Wallet, using strong measures such as two-factor authentication (2FA) and private key encryption to safeguard your assets. As a non-custodial wallet, it guarantees that you retain full control over your private keys, improving the security of your funds.
Beyond Dogecoin, Best Wallet supports many other cryptocurrencies, making it a versatile tool for managing diverse digital assets. Its mobile-only design, with free apps available for iOS and Android, makes sure that you can manage your portfolio on the go. While it doesn’t currently offer a desktop solution, a browser extension is in development, promising expanded functionality in the future.
By choosing Best Wallet, you are opting for a secure, user-friendly, and versatile platform to purchase, store, and manage your Dogecoin and other cryptocurrencies with confidence.
Best Dogecoin Alternative
Having carefully analysed Dogecoin’s competitors, we find that Maxi Doge (MAXI) is its best alternative, as it roots its identity in the meme culture of today’s traders. Unlike its dog peers, which appeal with cuteness or humor, Maxi Doge shifts the narrative around its extreme weightlifting mascot, espousing a no-fear ethos around high-leverage trading.
However, unlike Dogecoin, MAXI doesn’t have its own blockchain. Instead, it uses Ethereum, which already boasts a strong meme coin trading community that has provided a springboard to many high-potential coins, including Shiba Inu and Floki, both of which now have market caps measured in billions.
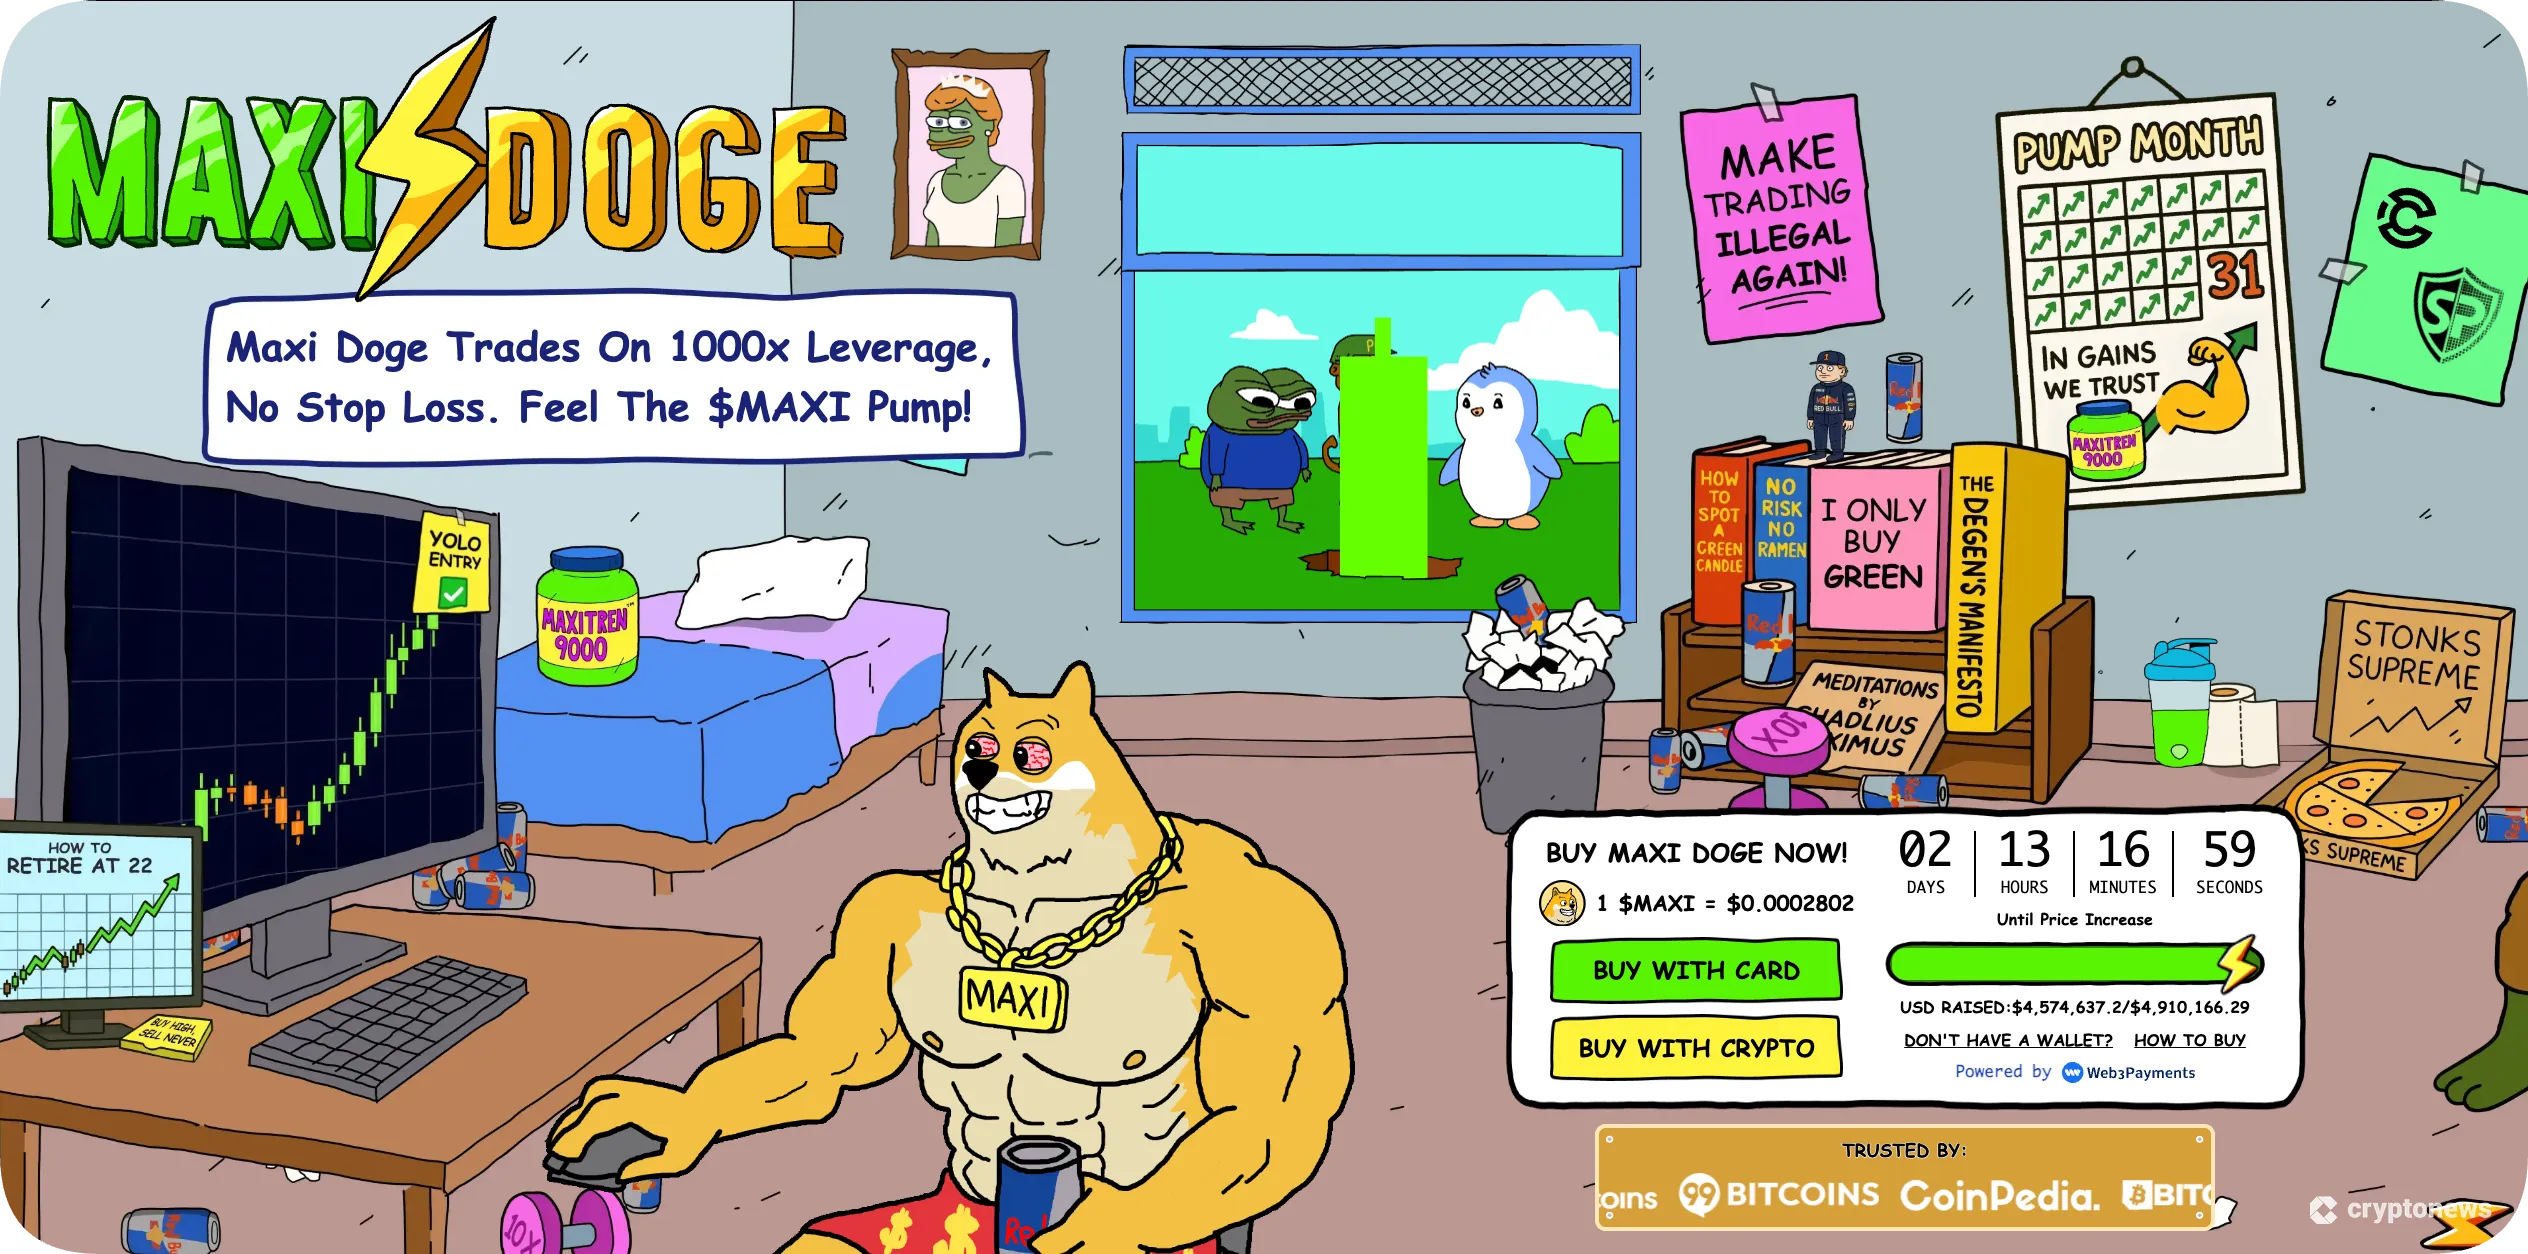
Where DOGE pioneered mass recognition and SHIB expanded into a full ecosystem, MAXI focuses on a lifestyle approach for high-risk, high-reward traders. Plans to help boost the MAXI token price include high-profile partnerships, trading competitions, and possible future platform listings, giving holders direct exposure to high-leverage trading on MAXI itself.
The MAXI token is now sold in presale at a discounted price of $0.00028265. While the presale lasts, investors can stake their tokens for a dynamic yield of 67%. Investors have already recognized MAXI’s potential, having raised over $4.82M in just weeks after launch.
Next Price Increase In:
Final Thoughts
Dogecoin has experienced periods of recovery and volatility in recent years as the broader cryptocurrency market fluctuates. Despite ongoing market uncertainty, our analysts suggest that Dogecoin could maintain relevance within the meme-coin sector, with its price likely remaining closely tied to broader crypto market cycles and investor sentiment.
While Dogecoin may continue to benefit during bullish crypto market phases, there are also emerging projects that appeal to investors seeking higher-risk opportunities. One speculative alternative, Maxi Doge (MAXI), has positioned itself as a niche meme-coin project with a distinct tokenomics model.
However, it’s important to approach these predictions with caution, as the cryptocurrency market is highly volatile and influenced by various factors. Investors should conduct thorough research and consider both the potential rewards and risks associated with investing in Dogecoin or any alternative meme-coin projects.
FAQs
What will DOGE be worth in 2026?
What will Dogecoin be worth in 2030?
What was the starting price of Dogecoin?
What was Dogecoin’s highest price?
Is Dogecoin a good investment?
References
- ‘I Made Doge in Like Two Hours’: Dogecoin Creator Says he ‘Didn’t Consider’ Environmental Impact (Yahoo)
- Dogecoin Inflation (Dogecoin)
- X Status Elon Musk (X)
- How Tweets by Tesla’s Elon Musk have Moved Markets (Reuters)
- Dogecoin Tumbles After Elon Musk Calls it a ‘hustle’ on ‘SNL’ Show (Reuters)
- Dogecoin Surges 35% as Elon Musk’s Twitter Deal Approaches Close (CNBC)
- Dogecoin Trailmap: Prologue (Dogecoin)
- Libdogecoin, a Clean C Library of Dogecoin Building Blocks (GitHub)
- Trump selects Elon Musk to lead government efficiency department (The Guardian)
- Dogecoin ETF Tracker (The Block)
2M+
250+
8
70


About Cryptonews
Our goal is to offer a comprehensive and objective perspective on the cryptocurrency market, enabling our readers to make informed decisions in this ever-changing landscape.
Our editorial team of more than 70 crypto professionals works to maintain the highest standards of journalism and ethics. We follow strict editorial guidelines to ensure the integrity and credibility of our content.
Whether you’re looking for breaking news, expert opinions, or market insights, Cryptonews has been your go-to destination for everything cryptocurrency since 2017.