Bull Flag vs Bear Flag: Key Differences and Trading Tips


Understanding bull and bear flags is essential for active crypto traders looking to spot market trends and predict potential price movements. These chart patterns are continuation signals that help traders decide whether to enter, hold, or exit trades based on a cryptocurrency’s price trajectory.
A bull flag often points to an extension of an upward trend, while a bear flag suggests further decline in a downward trend. By identifying these patterns early, traders can position themselves strategically and make informed decisions based on historical price behavior.
Key Takeaways
- Bull flags signal the continuation of an uptrend, while bear flags indicate a continuation of a downtrend.
- Valid flags feature high volume during the flagpole, low volume during consolidation, and increased volume at breakout.
- Trade entries are placed at breakout points: above resistance for bull flags and below support for bear flags.
- Stop-loss orders should be placed just outside the consolidation zone to limit potential losses.
- Projecting the flagpole’s length from the breakout point can help estimate profit targets.
- False breakouts can be avoided by using additional confirmations like volume analysis and moving averages.
- Combining flag patterns with advanced strategies like multi-timeframe analysis improves trading precision.
- Smart risk management strategies are essential for maximizing gains and minimizing losses when trading flag patterns.
What is a Bull Flag Pattern?
A bull flag pattern is a bullish continuation signal that appears in an uptrend. It hints that the price is likely to climb higher after a brief pause. When identified correctly, it’s a favorite among traders because it often precedes significant gains.
Here’s how it’s structured:
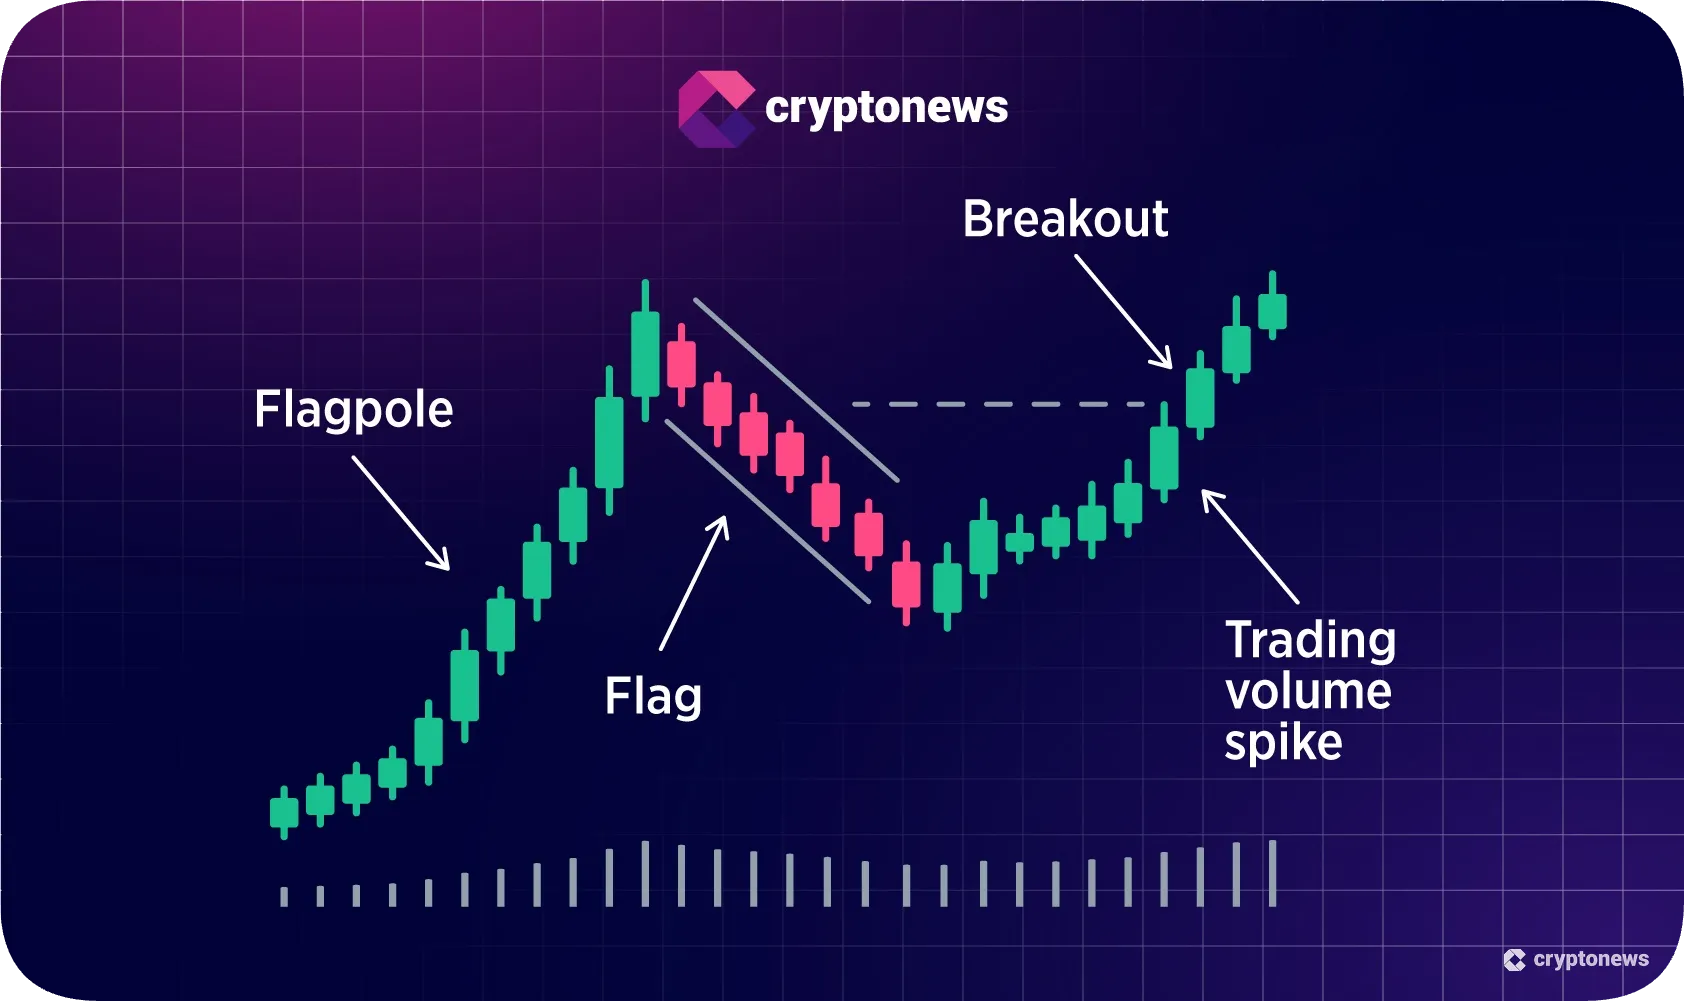
- Flagpole: This sharp upward price movement kicks off the pattern, showing strong buying interest.
- Flag: After the surge, the price enters a consolidation phase, moving sideways or slightly downward within a channel. This part reflects traders taking a breather.
- Breakout: The uptrend resumes once the price breaks above the flag’s resistance line, signaling a potential buying opportunity.
The Psychology Behind the Bull Flag
The bull flag reflects market optimism. During the flagpole phase, buyers dominate, pushing prices up quickly. The flag stage represents a period of indecision or profit-taking, but without enough selling pressure to reverse the trend. The breakout happens when buying momentum returns, driving prices even higher.
Volume Confirmation
Volume plays a critical role in confirming the pattern’s validity. High volume during the flagpole indicates robust buying activity. During consolidation, lower volume reflects weaker selling pressure, showing that the market is simply taking a breather.
Finally, a breakout accompanied by increased volume signals that the uptrend is resuming, giving traders confidence in the pattern’s reliability.
What is a Bear Flag Pattern?
A bear flag pattern is a bearish continuation signal that appears in a downtrend. It indicates that the price is likely to decline further after a brief pause. Traders widely use this pattern to anticipate downward price movements and plan exit strategies or short positions.
Here’s how it goes:
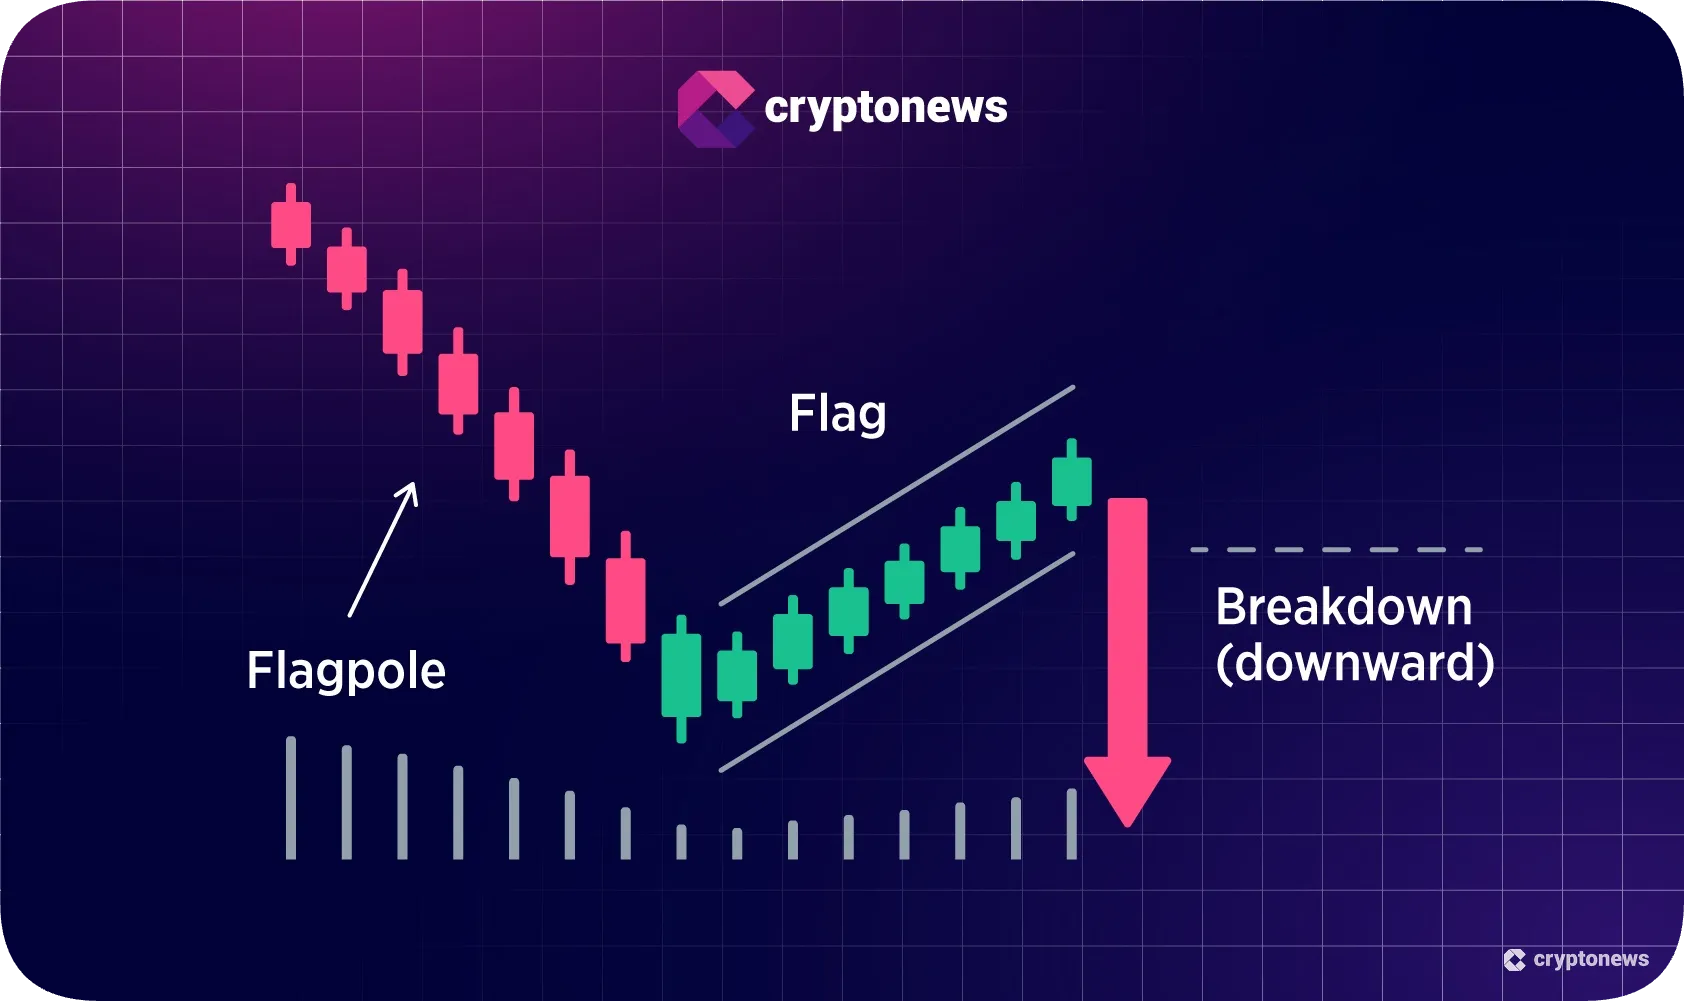
- Flagpole: The pattern begins with a sharp price drop, showing intense selling pressure.
- Flag: This is the consolidation phase where the price moves sideways or slightly upward in a channel, giving a false sense of recovery.
- Breakout: When the price breaks below the flag’s support line, the downtrend resumes, often with significant momentum.
The Psychology Behind the Bear Flag
The bear flag reflects market pessimism. The flagpole stage highlights aggressive selling as traders exit their positions. During the flag phase, the market takes a breather, with some buyers attempting to stabilize the price.
However, the lack of strong buying pressure keeps the bearish sentiment intact. The breakdown confirms sellers are regaining control, pushing the price further downward.
Volume Confirmation
Volume plays a crucial role in validating the bear flag. High volume during the flagpole signals strong selling pressure. Lower volume reflects a temporary pause rather than a trend reversal as the price consolidates.
When the breakdown occurs with increased volume, it confirms that the selling momentum is back, strengthening the bearish outlook.
Bull Flag vs Bear Flag: Key Differences
Bull and bear flags may look similar, but their interpretations are polar opposites. These patterns appear in different market trends and signal contrasting price movements.
Below is a quick comparison to help you understand their unique features.
| Aspect | Bull Flag | Bear Flag |
|---|---|---|
| Trend Direction | Uptrend continuation | Downtrend continuation |
| Flag Structure | Sideways or slight downward movement | Sideways or slight upward movement |
| Price Breaks | Breaks above flag resistance | Breaks below flag support |
| Volume Patterns | High during flagpole, low during consolidation, high on breakout | High during flagpole, low during consolidation, high on breakdown |
While both patterns involve a flagpole, flag, and breakout, the volume behavior during each stage sets them apart.
👉 For a bull flag, high volume during the flagpole signals strong buying pressure, which fades during consolidation as sellers fail to overpower buyers. When the breakout occurs, a volume surge confirms the uptrend’s resumption.
👉 In contrast, a bear flag shows high volume during the flagpole due to aggressive selling. The flag phase sees weaker buying attempts reflected in lower volume. The breakdown is validated by increased volume, signaling the return of selling momentum and the continuation of the downtrend.
These subtle but crucial differences make bull and bear flags powerful tools for understanding market dynamics and planning trades effectively.
How to Identify and Confirm Bull and Bear Flags
Recognizing bull and bear flags is critical for traders aiming to capitalize on price continuations. By focusing on the key components, marking trendlines, and analyzing volume patterns, you can confidently identify these patterns and confirm their validity before making a trade.
Recognizing Flag Components
The first step is spotting the three essential parts of a flag pattern: the flagpole, the flag, and the breakout.
A flagpole is the steep price movement (upward for a bull flag, downward for a bear flag) that establishes the trend. The flag follows, characterized by a period of consolidation where the price moves sideways or slightly counter to the trend within a narrow channel.
Finally, the breakout occurs when the price exits the flag’s boundaries, signaling the continuation of the trend.
Drawing Trendlines
To clearly define the flag, use trendlines to mark the upper and lower boundaries of the consolidation phase.
👉 For bull flags, draw a downward-sloping or flat channel connecting the highs and lows.
👉 For bear flags, mark an upward-sloping or flat channel. These lines help visualize the range of the consolidation phase and pinpoint potential breakout points.
Properly drawn trendlines clarify the pattern and make it easier to spot invalidations if the price breaks in the wrong direction.
Volume Analysis
Volume patterns are crucial for confirming the validity of a flag. During the flagpole phase, high volume indicates strong momentum driving the trend. In the consolidation phase, volume typically drops, signaling a pause in market activity rather than a reversal.
A spike in volume then confirms the breakout and validates the continuation of the trend. A breakout could be a false signal without volume confirmation, so always consider volume alongside the price action.
Trading Bull and Bear Flags
Based on these patterns, trading bull and bear flags effectively requires understanding how to enter, protect, and exit trades. By carefully setting up trades, placing stop-losses, defining profit targets, and managing false breakouts, you can maximize the reliability and profitability of flag-based strategies.
Setting Up Trades
The ideal entry point for trading flag patterns is at the breakout. For bull flags, place buy orders slightly above the flag’s resistance line, ensuring the price has clearly broken out of consolidation.
For bear flags, enter short positions just below the flag’s support line, anticipating a continuation of the downtrend. Waiting for the breakout reduces the risk of premature entries during consolidation.
Stop-Loss Placement
Stop-loss orders are crucial for limiting risk if the pattern fails.
👉 In bull flags, set the stop-loss just below the consolidation zone to protect against downside invalidations.
👉 For bear flags, place them slightly above the consolidation area to account for potential false upward movements.
Tight but strategic stop-loss placement prevents significant losses while allowing for minor price fluctuations.
Profit Targets
Setting realistic profit targets is vital for maximizing gains. A common approach is to measure the length of the flagpole and project it from the breakout point.
For example, if the flagpole in a bull flag represents a $50 price move, set your profit target $50 above the breakout.
Similarly, in a bear flag, calculate the target below the breakout using the same method. This strategy aligns with the natural price action of the pattern.
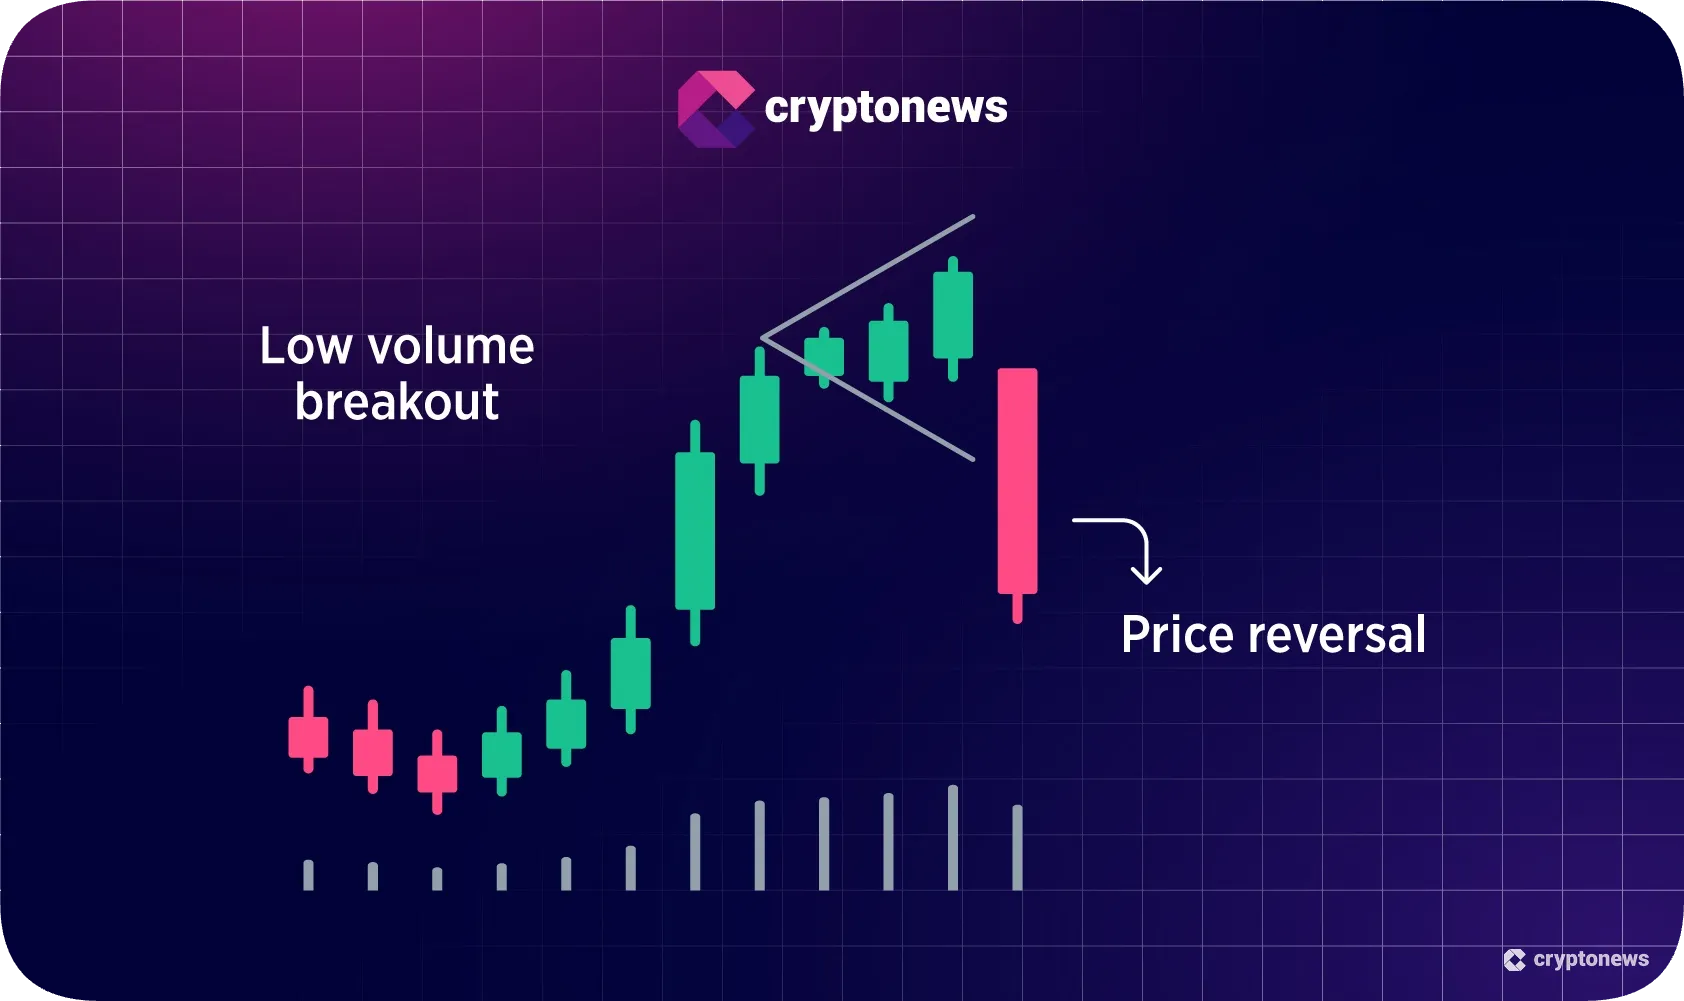
Managing False Breakouts
False breakouts can trap traders, so confirming the breakout is key. To validate the move, use secondary indicators like volume spikes or candle closes beyond the flag’s boundary.
Avoid entering the trade if the breakout lacks volume or the price quickly reverses. Waiting for confirmation might delay your entry slightly, but it significantly reduces the risk of getting caught in a fake-out.
Advanced Trading Strategies Using Flags
For traders seeking to enhance their trading game, combining flag patterns with advanced strategies can improve accuracy and profitability. Leveraging tools like moving averages, multi-timeframe analysis, and smart money concepts allows for deeper insights and more precise trade setups.
Moving Average Confluence
Incorporating moving averages, such as the 50 or 200 EMA, can strengthen flag pattern confirmations.
For bull flags, the moving average often acts as dynamic support during the consolidation phase, reinforcing the likelihood of an upward breakout.
In bear flags, the moving average can serve as resistance, supporting the continuation of the downtrend. When price action aligns with moving averages, it adds an extra layer of confidence to your trades.
Multi-Timeframe Analysis
Using multiple timeframes provides a broader perspective and sharper entry points. Spot flag patterns on higher timeframes (e.g., daily or 4-hour charts) to identify the dominant trend, then switch to lower timeframes (e.g., 1-hour or 15-minute charts) to refine your entries and exits.
This approach allows you to align with the macro trend while capitalizing on micro-level precision, reducing false signals.
Smart Money Concepts
Integrating concepts like order blocks or Fair Value Gaps (FVGs) adds an institutional trading perspective to your flag strategy. For bull flags, look for bullish order blocks or FVGs near the consolidation zone, as these areas often signify institutional buying interest.
Similarly, in bear flags, bearish order blocks or FVGs near the flag indicate potential sell pressure. These concepts help identify high-probability trade zones where institutional activity aligns with flag patterns.
Common Mistakes and Tips for Success
Trading flag patterns can be highly effective, but mistakes are easy if traders overlook key details or rush into trades. Understanding common pitfalls and implementing practical tips can significantly improve your success rate and overall strategy.
Overtrading Flag Patterns
One of the biggest mistakes traders make is relying too heavily on flag patterns without considering additional confirmation signals.
While flags are powerful tools, they should always be analyzed alongside other indicators, such as moving averages, trendlines, or volume. Avoid forcing trades when patterns don’t align with the broader market trend or when other confluences are absent.
Misinterpreting Volume Patterns
Volume is crucial for validating flag patterns, but misinterpreting it can lead to poor decisions. A common error is assuming a breakout is valid even when volume remains low.
Proper volume analysis involves checking for high volume during the flagpole phase, reduced activity during consolidation, and a significant spike at the breakout.
Ignoring these shifts increases the risk of falling into false breakouts or breakdowns.
Risk Management Tips
Effective risk management is essential for long-term success. Always set a stop-loss order just outside the consolidation zone—below for bull flags and above for bear flags—to protect against invalidations.
Use the flagpole length to set realistic profit targets, but remain flexible based on market conditions. Additionally, ensure your position size aligns with your risk tolerance, keeping losses manageable if a trade doesn’t go as planned.
Final Thoughts on Bull vs Bear Flag Pattern
Bull and bear flag patterns are invaluable tools for trend analysis and trading. They offer clear signals for market continuation during uptrends and downtrends. By mastering these patterns, traders can gain confidence in identifying potential breakouts and making timely entry or exit decisions.
However, no pattern works in isolation. Combining flag analysis with tools like volume indicators, moving averages, and multi-timeframe strategies can significantly improve trading outcomes. To truly excel, traders must pair technical knowledge with strong risk management practices.
👉 Learn More: Best Risk Management Strategies for Trading Crypto
FAQs
Can a Bear Flag Turn Bullish or Vice Versa?
How Reliable Are Flag Patterns in Crypto Trading?
What Causes Bull or Bear Flags to Fail?
2M+
250+
8
70


About Cryptonews
Our goal is to offer a comprehensive and objective perspective on the cryptocurrency market, enabling our readers to make informed decisions in this ever-changing landscape.
Our editorial team of more than 70 crypto professionals works to maintain the highest standards of journalism and ethics. We follow strict editorial guidelines to ensure the integrity and credibility of our content.
Whether you’re looking for breaking news, expert opinions, or market insights, Cryptonews has been your go-to destination for everything cryptocurrency since 2017.