
Bitcoin (BTC) Price Prediction 2026, 2027 – 2030
We believe in full transparency with our readers. Some of our content includes affiliate links, and we may earn a commission through these partnerships. However, this potential compensation never influences our analysis, opinions, or reviews. Our editorial content is created independently of our marketing partnerships, and our ratings are based solely on our established evaluation criteria. Read More


Bitcoin  BTC +1.10% and the whole crypto market have experienced extreme volatility since the 2024 US election,powering through the much-anticipated $125,000 mark in October 2025. BTC’s latest all-time high (ATH) took place on October 6, 2025 and stands at $126,173.18.
Its volatile price performance is due to macroeconomic and geopolitical uncertainty, while Bitcoin bulls continue to focus on key developments like the Bitcoin halving schedule, massive inflows into Bitcoin ETFs, the arrival of a more crypto-friendly US administration, and increasing institutional interest.
As of June 25, 2026, Bitcoin is trading at $64,231.88. This Bitcoin price prediction provides a detailed BTC price analysis, expert forecasts, and future value projections for the original cryptocurrency.
ℹ️ The data on this page, including Bitcoin price predictions and key metrics, is updated in real time. However, the underlying content and analysis are reviewed and updated monthly. All projections are based on current market trends, historical data, and proprietary estimation technologies, but are subject to change as market conditions evolve.
Bitcoin Price Prediction Overview
| Year | Price Targets | Key Factors |
|---|---|---|
| 2026 | $66,566.59 |
|
| 2027 | $70,578.05 |
|
| 2030 | $93,956.43 |
|
Bitcoin Price Analysis
As of early February 2026, Bitcoin is trading in the low-$70,000s after a sharp pullback and a brief test of the $70,000 area on February 4th. Several key levels have broken along the way, and that shift has traders watching for a clear bottom before they start retaking bigger bets.
Sentiment still feels shaky. The Crypto Fear and Greed Index still sits in Extreme Fear, around the mid-teens, and spot Bitcoin ETFs continued to withdraw funds in late January. The 50-day average is technically below the 200-day, thus the death-cross signal remains alive in general.
Short-term holders feel drops first, so many sit on paper losses and rush for exits. Traders now treat $70,000 as the next line in the sand. Lose it, and forced selling can follow. February has started choppy, and it stays that way until buyers return in size again.
The chart below provides an interactive view of our proprietary analysis model’s Bitcoin price prediction:
Recent Events Affecting Bitcoin’s Price
Over the last several months, a number of major events have affected the price of Bitcoin, including the US elections, institutional inflows into ETFs, shifting monetary policy, and more.
January 2026
- Coverage centered on a failed breakout at a major psychological level, followed by leveraged-long liquidations and profit-taking, which flipped short-term momentum and revived risk-off positioning.
- Reports pointed to mixed ETF flows and cautious Fed messaging as key headwinds, while geopolitical tension and big altcoin unlock sell-offs spilled into Bitcoin, keeping traders defensive.
December 2025
- Reports focused on weak macro sentiment after key U.S. data and Fed messaging reduced expectations for near-term rate cuts, triggering broad risk-off positioning and liquidation waves.
- Coverage highlighted spot Bitcoin ETF outflows, year-end de-risking, tax-loss harvesting, and added sell pressure from miners, while geopolitical tensions pushed capital toward traditional safe havens.
November 2025
- News outlets highlight record monthly Bitcoin ETF outflows above $2.33 billion, seen as a sign that big investors are stepping back.
- Coverage focuses on US fiscal worries and possible government shutdown, which darkens the outlook for risk assets and keeps sellers in control.
October 2025
- Trump unveils a 100% tariff on Chinese imports, jolting global markets and reigniting fears about inflation, growth, and financial stability.
- Crypto venues report the biggest single-day wipeout on record: over $19 billion in positions liquidated across roughly 1.6 million traders.
September 2025
- Fed cuts rates by 25 basis points on September 17, sparking optimism that cheaper money could fuel more demand for Bitcoin and other risk assets.
- Hopes cool as Fed guidance sounds cautious; mixed signals lead to short rallies followed by pullbacks whenever traders doubt the pace of further cuts.
August 2025
- At the beginning of August, Strategy disclosed that it had bought $2.46 billion of BTC the previous week, marking its third-largest purchase ever.
- Meanwhile, the media reported that President Donald Trump was about to sign an executive order allowing 401(k) accounts to invest in alternative assets, including crypto.


Bitcoin’s Price Forecast for the Next 30 Days
All eyes have been on Bitcoin since it broke through the $120,000 barrier and vaulted to an even higher ATH. Its impressive performance in the face of Donald Trump’s constantly shifting tariff policies has ensured that investor interest remains strong.
We use mathematical and statistical methods to predict Bitcoin prices based on historical data, and the following BTC estimated price targets are updated daily.
| Date | Potential Low | Average Price | Potential High |
|---|---|---|---|
| June 26, 2026 | $64,242.53 | $64,252.62 | $64,338.72 |
| June 27, 2026 | $64,253.30 | $64,273.60 | $64,446.84 |
| June 28, 2026 | $64,263.98 | $64,294.40 | $64,554.00 |
| June 29, 2026 | $64,274.68 | $64,315.24 | $64,661.38 |
| June 30, 2026 | $64,285.17 | $64,335.67 | $64,766.61 |
| July 1, 2026 | $64,295.70 | $64,356.18 | $64,872.27 |
| July 2, 2026 | $64,306.94 | $64,378.06 | $64,985.00 |
| July 3, 2026 | $64,317.66 | $64,398.94 | $65,092.59 |
| July 4, 2026 | $64,327.81 | $64,418.70 | $65,194.39 |
| July 5, 2026 | $64,338.68 | $64,439.87 | $65,303.48 |
| July 6, 2026 | $64,348.89 | $64,459.76 | $65,405.93 |
| July 7, 2026 | $64,359.65 | $64,480.72 | $65,513.95 |
| July 8, 2026 | $64,370.02 | $64,500.92 | $65,618.00 |
| July 9, 2026 | $64,381.55 | $64,523.36 | $65,733.62 |
| July 10, 2026 | $64,392.08 | $64,543.87 | $65,839.28 |
| July 11, 2026 | $64,402.08 | $64,563.34 | $65,939.59 |
| July 12, 2026 | $64,414.16 | $64,586.88 | $66,060.88 |
| July 13, 2026 | $64,423.93 | $64,605.89 | $66,158.84 |
| July 14, 2026 | $64,434.19 | $64,625.88 | $66,261.82 |
| July 15, 2026 | $64,445.48 | $64,647.87 | $66,375.08 |
| July 16, 2026 | $64,456.38 | $64,669.10 | $66,484.49 |
| July 17, 2026 | $64,465.90 | $64,687.64 | $66,579.98 |
| July 18, 2026 | $64,477.76 | $64,710.74 | $66,699.03 |
| July 19, 2026 | $64,486.66 | $64,728.07 | $66,788.31 |
| July 20, 2026 | $64,499.41 | $64,752.90 | $66,916.24 |
| July 21, 2026 | $64,510.39 | $64,774.28 | $67,026.39 |
| July 22, 2026 | $64,521.10 | $64,795.14 | $67,133.88 |
| July 23, 2026 | $64,529.12 | $64,810.77 | $67,214.38 |
| July 24, 2026 | $64,539.74 | $64,831.44 | $67,320.90 |
| July 25, 2026 | $64,551.32 | $64,853.99 | $67,437.05 |
Bitcoin Price Prediction 2026
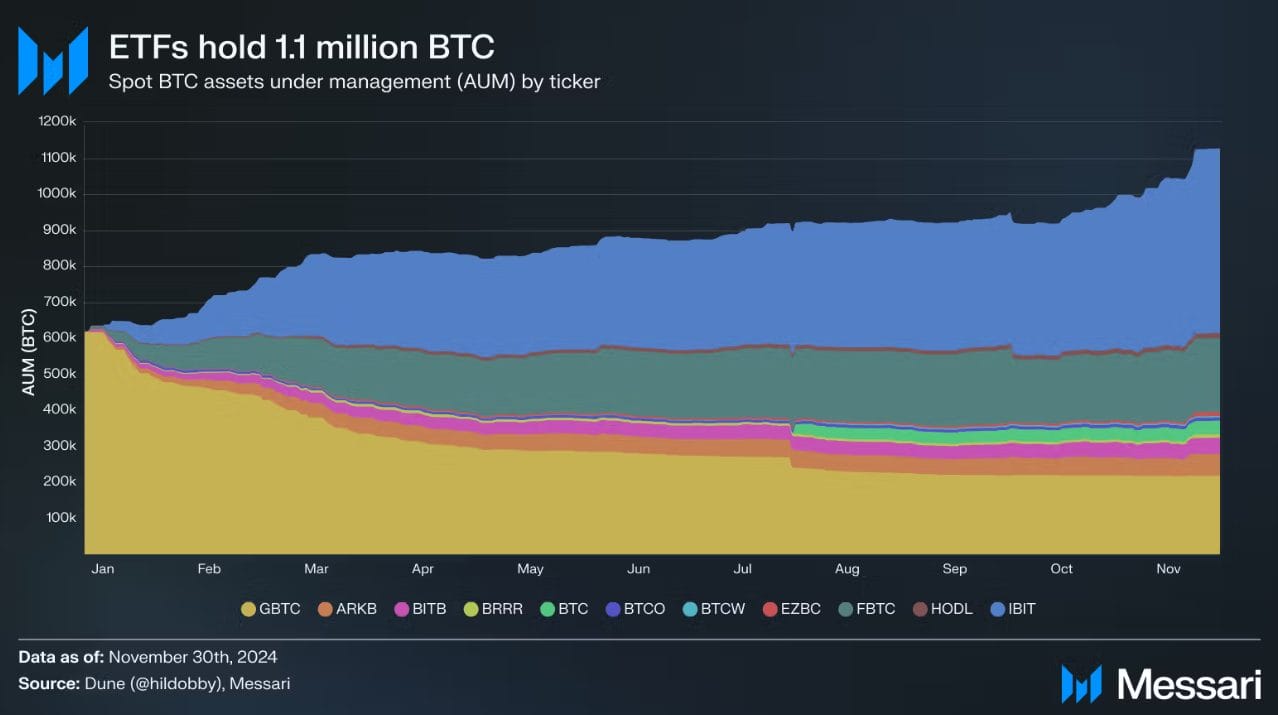
By 2026, institutional adoption and new technologies will likely drive Bitcoin’s price upward even further. Analysts at Bitwise and VanEck anticipate continued ETF inflows, with ETFs holding over 1.5 million BTC by 2026. Increased adoption by public companies, whose Bitcoin holdings could surpass Satoshi Nakamoto’s, remains a likely catalyst.
Regulatory clarity under Trump’s administration, including bipartisan stablecoin and blockchain legislation, could foster institutional confidence.
Progress in Bitcoin programmability could create new use cases and support higher valuations. However, increased competition from Ethereum and Solana, especially in programmability and DeFi, may reduce Bitcoin’s potential for growth in user and developer activity.
Other risks include macroeconomic factors like elevated Treasury yields or unexpected Federal Reserve rate hikes, which could shift capital away from Bitcoin. If global regulatory uncertainty or restrictive US political developments, such as Senate resistance to pro-crypto legislation, continue, momentum could slow down.
While volatility will likely persist, Bitcoin’s constrained supply and increasing institutional dominance could stabilize prices over time. If demand from ETFs and corporate buyers accelerates, Bitcoin could challenge gold’s market cap, inching closer to the $500,000 long-term targets proposed by Bitwise.
This is why our Bitcoin price prediction for 2026 forecasts a high of $67,733.94, a low of $65,399.23, and an average of $66,566.59.
Bitcoin Price Prediction 2027
By 2027, most Bitcoin price forecasts come down to two things: big buyers and limited new supply. Following the 2024 halving, the market receives fewer new BTC per day, and demand from ETFs and large corporate buyers can boost prices. Rules also play a role. With large markets receiving clearer crypto rules, more institutions will be able to enter the market, as legal risk for exchanges, funds, and banks will be reduced.
Tech changes can help as well. Additional Layer-2 tools and upgrades simplify using Bitcoin for activities such as trading and lending. The other chains are, however, still ahead in terms of speed and DeFi benefits.
Macro and politics are the big risks. The crypto money can be pulled out by high interest rates, intractable inflation, or even a risk-off sentiment. Demand can also be struck by new restrictions, stricter enforcement, or tax adjustments.
Bitcoin will probably stay volatile in 2027. Still, its fixed supply is simple to understand, and bigger, steadier buyers can reduce some wild swings. In the most optimistic scenarios, strong ETF and corporate demand are what get people talking about very high long-term targets.
These are the reasons why our Bitcoin price prediction for 2027 forecasts a high of $73,751.14, a low of $67,404.97, and an average of $70,578.05.
Bitcoin Price Prediction 2030
In 2030, supply constraints, institutional adoption, and macroeconomic factors could continue supporting Bitcoin’s price growth. Jack Dorsey predicts Bitcoin will exceed $1 million, while Cathie Wood projects $1.5 million. Both forecasts assume continued ETF inflows, global adoption, and Bitcoin’s status as digital gold.
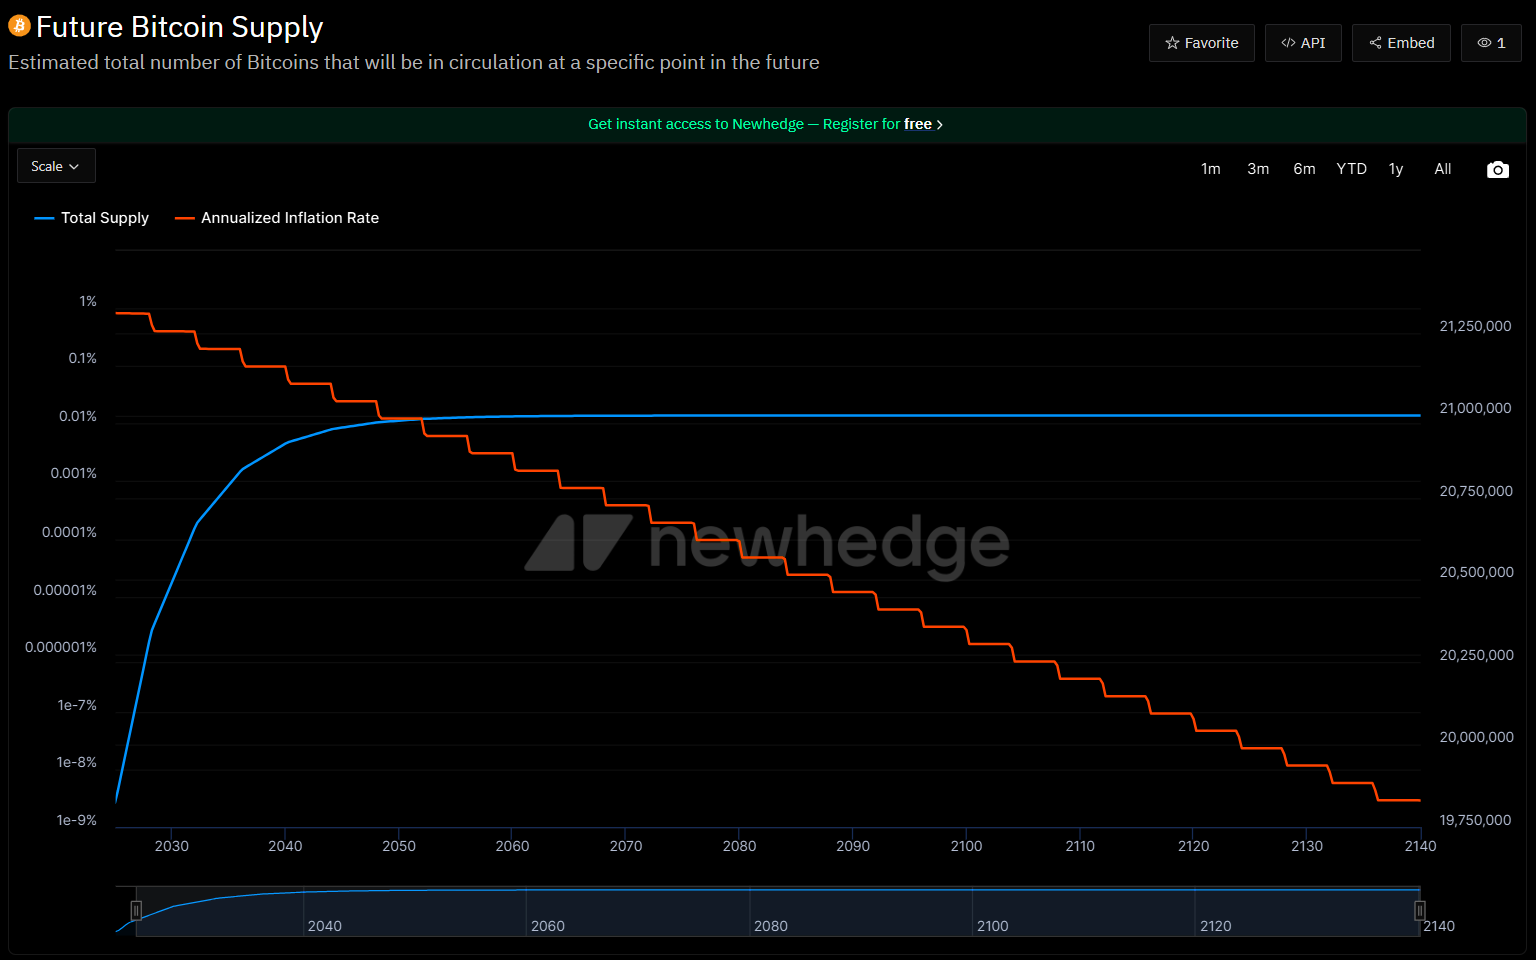
Bitcoin’s supply will be nearly exhausted, with 98% of the total 21 million coins mined, increasing scarcity. Rising demand from ETFs, corporations, and nation-states could accelerate accumulation, with governments like El Salvador leading adoption. Developments regarding the United States Strategic Bitcoin Reserve (and the country’s Digital Asset Stockpile) will likely provide additional positive catalysts.
Technological advances, including Bitcoin Layer 2 scaling solutions, could unlock new use cases, driving demand. Still, key risks include central bank digital currencies (CBDCs) undermining Bitcoin’s narrative, unexpected regulatory crackdowns, or macro shifts toward safer assets.
Could Bitcoin reach $1 million by 2030?
Yes, a $1 million valuation for Bitcoin is possible. However, challenges remain. For instance, institutional inflows may be stifled due to excessive volatility and regulatory risks. As a result, our 2030 prediction for the price of Bitcoin includes an average of $93,956.43, with a high of $112,195.50 and a low of $78,037.08.
Bitcoin Price Potential Highs and Lows
Bitcoin will likely remain one of the market’s top trending cryptos for years to come. With that in mind, the table below presents an overview of our Bitcoin price forecasts for the coming years.
| Year | Average Price | Potential Low | Potential High |
| 2026 | $66,566.59 | $65,399.23 | $67,733.94 |
| 2027 | $70,578.05 | $67,404.97 | $73,751.14 |
| 2029 | $86,895.56 | $74,993.92 | $99,994.15 |
| 2030 | $93,956.43 | $78,037.08 | $112,195.50 |
What Other Analysts Predict for Bitcoin’s Price
We are not alone in making Bitcoin price predictions. Here are some predictions from other reputable websites and analysts.
Brad Garlinghouse (Ripple CEO)
Brad Garlinghouse, the Ripple CEO, predicts Bitcoin will hit $180,000 in 2026, due to favorable market and regulatory conditions.
Matt Hougan (Bitwise CIO)
Matt Hougan, the CIO of Bitwise, says that “We were not expecting the amount of selling at $100,000,” while reiterating his $200,000 target for 2026.
Carol Alexander (University of Sussex Professor)
Carol Alexander estimates Bitcoin will maintain a high-volatility range $75,000-$150,000, with a central tendency around $110,000..
James Butterfill (CoinShares Head of Research)
CoinShares Head of Research projects Bitcoin will stay between $120,000-$170,000 in 2026, with more favorable price movements likely in the latter half. r.
Wei Yang (Bit Mining Chief Economist)
Wei Yang, the Bit Mining Chief Economist, predicts Bitcoin will rise to $225,000 by the end of 2026, supported by possible rate cuts and favorable regulations.
Jack Dorsey
Jack Dorsey, former Twitter CEO (now X), predicts Bitcoin could exceed $1 million by 2030 due to its ecosystem growth and increasing adoption.
Cathie Wood
Cathie Wood, CEO of Ark Invest, projects Bitcoin to reach $1.5 million by 2030, driven by institutional adoption and its position as digital gold.
Bitcoin Price History
From its launch in 2009 to record highs in 2025, Bitcoin has evolved from an experimental asset into a globally recognized financial instrument. Below is a breakdown of BTC’s milestones and price history.
2009-2012: The Creation of Bitcoin
In 2009, Satoshi Nakamoto mined Bitcoin’s genesis block. Initially, transactions were informal; the first retail exchange happened in 2010 when 10,000 BTC bought two pizzas. Bitcoin’s price began near zero, reaching $1 in 2011 as adoption grew. By 2012, Bitcoin had gained credibility as:
- The Bitcoin Foundation was formed.
- WordPress and over 1,000 merchants started accepting BTC as a payment method.
- BTC’s price peaked at $13.
2013: The First Bull Run
In 2013, Bitcoin saw rapid adoption and price volatility. Coinbase sold $1M in Bitcoin in February at $22 per BTC. By April, Mt. Gox trading glitches caused a crash from $266 to $76, recovering to $160 within hours. Regulatory clarity emerged as FinCEN categorized miners as Money Service Businesses, while Thailand banned Bitcoin trading.
Key events included the FBI seizing 26,000 BTC during Silk Road’s shutdown and launching the first Bitcoin ATM in Vancouver. By November, BTC China led global trading volumes, and the University of Nicosia began accepting Bitcoin for tuition. However, China’s central bank banned Bitcoin transactions in December, dropping prices after a peak of over $1,100.
2014-2015: Broader Adoption and Challenges
In 2014, companies like Overstock, TigerDirect, and Microsoft started accepting Bitcoin; Dell and Newegg followed suit. Regulatory progress came with the CFTC approving a Bitcoin financial product. Sponsorships like the Bitcoin St. Petersburg Bowl catapulted Bitcoin into the mainstream. Major setbacks included Mt. Gox’s collapse after losing 744,000 BTC.
In 2015, adoption surged, with over 100,000 merchants accepting Bitcoin. Coinbase raised $75M in Series C funding, a record for crypto firms. Despite hacks like Bitstamp, which lost 19,000 BTC, confidence rebounded. Academic recognition grew with the Ledger journal and proposals to standardize Bitcoin’s symbol.
2016-2017: The Second Bull Run
In 2016, Bitcoin reached major milestones. Important technical updates included the CheckSequenceVerify soft fork and the network hash rate surpassing 1 exahash/sec. Japan officially recognized Bitcoin as a currency-like asset, while Swiss ticket machines started accepting Bitcoin for purchases by year-end.
However, the Bitfinex hack stole 120,000 BTC, valued at approximately $60 million, which raised security concerns. Still, adoption kept surging in 2017. BitPay transactions tripled year-over-year, Japan legalized Bitcoin payments, and Russia moved toward regulation.
Crucially, Bitcoin split on August 1 into BTC and Bitcoin Cash (BCH) after block size debates. Prices soared.
2018-2019: Bitcoin Crash and Recovery
In 2018, Bitcoin faced regulatory and adoption challenges. South Korea banned anonymous trading, and Stripe phased out Bitcoin payments due to high fees. Price manipulation concerns led to a US Department of Justice investigation into spoofing and wash trades.
Bitcoin gained visibility through public protests by October, such as Nelson Saiers’ inflatable rat art installation near the Federal Reserve. After the 2018 crash, Bitcoin started below $4,000 in 2019 but surged to over $12,000 in July, with renewed optimism. Regulatory scrutiny and market recovery defined this period.
2020-2021: The Pandemic Era Rally
In 2020, institutional adoption advanced as Swiss companies launched Bitcoin exchange-traded products (ETPs), and the Frankfurt Stock Exchange listed its first Bitcoin ETN. PayPal began supporting Bitcoin trading with limited withdrawals.
In 2021, Bitcoin’s price soared, influenced by high-profile endorsements. Elon Musk’s Twitter (now X) support and Tesla’s $1.5 billion Bitcoin purchase pushed prices to $44,141. Tesla’s later suspension of Bitcoin payments over environmental concerns caused a 12% price drop.
El Salvador made history by adopting Bitcoin as legal tender in June. Meanwhile, Zug, Switzerland, started accepting Bitcoin for taxes, and the US Justice Department recovered $2.3 million in Bitcoin from a ransomware attack.
2022: The Bear Market
In 2022, Bitcoin faced a prolonged bear market. Prices fell below $40,000 in April, hitting $26,970 in May after the Terra-Luna collapse. By June, Bitcoin dropped below $18,000. High-profile blow-ups such as FTX hurt traders’ confidence.
2023: Recovery and Institutional Interest
Bitcoin rebounded in 2023. It rose over 50% by mid-year amid a tech stock rally and interest rate stabilization. Prices climbed from $16,530 in January to over $42,000 by year-end, mostly driven by rumors of SEC approval for Bitcoin ETFs.
Bitcoin Ordinals launched. It introduced NFTs and utility to the network. Despite SEC crackdowns, Bitcoin remained resilient. It traded around $27,000 but recovered strongly and broke higher in October.
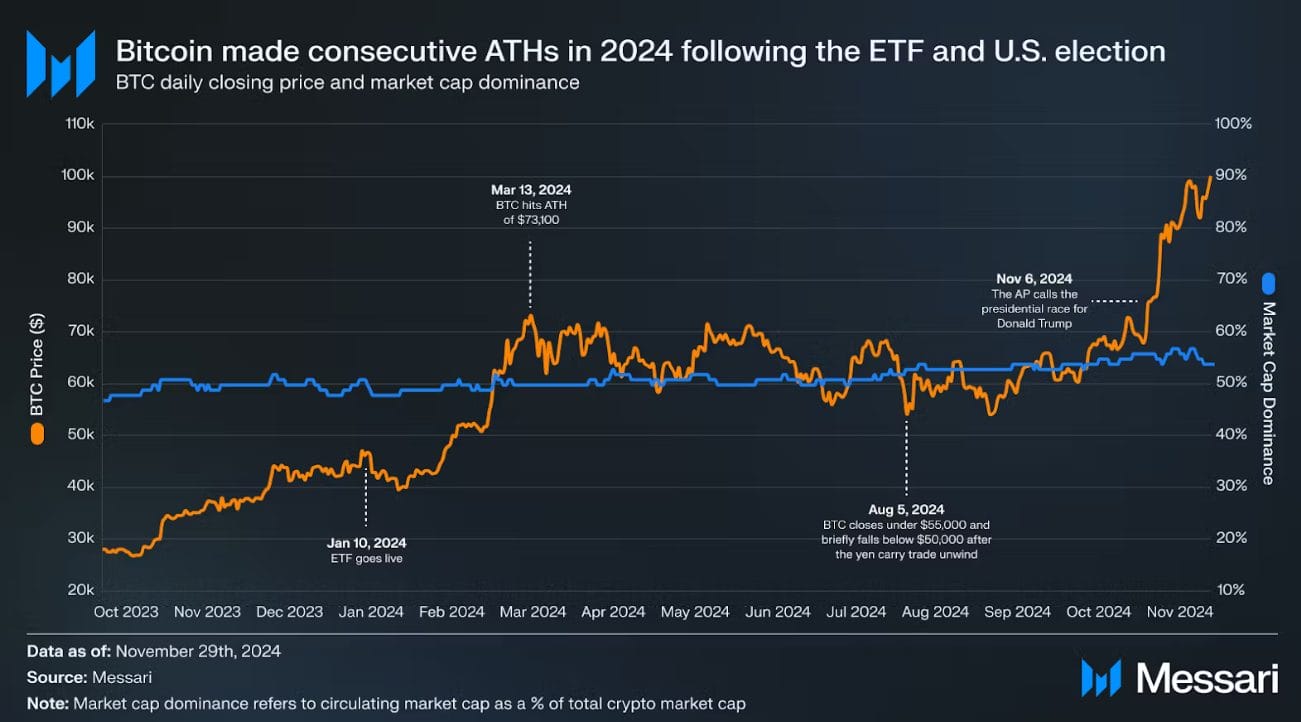
2024: ETFs Approval, the Bitcoin Halving, and Renewed Optimism
Bitcoin had a monumental year in 2024 with record-breaking price action. The long-awaited approval of Bitcoin Spot ETFs was pivotal. By January 11, 11 ETF funds debuted, drawing massive institutional interest. Bitcoin surged past $49,000 pre-announcement, reaching $73,835 on Coinbase by March 1. The market consolidated by late March, trading at around $70,000.
On April 19, Bitcoin underwent its fourth halving, which reduced mining rewards from 6.25 to 3.25 BTC. This sparked modest gains, with Bitcoin closing at $63,821. Due to the Fed’s first post-pandemic interest rate cut in September, market sentiment turned positive, and BTC rallied from $60,000 to $64,000 within days.
November was a key month. After Trump’s re-election, Bitcoin skyrocketed due to his pro-crypto stance. On November 7, it reached $76,999; by November 13, it breached $91,000. Optimism took over the market due to Trump’s promises, including the creation of a “Strategic Bitcoin Reserve.”
Bitcoin crossed the $100,000 milestone for the first time on December 5, hitting multiple new ATHs afterward and closing the year at $93,425.
Q1 and Q2 2025: New Record High, Market Volatility Continues
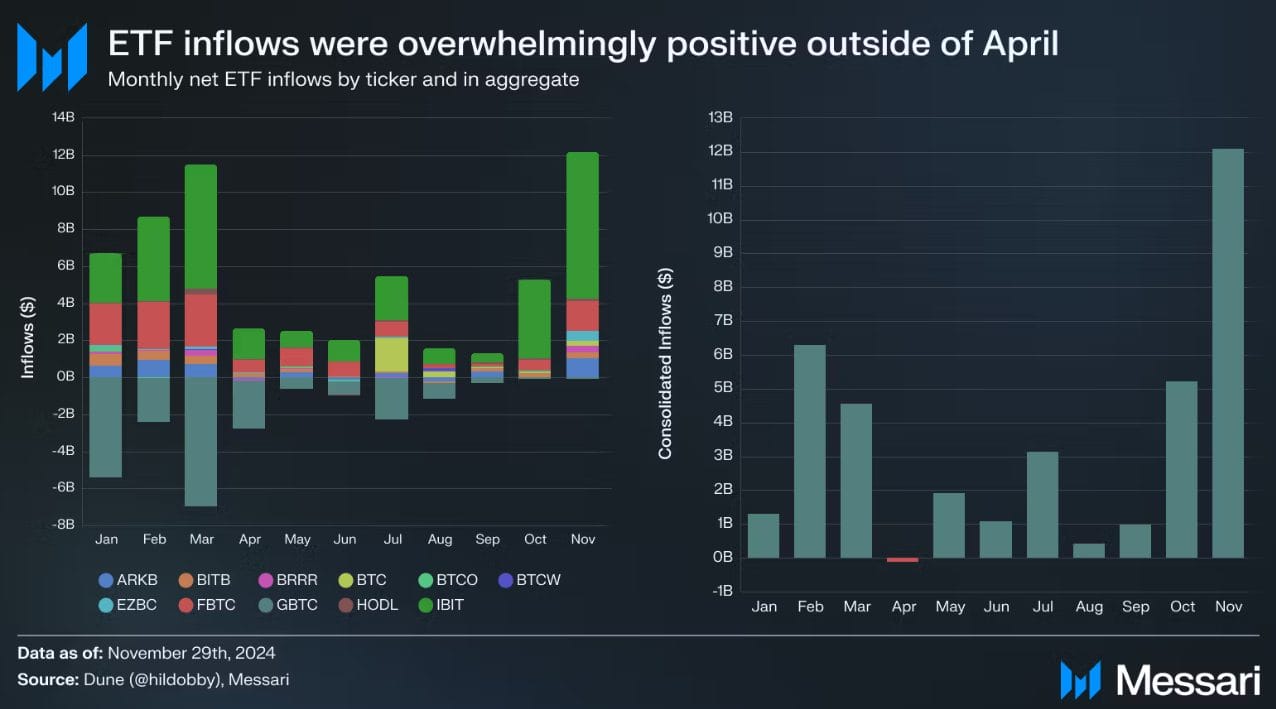
Bitcoin started 2025 strong, riding the momentum from December 2024. Spot Bitcoin ETFs in the US saw inflows of $1.9 billion in early January, creating a supply-demand imbalance as ETFs acquired 51,500 BTC, far exceeding the 13,850 BTC mined that month.
This ETF-driven demand contributed to Bitcoin reaching a record $108,135 on December 17, 2024. However, government rumors of selling Silk Road-seized BTC caused temporary price dips to $92,838 in January.
Speculation of crypto-friendly executive orders reignited enthusiasm. In January 2025, Bitcoin rebounded above $100,000 as institutional investors poured in. US entities now hold 65% of global Bitcoin reserves.
MicroStrategy, leading corporate Bitcoin adoption, increased holdings to 450,000 BTC, valued at over $45 billion. Japanese firm Metaplanet announced plans to quintuple its reserves to 10,000 BTC, further highlighting Bitcoin’s role as a strategic reserve asset.
BlackRock expanded its Bitcoin ETF dominance by launching a Canadian spot ETF in January, following the US success. Bitcoin’s correlation with the Nasdaq 100 hit a two-year high (0.77), highlighting its sensitivity to macroeconomic data. Inflation cooling to 3.2% also spurred optimism. Markets are betting on further Federal Reserve rate cuts.
Shortly after Donald Trump’s return to the Oval Office, his administration and the SEC began implementing a new range of plans to update crypto industry regulations and use them to support Web3 innovation.
The United States also moved toward establishing a Strategic Bitcoin Reserve and a separate Digital Asset Stockpile (although detailed expansion plans are still in development).
Key meetings between government officials and Web3 industry leaders are ongoing via roundtable sessions and follow-up discussions after the White House Crypto Summit event.
Q3 and Q4 2025: From Calm Climb to Rough Correction
Between Q3 and Q4 2025, Bitcoin went from a steady climb to one of its most stressful periods of the year.
In Q3, Bitcoin built on the strong gains it had made earlier in the year but began to slow down. Prices mostly moved sideways, with only a small overall increase. Big investors, including companies like MicroStrategy, continued to buy, which helped support the price. In September, a cut in US interest rates injected more money into the market, giving Bitcoin an extra boost. Trading activity picked up, however, indicating that some holders were preparing to take profits. Price swings were noticeable but not extreme, and the market felt like it was “coiling” for a bigger move.
That big move came in early Q4. At the start of October, Bitcoin reached a new record high near $126,000. The celebration did not last long. News of a 100% tariff on Chinese imports from President Trump sparked panic, and Bitcoin quickly dropped about 18% to around $104,000. October then saw the largest single-day crypto liquidation in history, with billions of dollars wiped out as traders were forced to close positions.
November brought more trouble. Huge amounts of money flowed out of Bitcoin exchange-traded funds, and futures traders faced another multibillion-dollar wipeout, causing the price to fall to a six-month low near $95,000. Worries about US debt and interest rates added pressure. Even so, large long-term holders continued to buy near these lower levels, helping to establish a floor for a possible recovery going into 2026.
Where is the Best Place to Buy Bitcoin?
The best place to buy Bitcoin depends on your goals, expertise, location, and risk tolerance. Below is a breakdown of options for different types of investors.
Short on time? Here’s the gist:
- Trading and high liquidity needs? Use centralized exchanges like Binance or Kraken.
- Privacy-focused or self-custody advocate? Opt for decentralized exchanges or P2P platforms. Then, store your holdings in a non-custodial wallet.
- Simple, long-term holding? Brokerage platforms like eToro or Revolut are suitable.
- Large-volume trades? OTC desks offer the best execution and privacy.
| Option | Best for | Advantages | Drawbacks | Examples |
| Centralized Exchanges (CEXs) | High liquidity, advanced tools, and ease of use | High liquidity, user-friendly, and advanced trading features | Custodial, regulatory restrictions, potential hacks | Binance, Coinbase, Kraken |
| Decentralized Exchanges (DEXs) | Privacy-focused users and self-custody advocates | Full custody of assets and resistance to censorship | Lower liquidity, self-management of keys, and slippage risks | Uniswap, Raydium, Jupiter |
| Brokerage Platforms | Long-term investors seeking simplicity | Simple, integrated tools for tax reporting and education | Limited features, lacks advanced trading tools | eToro, Robinhood, Revolut |
| Over-the-Counter (OTC) Desks | High-net-worth or institutional investors | Large transactions with minimal market impact | High minimum amounts; requires KYC | Coinbase Institutional, Galaxy Digital, Cumberland |
| Peer-to-Peer (P2P) Platforms | Privacy-conscious buyers or restricted regions | Direct trading, flexible payment methods | Counterparty risk, slower transactions | OKX P2P, Paxful, Hodl Hodl |
Evaluate fees, liquidity, features, and security to choose the best platform for your needs and Bitcoin investment strategy.
For maximum convenience, industry-leading security, and a wide range of additional Web3 management features, we recommend Best Wallet as the top-performing platform for anyone looking to buy Bitcoin today:
Best In-Wallet Crypto Exchange![]()
![]() Claim Offer
Claim Offer
Conclusion
Bitcoin has evolved from a creative experiment into a globally respected financial asset. The approval of ETFs and institutional interest has further legitimized BTC as an investment and store of value.
While recent years have brought sharp rallies followed by steep corrections, most long-term outlooks still see room for Bitcoin to grow over time. Increasing scarcity, ongoing development on and around the Bitcoin network, and deeper integration with traditional finance all suggest that Bitcoin could continue to trade in higher ranges than in past cycles, even if the path remains uneven.
Still, investing in Bitcoin involves market volatility, potential losses, and other risks. Make sure you do your own research and consider consulting a financial advisor before making investment decisions. Past performance is not indicative of future results.
👉 Don’t Miss: Ethereum Price Prediction 2026–2030
FAQs
What will BTC be worth in 2026?
What will Bitcoin be worth in 2030?
What was the starting price of Bitcoin?
What was Bitcoin’s highest price?
Is Bitcoin a good investment?
References
- BTCUSD Technical Analysis (TradingView)
- Millennium, Capula, Tudor pile bitcoin ETFs into portfolios (Reuters)
- Cryptocurrency Market Size, Share & Trends Analysis Report 2025-2030 (Research and Markets)
- Cryptocurrency Market Size To Reach $11.71 Billion By 2030 (Grand View Research)
- Future Bitcoin Supply (Newhedge)
- Jack Dorsey Says Bitcoin Price Will Go Beyond $1 Million in 2030 (CoinDesk)
- ARK’s Cathie Wood: Bitcoin Will Be $1 Million per Coin by 2030 (Bloomberg)
- The History of Bitcoin (Wikipedia)
- SnapShot 189 — Chart of the Week (Crypto.com)
- BTC’s monthly average correlation with Nasdaq 100 reached its highest point since Sept 2022 (Crypto.com)
- Blackrock Launches Canadian Spot Bitcoin ETF (Gemini)
- Spot Bitcoin ETFs Outpace Supply in December (Gemini)
- Establishment of the Strategic Bitcoin Reserve and United States Digital Asset Stockpile (The White House)
- Bitcoin: November 2025 turns historic – For all the wrong reasons (Amb Crypto)
- Bitcoin’s November 2025 Correction: A Crypto Winter or Broader Market Re-rating? (AInvest)
- Why October 2025 Will Go Down as the Most Cursed Month in Crypto (Yahoo Finance)
- MicroStrategy Adds Another Billion Worth Of Bitcoin, Will Sell More Shares For Future Buys (Investopedia)
- ‘Largest Ever’ Crypto Liquidation Event Wipes Out 6,300 Wallets on Hyperliquid (Yahoo Finance)
- 4 US Economic Events to Shake Bitcoin Sentiment in First Week of December 2025 (Yahoo Finance)
- Bitcoin’s 2025 rollercoaster may end on a low (Reuters)
- January 2026: Key Events to Watch in Crypto and Macroeconomics (Binance Square)
2M+
250+
8
70


About Cryptonews
Our goal is to offer a comprehensive and objective perspective on the cryptocurrency market, enabling our readers to make informed decisions in this ever-changing landscape.
Our editorial team of more than 70 crypto professionals works to maintain the highest standards of journalism and ethics. We follow strict editorial guidelines to ensure the integrity and credibility of our content.
Whether you’re looking for breaking news, expert opinions, or market insights, Cryptonews has been your go-to destination for everything cryptocurrency since 2017.