XRP Soars Higher as Three Bullish Technical Signals Flash


Despite only slight gains seen in bitcoin (BTC) and most major altcoins today, the Ripple-affiliated XRP token continued its surge higher in the market, while technical analysis shows several bullish signals.
At pixel time (10:59 UTC), XRP was up by almost 9% over the past 24 hours, with the majority of the gains seen late last night in the US and in the early hours of the Asian trading session today.
The gains today made XRP the second-best performing cryptoasset among the top 20 coins by market capitalization, following only EOS, which was up nearly 10% at the same time. Additionally, today’s gains also mean that XRP now leads BTC on a weekly basis, with a 7-day performance of 21%, versus bitcoin’s 18% rise over the same period.
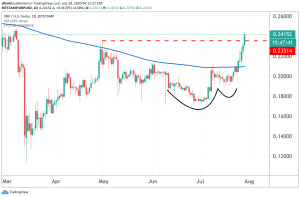
The rally in XRP first started to gain momentum as the price of the coin broke through its 200-day moving average line on Saturday, bringing additional gains on both Monday and Tuesday this week.
The 200-day moving average has acted as important resistance for the XRP price recently, with failed attempts at breaking above it seen on many occasions, including on April 30, June 2, and July 9. A break above this line might lead to a strong rally, as traders speculate that the coin may be entering a bull market.
Following the gains on Monday and Tuesday, the price also followed through with further gains today, which caused it to break above its post-Black Thursday high from April 30 at around USD 0.23.
Lastly, traders basing their decisions on technical analysis may also have noticed a so-called cup-and-handle pattern in the chart, as the price broke higher during the weekend, further boosting optimism.
The cup-and-handle pattern is among the best-known classical chart patterns, typically seen by technical analysts as the beginning of a bullish trend.
- Elon Musk Grok AI Predicts Shocking XRP Price in The Next 28 Days
- This ChatGPT AI XRP Price Prediction Should Not Make Sense But It Does
- Elon Musk Accepts Dogecoin for SpaceX Payments as DOGE Stalls Ahead of Historic IPO
- Nobody Wants To Admit Google Gemini AI Might Be Right About XRP Price Prediction
- XRP News: David Schwartz Just Said XRP Is Becoming a Settlement Layer for Stocks and Loans, Is the Infrastructure Actually Ready?
2M+
250+
8
70


- Elon Musk Grok AI Predicts Shocking XRP Price in The Next 28 Days
- This ChatGPT AI XRP Price Prediction Should Not Make Sense But It Does
- Elon Musk Accepts Dogecoin for SpaceX Payments as DOGE Stalls Ahead of Historic IPO
- Nobody Wants To Admit Google Gemini AI Might Be Right About XRP Price Prediction
- XRP News: David Schwartz Just Said XRP Is Becoming a Settlement Layer for Stocks and Loans, Is the Infrastructure Actually Ready?
More Articles

