This is How Bitcoin Changed Since Its Second Halving in 2016

The Bitcoin (BTC) mining reward is halving today, and the entire industry is focused on it to see what’ll happen afterward. Though we may not know what the future has in store for BTC, we know its past – and we know that in the four years since the second halving, many of the network metrics of this world’s oldest cryptocurrency have seen increases of three or four digits.

Being a vital part of the very basis of the world’s number one coin, and their preliminarily dates being known already, the halving of the Bitcoin mining reward is a much-anticipated, much-discussed event. Part of this anticipation is the fact that, despite BTC going through two of these before, within the drastically changed crypto landscape of 2020, nobody can say for sure what the impact of this halving will be immediately following the event, and more importantly, in the long run.
In preparation for this third halving – when the digital currency’s rate of new supply will be reduced in half from BTC 12.5 per mined blockchain block to BTC 6.25 – we stepped back to look at a larger picture. We observed Bitcoin’s progression over time: from its second halving in July 2016 until May 10 this year. This is what we discovered:
- BTC price is up by 1,364%.
- The market capitalization increased by 1,688%.
- Hashrate (computing power of the network) saw the largest increase of the eight: 7,836%.
- The number of transactions per day went up by 36%.
- The average value of transactions increased by 327%.
- The average fee per transaction, compared to 2016 halving, is up more than 608%.
- The active address count saw an increase of 57%.
- The number of tweets with the hashtag “bitcoin” is also up, by 29%.
Here are more details on individual network metrics (90-day simple moving average, source: Bitinfocharts.com).
| Metrics | July 9, 2016 | May 10, 2020 | Difference |
|---|---|---|---|
| Price, USD | 535 | 7,830 | 1,364% |
| Market cap, USD | 8B | 143B | 1,688% |
| Hashrate | 1.4E | 111.1E | 7,836% |
| Transactions | 221,000 | 300,000 | 36% |
| Avg. value of transactions, USD | 6,000 | 25,600 | 327% |
| Avg. transaction fee, USD | 0.137 | 0.97 | 608% |
| Active addresses | 430,000 | 674,000 | 57% |
| Tweets (per day) | 24,000 | 31,000 | 29% |
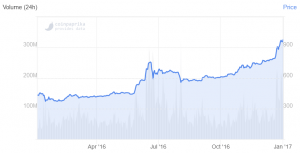
Bitcoin price chart in 2016, leading up to and following the halving on July 9:
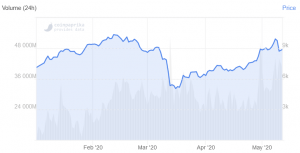
Bitcoin price chart in 2020:
And this is a five-year change in searches for “bitcoin halving” on Google.
Meanwhile, following a recent rally, the traders were left confused on Sunday when BTC price crashed. The market sentiment for both the 7-day and 24-hour period dropped as well. Nonetheless, a few days ago, some bullish signs from the mining industry were sent, as miners were hoarding BTC, expecting higher prices and buying rigs in the thousands, while the recent rally made older rigs profitable again.
____
Learn more:
These Miners Might Suffer The Most After Bitcoin Halving
Bitcoin’s Halving: Stars are Aligning for Next Big Bull-Run
Four Reasons Why Bitcoin Might Not Rally Right After The Halving
Six Bitcoin Halving Scenarios and Likelihood of Each
Bitcoin Halving as ‘A Crypto Super Cycle Marketing Event’ & Its Three Narratives