Solana Price Prediction: Descending Triangle Indicates Imminent 30% Drop to $102
We believe in full transparency with our readers. Some of our content includes affiliate links, and we may earn a commission through these partnerships. However, this potential compensation never influences our analysis, opinions, or reviews. Our editorial content is created independently of our marketing partnerships, and our ratings are based solely on our established evaluation criteria. Read More


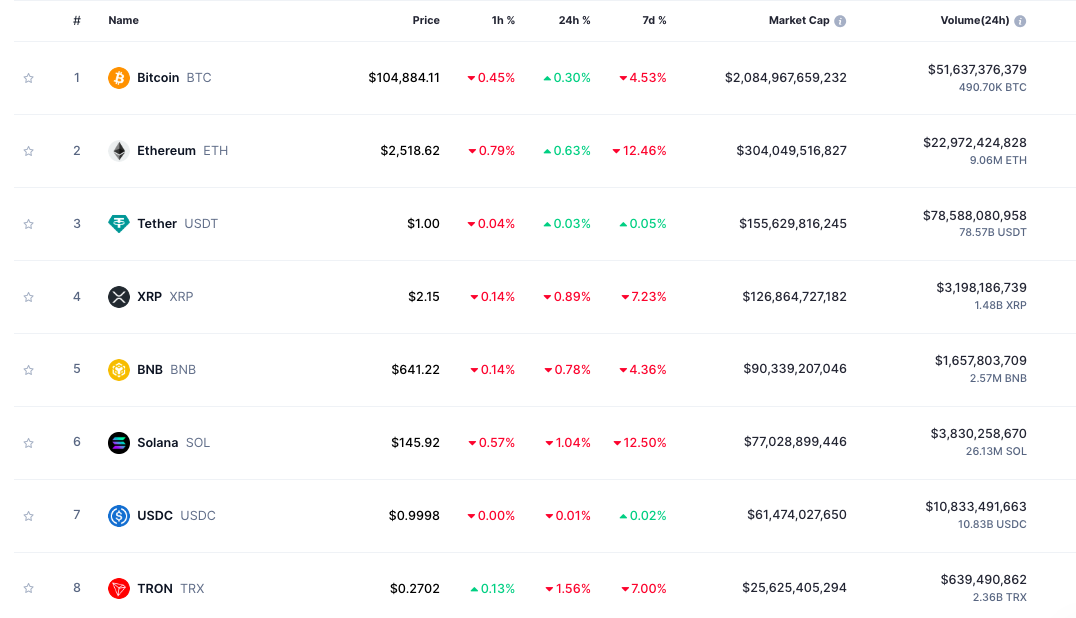
SOL teeters on the edge of a 30% collapse as a bearish triangle pattern targets $102. The once-soaring blockchain has shed 12.5% this week, despite generating $4.79 million in daily revenue, leaving traders torn between technical doom and fundamental strength.
Solana price struggles come despite its strong ecosystem performance, with all eyes now on whether key support will hold or if the token will fall further behind XRP in market rankings.
Solana Crushes All Rivals with $4.79M Daily Revenue Despite Price Decline.
Despite this lackluster performance, Solana continues to establish itself as one of the most dominant payment networks and an expanding hub for consumer applications.
The platform dominates in user adoption, boasting over 3.25 million active wallet addresses. This far surpasses Ethereum’s and nearly equals Tron’s 2.58 million.
While Solana’s $8.4 billion in DeFi Total Value Locked (TVL) remains well below Ethereum’s $62 billion, it outperforms all major blockchains in revenue generation.
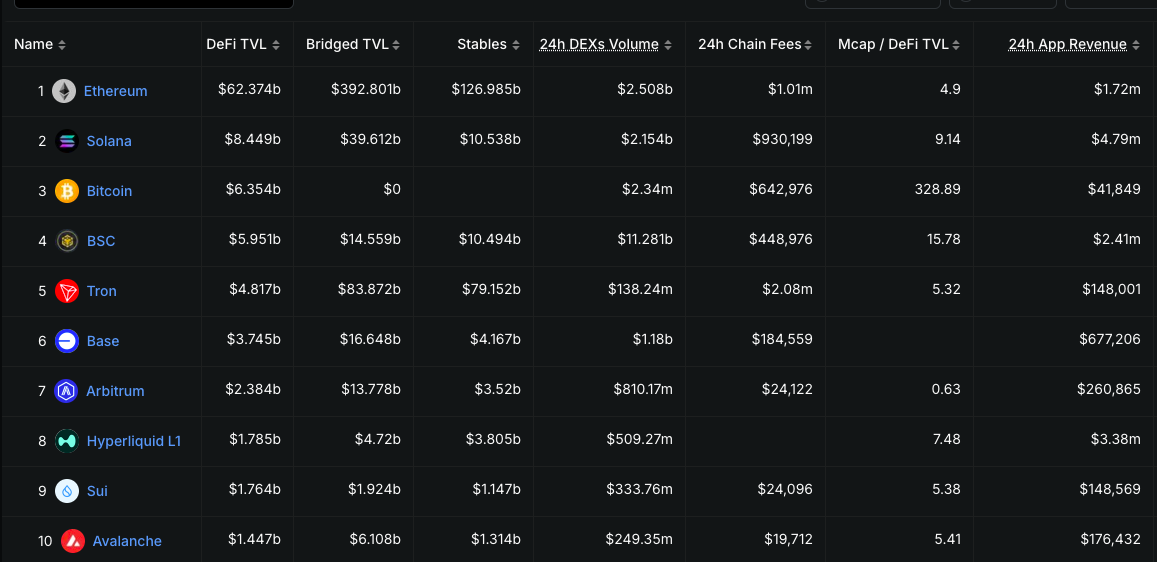
Over the past 24 hours, Solana produced over $4.79 million in revenue, with only Hyperliquid and Binance Smart Chain (BSC) coming close at $3.38 million and $2.41 million, respectively.
These metrics have led many to view $SOL as an undervalued asset at current Solana price levels and market capitalization.
$140-145 Key Support Zone Holds SOL’s Fate Amid VanEck DTCC Filing Hopes
Technical analysts are closely watching Solana’s price action as it tests a key Fibonacci retracement zone between 0.618 and 0.786, a level that has historically indicated potential trend reversals.
Analyst VipRoseTr identifies a falling wedge pattern (typically bullish) on SOL’s daily charts, though the broader trend remains contested by longer-term bearish structures.
According to this analysis, a successful hold above current support levels could propel SOL toward near-term targets of $204.31, with medium-term potential reaching $229.01 and possibly testing 2021 highs near $258.45.
Many consider these targets achievable given the growing possibility of Solana ETF approval. VanEck’s Solana ETF ($VSOL) was registered with the U.S. Depository Trust & Clearing Corporation (DTCC) on June 18.
While this doesn’t constitute SEC approval, it represents a preparatory measure, similar to the process followed by Bitcoin and Ethereum ETFs, as VanEck positions itself for potential regulatory clearance.
The SEC recently postponed its decision on the Franklin Spot Solana ETF. However, Bloomberg analyst Eric Balchunas maintains that approval odds remain at 90%, citing ongoing discussions between the SEC and ETF issuers as an encouraging development.
SOL Tests $140 Support as Triangle Points to $102 Breakdown Target
Solana’s technical setup presents a key inflection point as it forms a descending triangle pattern—a formation that typically indicates bearish continuation.
Over recent months, SOL’s price action has painted a clear picture of successively lower highs along a downward-sloping trendline, while finding consistent support near the $140-145 zone. This pattern now approaches its apex, forcing an imminent resolution.
The most striking aspect is the breakout projection indicated by directional arrows, suggesting a potential downside target near the $102-103 area should the triangle break lower.
The falling wedge (bullish, daily chart) and descending triangle (bearish, weekly chart) reflect conflicting indications. A break above $170 validates the wedge’s upside, while breaking below $140 confirms the triangle’s $102 target.
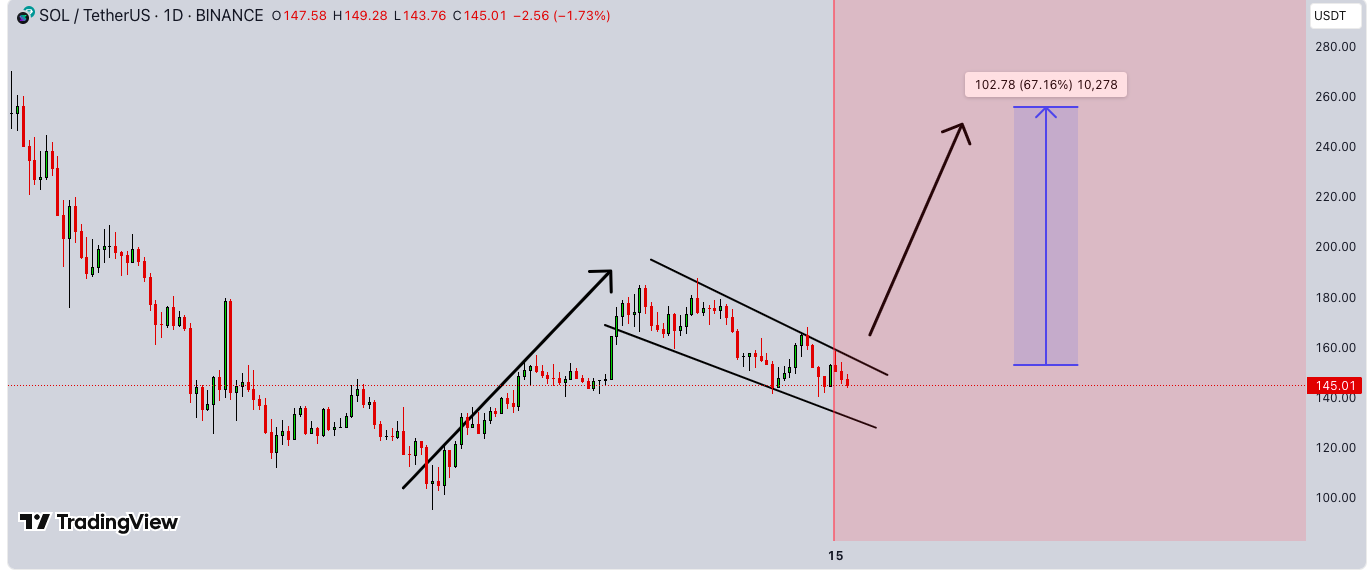
This scenario represents a 30% decline from current levels, matching the triangle’s measured move calculation.
Should the $140-145 support level fail, accelerated selling pressure could drive prices toward the projected target of around $102.
Conversely, any bullish reversal would require $SOL to break above the descending trendline resistance in the $160-170 area with substantial volume, which would negate the bearish triangle formation.
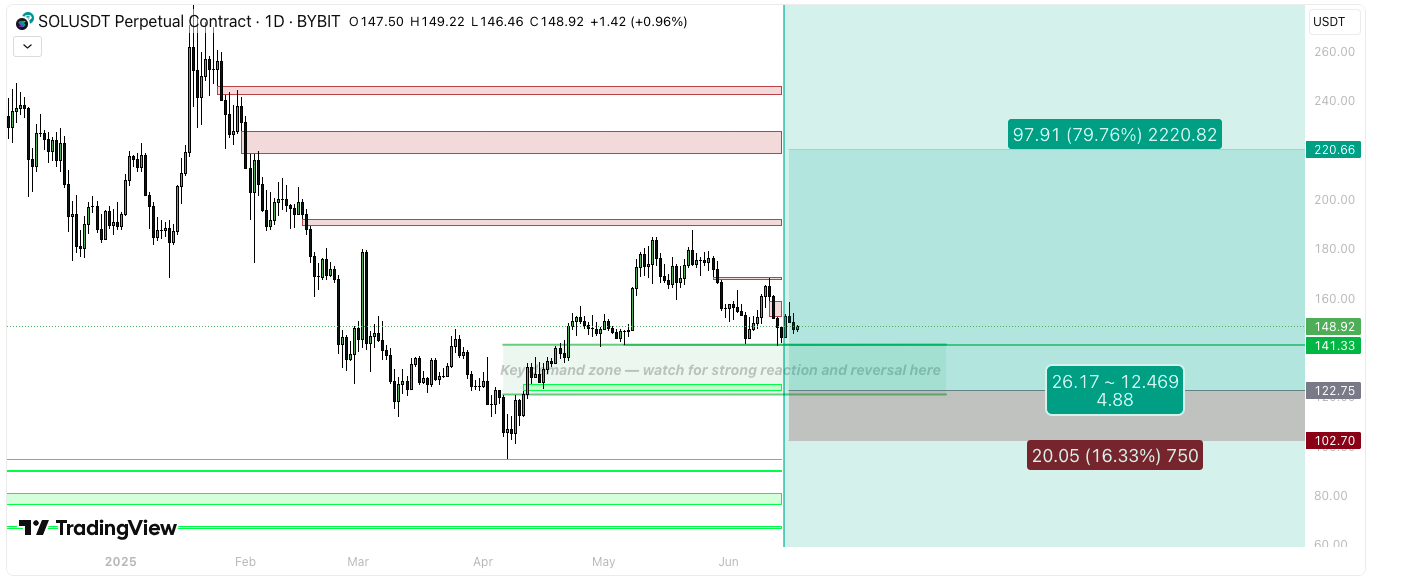
The highlighted zone appears to indicate the potential breakout area and price target, with resistance levels situated in the $180-$ 220 range, based on historical price structure.
- Elon Musk Grok AI Predicts Shocking XRP Price in The Next 28 Days
- This ChatGPT AI XRP Price Prediction Should Not Make Sense But It Does
- Elon Musk Accepts Dogecoin for SpaceX Payments as DOGE Stalls Ahead of Historic IPO
- Nobody Wants To Admit Google Gemini AI Might Be Right About XRP Price Prediction
- XRP News: David Schwartz Just Said XRP Is Becoming a Settlement Layer for Stocks and Loans, Is the Infrastructure Actually Ready?

2M+
250+
8
70


- Elon Musk Grok AI Predicts Shocking XRP Price in The Next 28 Days
- This ChatGPT AI XRP Price Prediction Should Not Make Sense But It Does
- Elon Musk Accepts Dogecoin for SpaceX Payments as DOGE Stalls Ahead of Historic IPO
- Nobody Wants To Admit Google Gemini AI Might Be Right About XRP Price Prediction
- XRP News: David Schwartz Just Said XRP Is Becoming a Settlement Layer for Stocks and Loans, Is the Infrastructure Actually Ready?
More Articles