How Bitcoin and Crypto Prices Will React to FOMC Minutes, CPI Inflation – is the Market Bottom Near?


Bitcoin, and crypto prices more generally, have been treading water this week, but that could change from today as producer price index (PPI) inflation data and FOMC minutes are released.
First up to disturb the market from its slumber is the US PPI data, a measure of inflation at the factory gate.
Any sign of cooling will be treated as confirmation of the need for the Fed to ease off on interest rate rises. Such an outcome would light a fire under stocks and crypto prices.
Conversely, if producer price inflation continues to heat up, then expect risk assets to resume their sell-off.
PPI inflation comes in lower than August reading
Well the data is in and Core PPI month-on-month rose at double the level expected, by 0.4% as opposed to the 0.2% forecast.
Meanwhile, year-on-year headline PPI was 8.5%, hotter than the 8.4% forecast, although that is down from 8.7% in the previous month (August) – and that last point seems, initially, to be the key takeaway for the market.
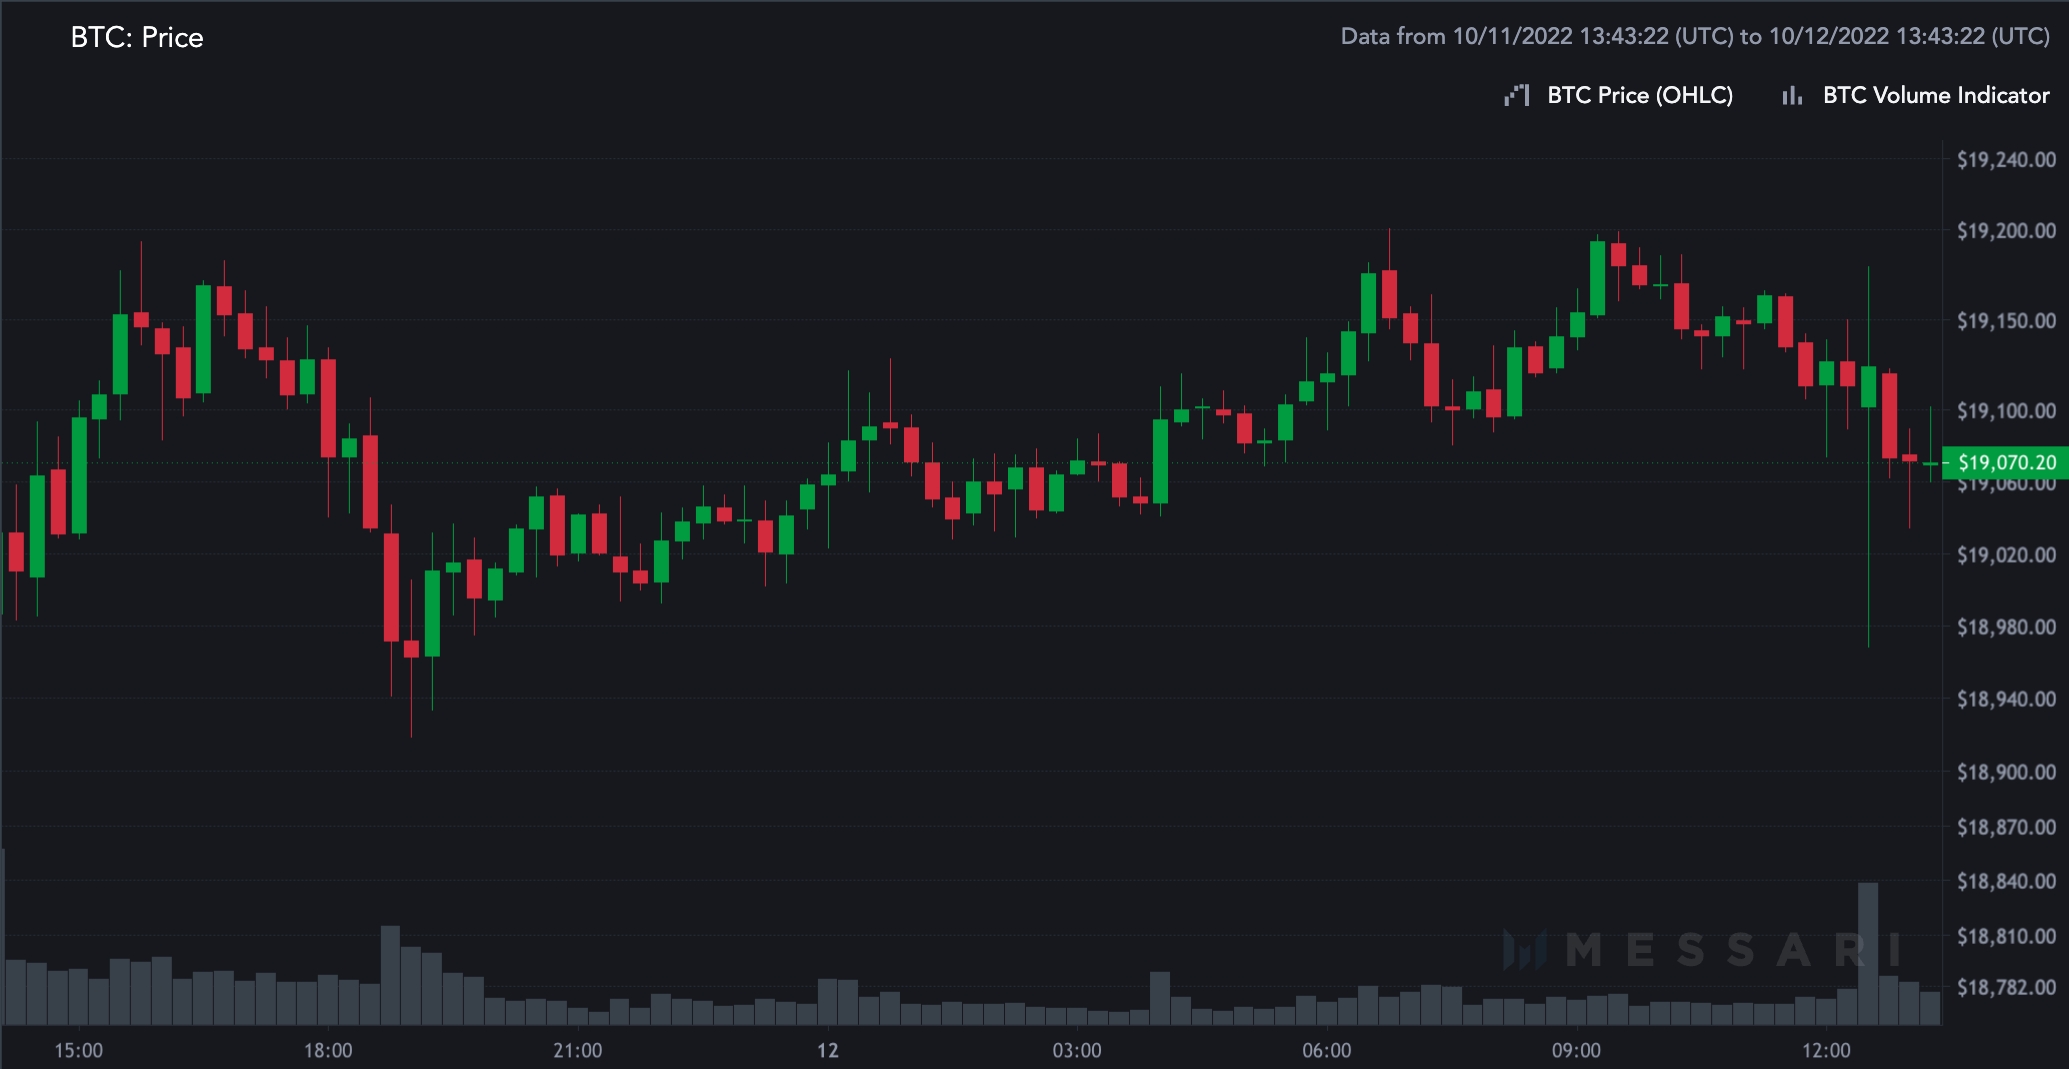
As such, reaction so far is fairly positive – Bitcoin remains largely unchanged, but could move higher if equities can pick up some positive momentum.
The S&P 500 is up 0.2% to 3595, the Dow 61 points higher and the Nasdaq 0.38% the better at 10468.
Elsewhere, the UK 30-year government bond sell-off has picked up, with yields accelerating upwards 23 basis points to 5.00% (more on the UK financial crisis below)
But the PPI data is the warm-up act for the main show, which is the US consumer price index (CPI) inflation data release on Thursday.
FOMC minutes could stir up the crypto market
However, even before those hotly anticipated numbers are released, market participants will be provided with plenty to ruminate over when the Federal Open Market Committee (FOMC) releases the minutes from its 21 September meeting at 18:00 UTC.
The minutes will likely show that there is a firming consensus around the need for a 75 basis points rates hike in November.
Fed watchers will be looking for any changes of language that could be interpreted as either a hardening of hawkishness or a willingness to pivot away from such a trajectory, should incoming data indicate that inflation might be starting to weaken.
An area of possible disagreement though, or at least a lack of alignment, will be over the terminal rate – in other words the rate which will mark the peak of the hike cycle.
According to Refinitiv data, the consensus forecast for the terminal rate now stands at 4.45%, way-off the earlier projections made in August that targeted 3.7%. The date for the terminal rate is assumed to be the 22 March 2023.
Any hints at the terminal rate coming later than expected and at a higher level will prompt selling in both the stock and crypto markets.
Some economists think the terminal rate will be nearer 5%. Either way, the FOMC minutes could throw some light on the thinking of its members.
Bitcoin price is holding value better than UK government inflation-linked bonds right now
Perhaps the most striking observation to be made on market conditions in crypto over the past few weeks, has been the relatively stability, especially when appraised alongside that of other asset classes.
Take UK government bonds for example, where the trauma in those markets continues, perhaps coming to ahead on Friday when the Bank of England says – although the signals are confusing the market – that it will end its bond purchase at the long end of the curve (30-year bond maturities).
Take a look at this chart from a recent Financial Times story:
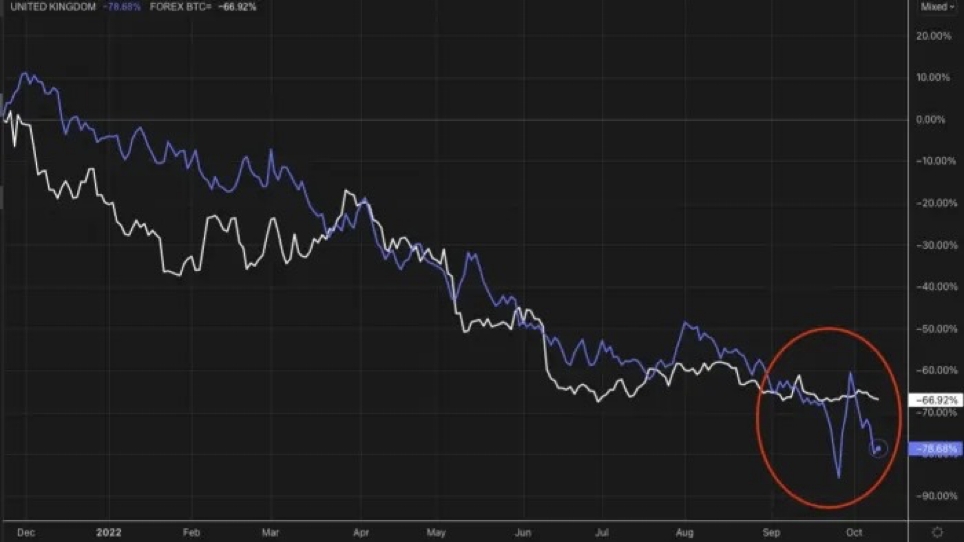
The chart shows the bitcoin price is down 67% since November 2021 but the UK inflation-linked maturing in 2073 is down nearly 80%.
That is an amazing juxtaposition. It underlines how a maturing bitcoin market actually competes well in the volatility stakes up against previously solid asset class instruments such as UK inflation-linked government bonds, or ‘linkers’ as they are known.
Bitcoin price volatility may spike soon, but overall volatility is on a declining trend
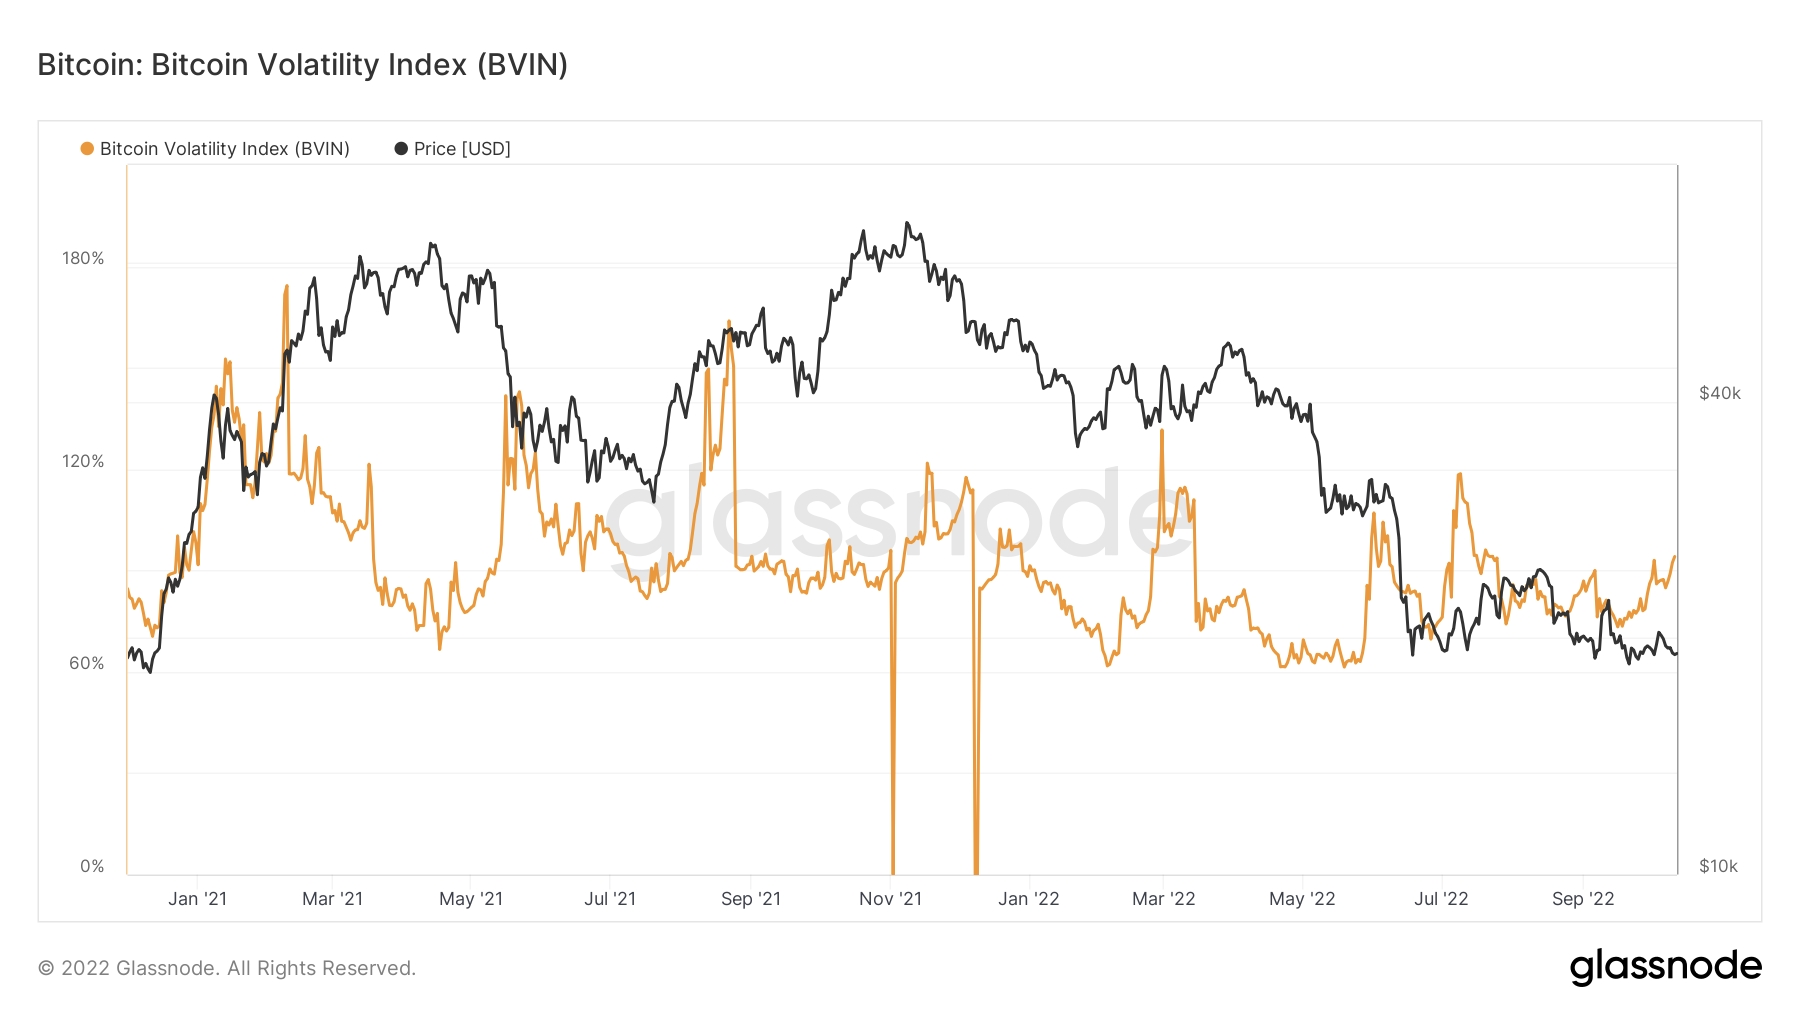
Our second point to consider is the weakening volatility of the bitcoin price.
This of course matters because volatility is another way of expressing risk – and it is becoming less risky to hold bitcoin.
We can see this in the descending peaks of the Bitcoin Volatility Index illustrated by the orange line on the chart below (the two down spikes are explained by missing data):
How will the FOMC minutes and inflation data play into the bitcoin’s ongoing bottom formation?
And what we all want to know is how might the news from the economic statisticians and the Fed feed into the calculations as to whether the bitcoin price is near its bottom?
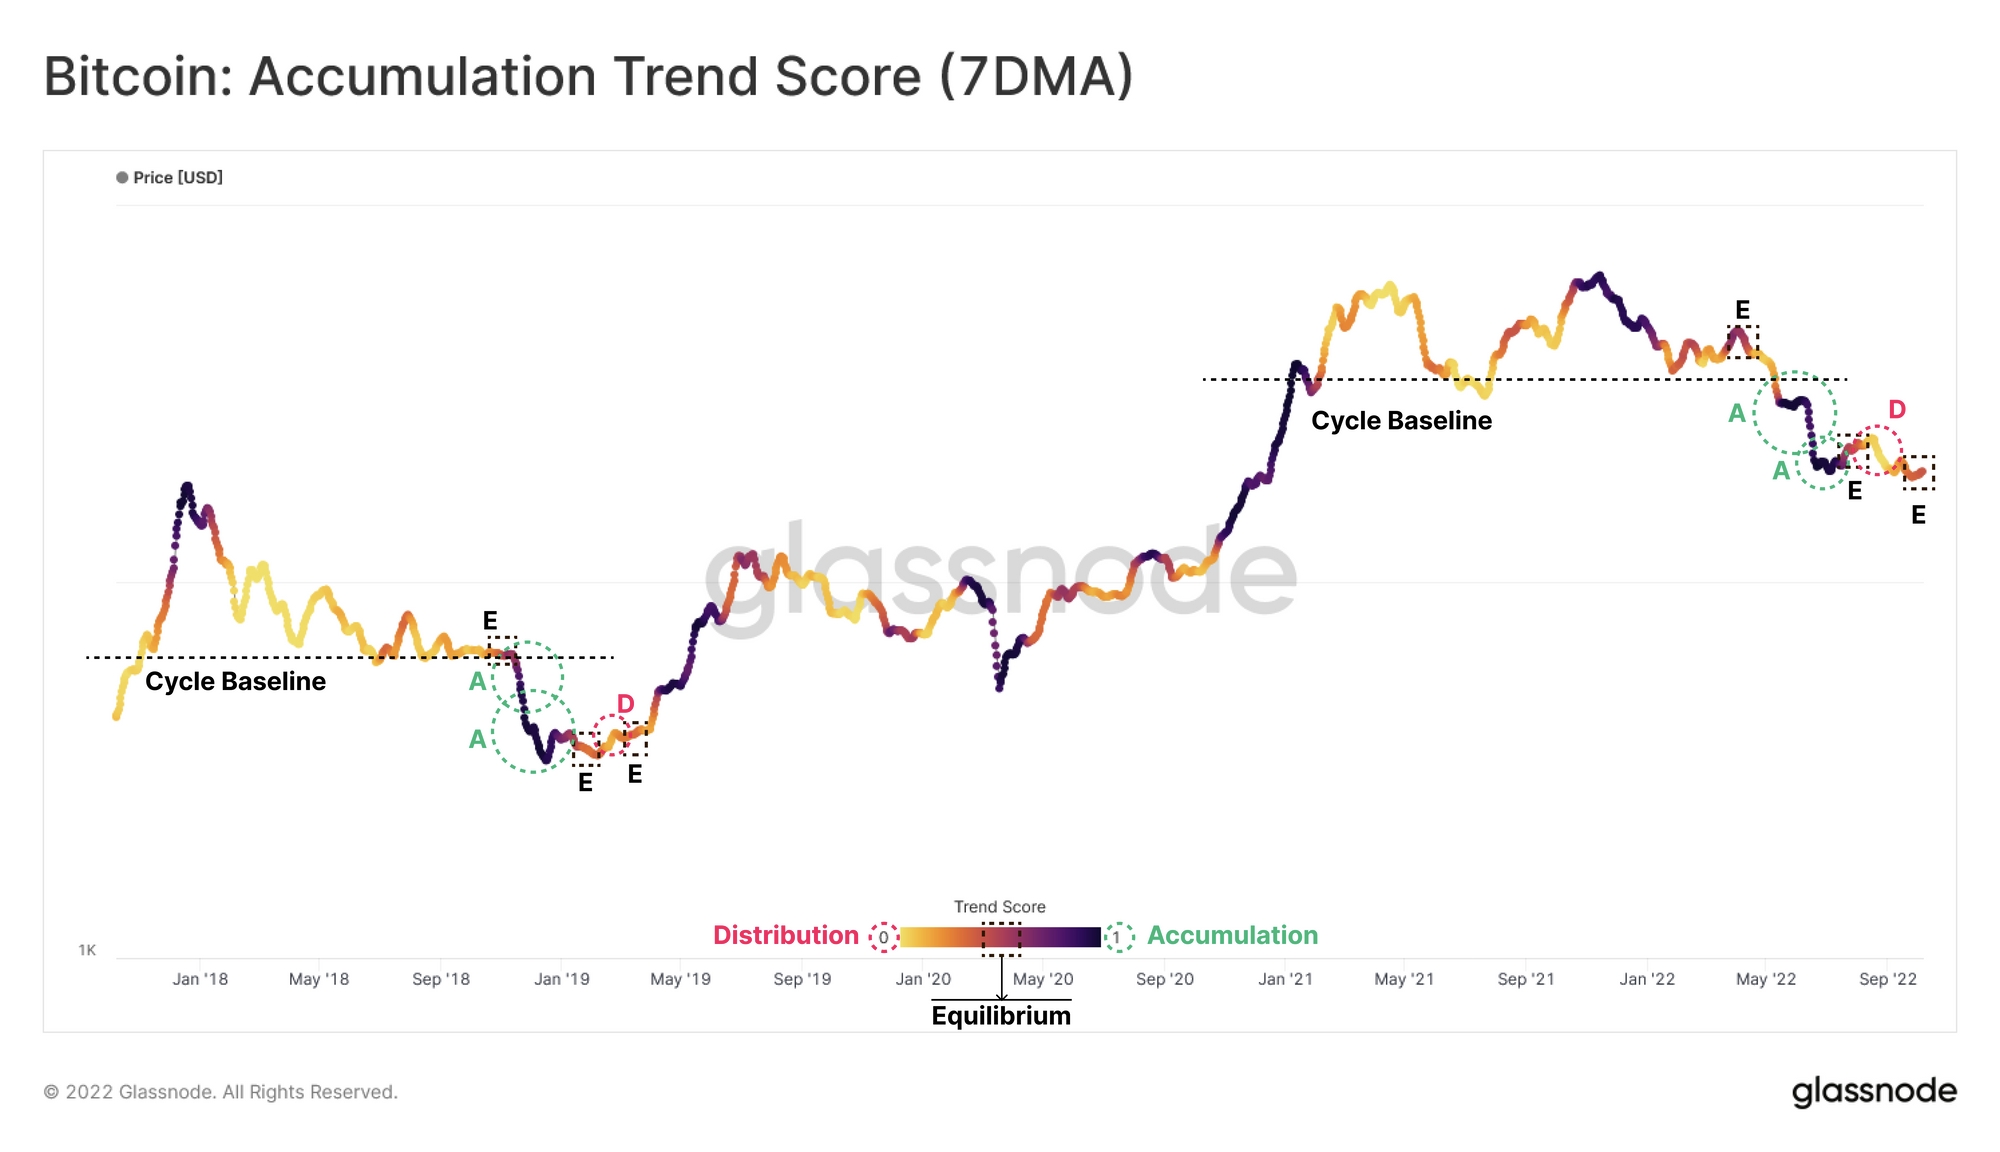
On that, the bitcoin accumulation trend score might help to clarify matters.
It is a relatively new (March 2022) Glassnode metric and here is a helpful definition:
The Accumulation Trend Score is an indicator that reflects the relative size of entities that are actively accumulating coins on-chain in terms of their BTC holdings. The scale of the Accumulation Trend Score represents both the size of the entities balance (their participation score), and the amount of new coins they have acquired/sold over the last month (their balance change score). An Accumulation Trend Score of closer to 1 indicates that on aggregate, larger entities (or a big part of the network) are accumulating, and a value closer to 0 indicates they are distributing or not accumulating. This provides insight into the balance size of market participants, and their accumulation behavior over the last month.
If you want to get a bit deeper into the metric, watch this video:
What is notable about the chart is the possible repeat today in the bottom formation pattern seen at the end of 2018 and first quarter of 2019.
Here’s the annotated Glassnode chart:
Glassnode highlights, among other things, how “the Accumulation Trend Score for whales holding 1k-10k BTC highlights aggressive accumulation since late September”:
In our current market structure, and noting an approximate 10x in BTC prices, we can see very similar behavior occurring in large entities, however driven more so by the 100-1k BTC cohort during the August rally.
In addition to the relative neutrality across small to medium-address cohorts, the Accumulation Trend Score for whales holding 1k-10k BTC highlights aggressive accumulation since late September. Whales owning >10K BTC are biased towards weak distribution over recent months.
A closer look at the two periods is shown below:
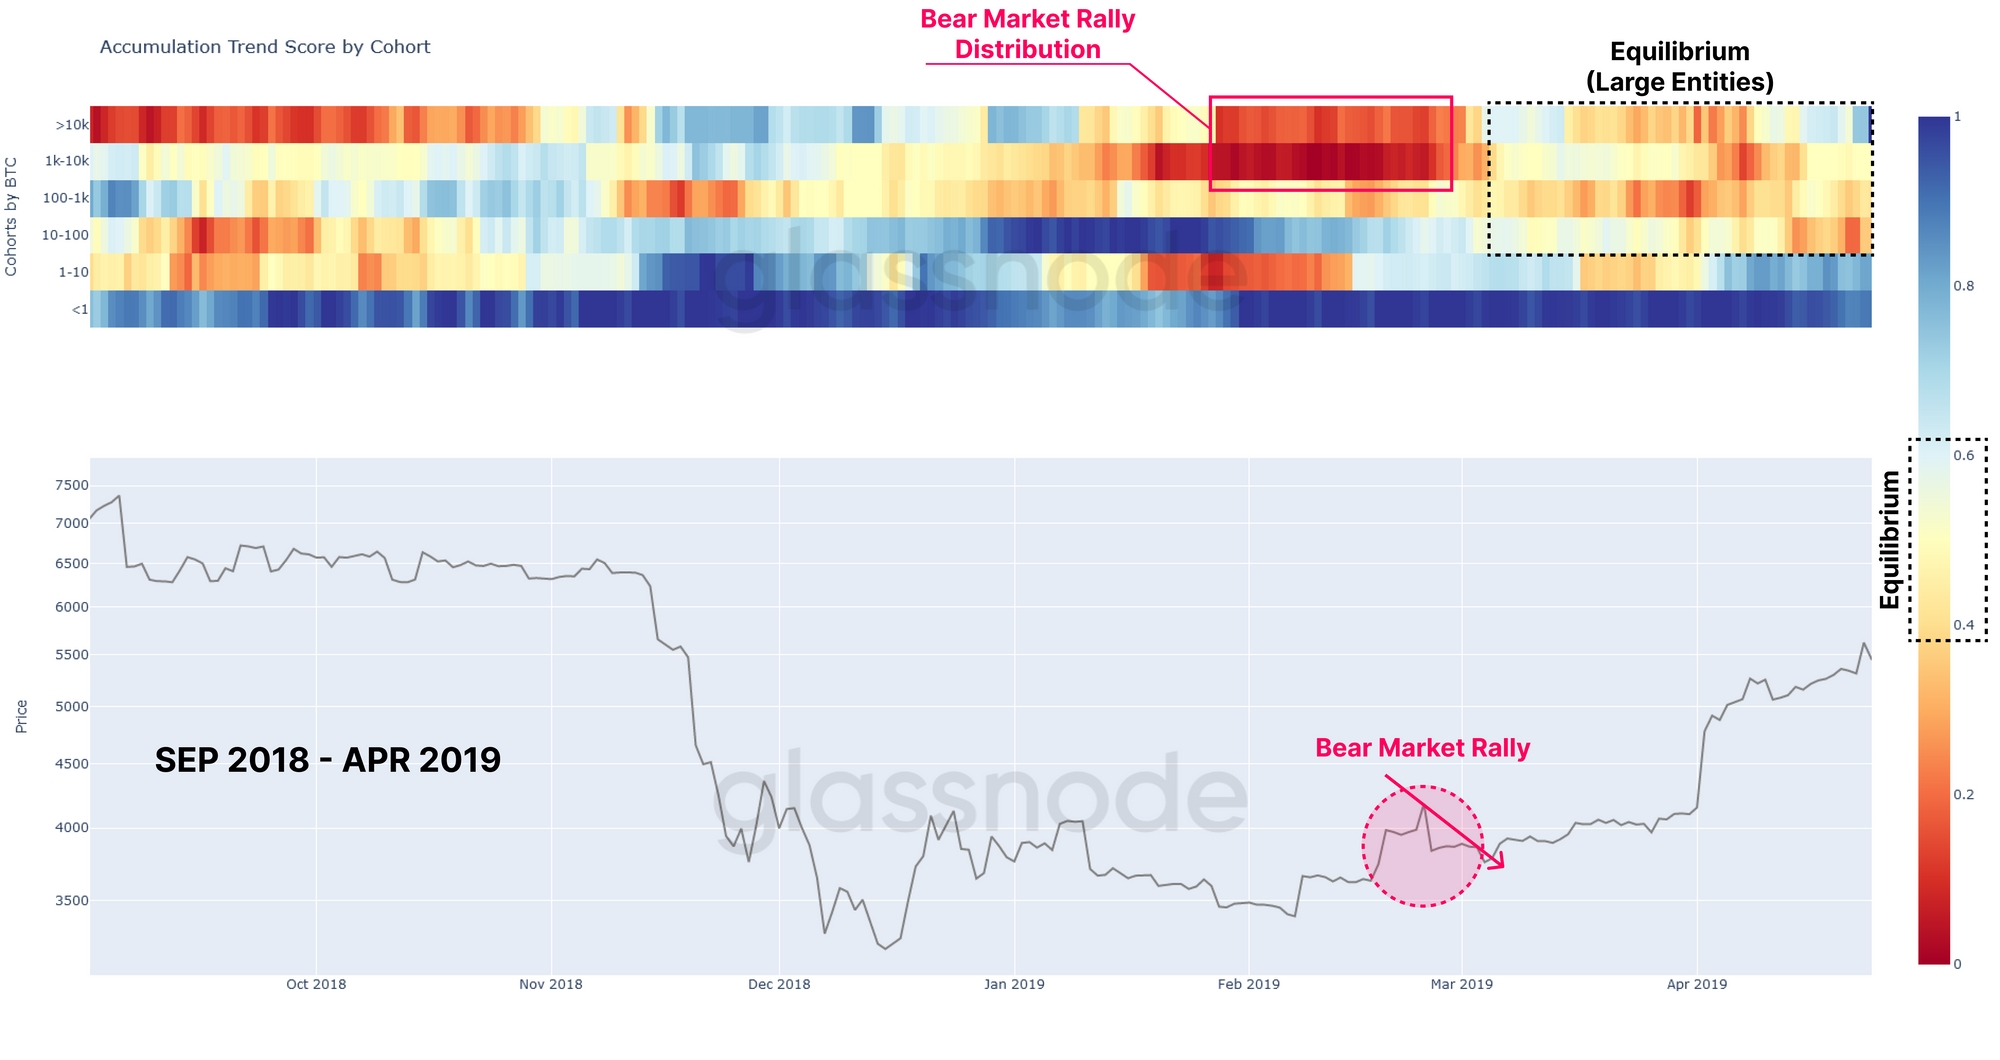
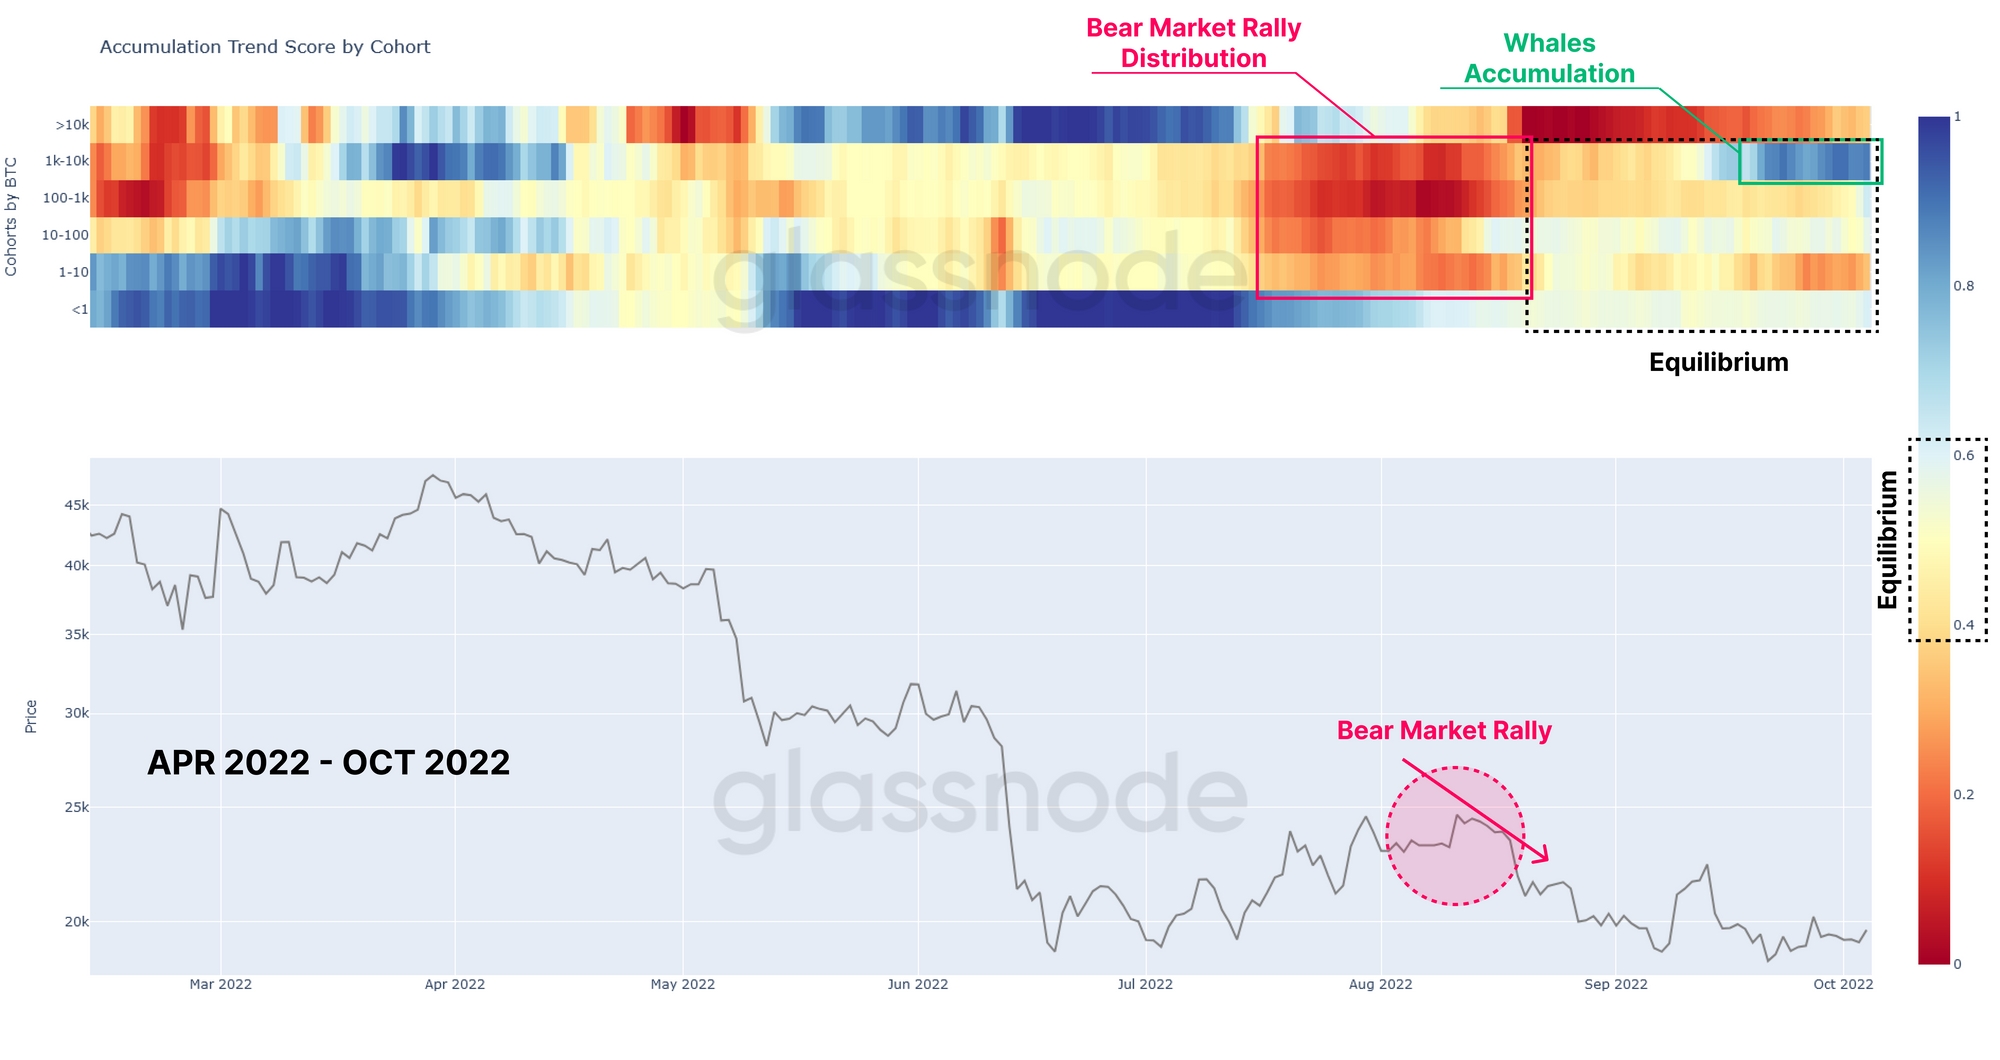
If the apparent fractal is the right interpretation, then whatever happens in terms of near-term volatility, bitcoin is in a good place.
Cost-averaging into the market under the $20k level could be a relatively good entry point, especially if you are buying the BTC/GBP pair.
Portfolio diversification – go green
And it you fancy fishing among some of the up and coming altcoins, a good diversifier if you already hold bitcoin might be a green eco-friendly crypto such as IMPT, which is currently on presale.
It is worth a mention because it is the only coin out there that is targeting shoppers by enabling them to offset their carbon footprint.
The presale allocation is selling at an impressive clip, with $3 million worth of tokens snapped up in a week, but do your own research.
- Microsoft Copilot AI Predicts Insane XRP Price by End Of 2026
- Mark Zuckerberg Meta AI Predicts Gold and Silver Price Will Skyrocket by End of 2026
- Elon Musk Grok AI Predicts XRP Will Explode by End of 2026
- Google Gemini AI Predicts Shocking Bitcoin Price by End of 2026
- Sam Altman ChatGPT AI Predicts Insane SpaceX Stock Price by End of 2026
2M+
250+
8
70


- Microsoft Copilot AI Predicts Insane XRP Price by End Of 2026
- Mark Zuckerberg Meta AI Predicts Gold and Silver Price Will Skyrocket by End of 2026
- Elon Musk Grok AI Predicts XRP Will Explode by End of 2026
- Google Gemini AI Predicts Shocking Bitcoin Price by End of 2026
- Sam Altman ChatGPT AI Predicts Insane SpaceX Stock Price by End of 2026
More Articles

