EIP-1559 Three Weeks Later: ETH 100,000 Burned, Supply Grows


Just over 100,000 ethereum (ETH) has been burned as a result of the networks latest London upgrade three weeks ago. Still, the total supply of ETH appears to be growing, although increasingly more coins are being locked up for the Ethereum 2.0 launch, setting up conditions for a potential supply squeeze, claim some experts.

On August 5, the much-anticipated London upgrade went live, that aimed, among other major points, to revamp the network’s monetary system via Ethereum Improvement Proposal 1559 (EIP-1559).
Deemed to be “the most complex change done on Ethereum mainnet to date,” the upgrade has a number of goals, the crux of which was to introduce a fee burning mechanism to offset ETH inflation, improve fee estimation, and bring about a base fee and more reliable transaction inclusion.
Contrary to some popular misconceptions, the upgrade was not supposed to lower the gas prices in the long run, and didn’t make ETH deflationary by default.
3 Weeks Post-EIP-1559 Implementation
As of today, London ready clients comprise 98.1% of the Ethereum network, while only 1.9% of the nodes are yet to upgrade their clients, according to ethernodes.org.
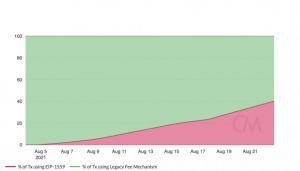
According to the latest report by on-chain analytics firm CoinMetrics, the percentage of ETH transactions using the new EIP-1559 fee mechanism is steadily increasing. Over 40% of the transactions were EIP-1559 compliant as of August 22, and the number is expected to climb upwards as wallet developers continue to implement the new format.
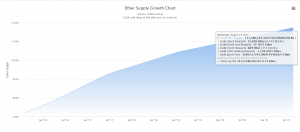
According to WatchTheBurn.com, the total amount of burned ETH in transaction fees has surpassed ETH 100,000 today (c. USD 312.63m). However, the total ETH issued for the rewards was over ETH 283,920 (c. USD 887.6m), meaning that EIP-1559 helped to offset the inflation by 35.37%, calculates the website.
As such, the total supply of ETH has continued to increase, and is currently (UTC 13:20) reaching a bit more than ETH 117,386,167 (USD 366.98bn) – a net growth slightly more than ETH 183,453 since August 5, according to Etherscan and WatchTheBurn.
This is equivalent to ETH 4.9 (c. USD 15,318) issued per minute, as displayed by another fee burn watch site etherchain.org.
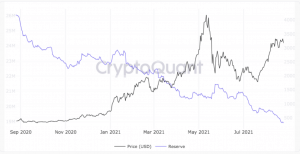
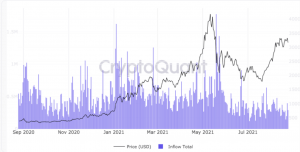
Still, it does not mean that Ethereum is not in for a supply squeeze. According to blockchain analytics firm CryptoQuant,
ETH supply “is melting like an athlete running a marathon on a hot summer day.”
This is due to the ongoing ETH fee burn and ETH 2.0 staking – according to the firm’s stats, over 6% of the total ether supply is currently locked in the ETH 2.0 deposit contract.
Per beaconcha.in, there are ETH 6.99m (USD 21.85bn) currently staked, and 218,278 active validators.
In addition, ETH reserves on centralized exchanges have been dropping, too, as they reached ETH 18.98m (USD 59.4bn), and there seems to be a declining trend of new ETH deposits, states the firm’s analyst TheBullduck.
__
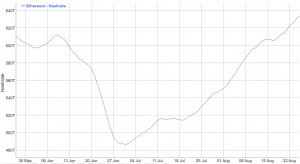
Climbing hashrate and persistent fees
At EIP-1559 launch, some experts were also noting that that the upgrade’s effects may be visible in the network’s hashrate.
In the last three weeks, the hashrate has continued to climb upwards, according to BitInfoCharts, reaching 634.5 Thash/s on August 25 – up 30.5% since its lowest point prior to this increase, seen at the start of July.
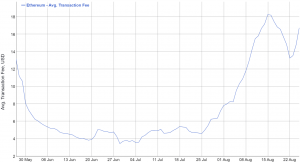
As noted by a number of analysts, EIP-1559 upgrade did not – nor was it supposed to – lower Ethereum fees. As reported last week, ETH fees have hit the highest level since May 2021 thanks to the ongoing non-fungible token (NFT) craze which tends to clog up the network.
According to BitInfoCharts, the average Ethereum transaction fee was USD 16.74 on August 25 (7-day simple moving average), up by 114.3% since the beginning of the month when it reached USD 7.81.
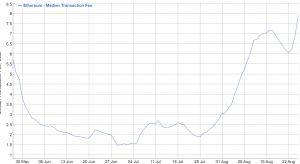
Median transaction fee is up as well, from USD 3.03 on August 1 to USD 7.93 13.31 today – a notable 161.6% increase.
At the time of writing, ETH is trading at USD 3,126. It’s down nearly 2% in a day and up nearly 3% in a week. Overall, it appreciated 40% over the past 30 days, and 21% since August 5 when EIP-1559 was launched.
____
Learn more:
– Ethereum Burning Thousands of USD a Minute, While Miners Face the Change
– Ethereum Arrives to London, Burning Begins, Price Jumps
– Full List of Ethereum London Upgrade Changes
– Ethereum’s Hope No. 1559: What It Does and What It Doesn’t Do
– Ethereum’s EIP-1559 ‘Doesn’t Deliver’ As It’s ‘Not Meant to Reduce Fees’
– ‘Ethereum Fees Highest Since May as NFT Craze Continues
– Ethereum Miners Can Transition to These Coins and Boost Their Values
– MEV Harms Ethereum Users And it May Be Here For Some Time
- XRP Price Prediction: Judge in XRP Ruling Delivers Fresh Blow
- Ethereum Price Prediction: Tom Lee Predicts $5 Trillion Ethereum
- Ex-SWIFT CIO Tom Zschach Shuts Down XRP Partnership Claims in Two Words
- Sam Altman ChatGPT AI Predicts Bitcoin Price Will Shock Everyone by End Of 2026
- Crypto News, July 9: Iran Market Fears Fade as Bitcoin and Ethereum Price Shrug Off Another Panic
2M+
250+
8
70


- XRP Price Prediction: Judge in XRP Ruling Delivers Fresh Blow
- Ethereum Price Prediction: Tom Lee Predicts $5 Trillion Ethereum
- Ex-SWIFT CIO Tom Zschach Shuts Down XRP Partnership Claims in Two Words
- Sam Altman ChatGPT AI Predicts Bitcoin Price Will Shock Everyone by End Of 2026
- Crypto News, July 9: Iran Market Fears Fade as Bitcoin and Ethereum Price Shrug Off Another Panic
More Articles

