Bitcoin Trading Volume During Four Market Crashes Suggest Sellers Are Giving Up


Although the price of bitcoin (BTC) is down by almost 50% from its all-time high in November, and the latest market crash undoubtedly has been felt by BTC holders, an analysis of trading volumes during recent crashes suggest fewer coins are being sold this time around than during the sharp selloff in May and November last year.
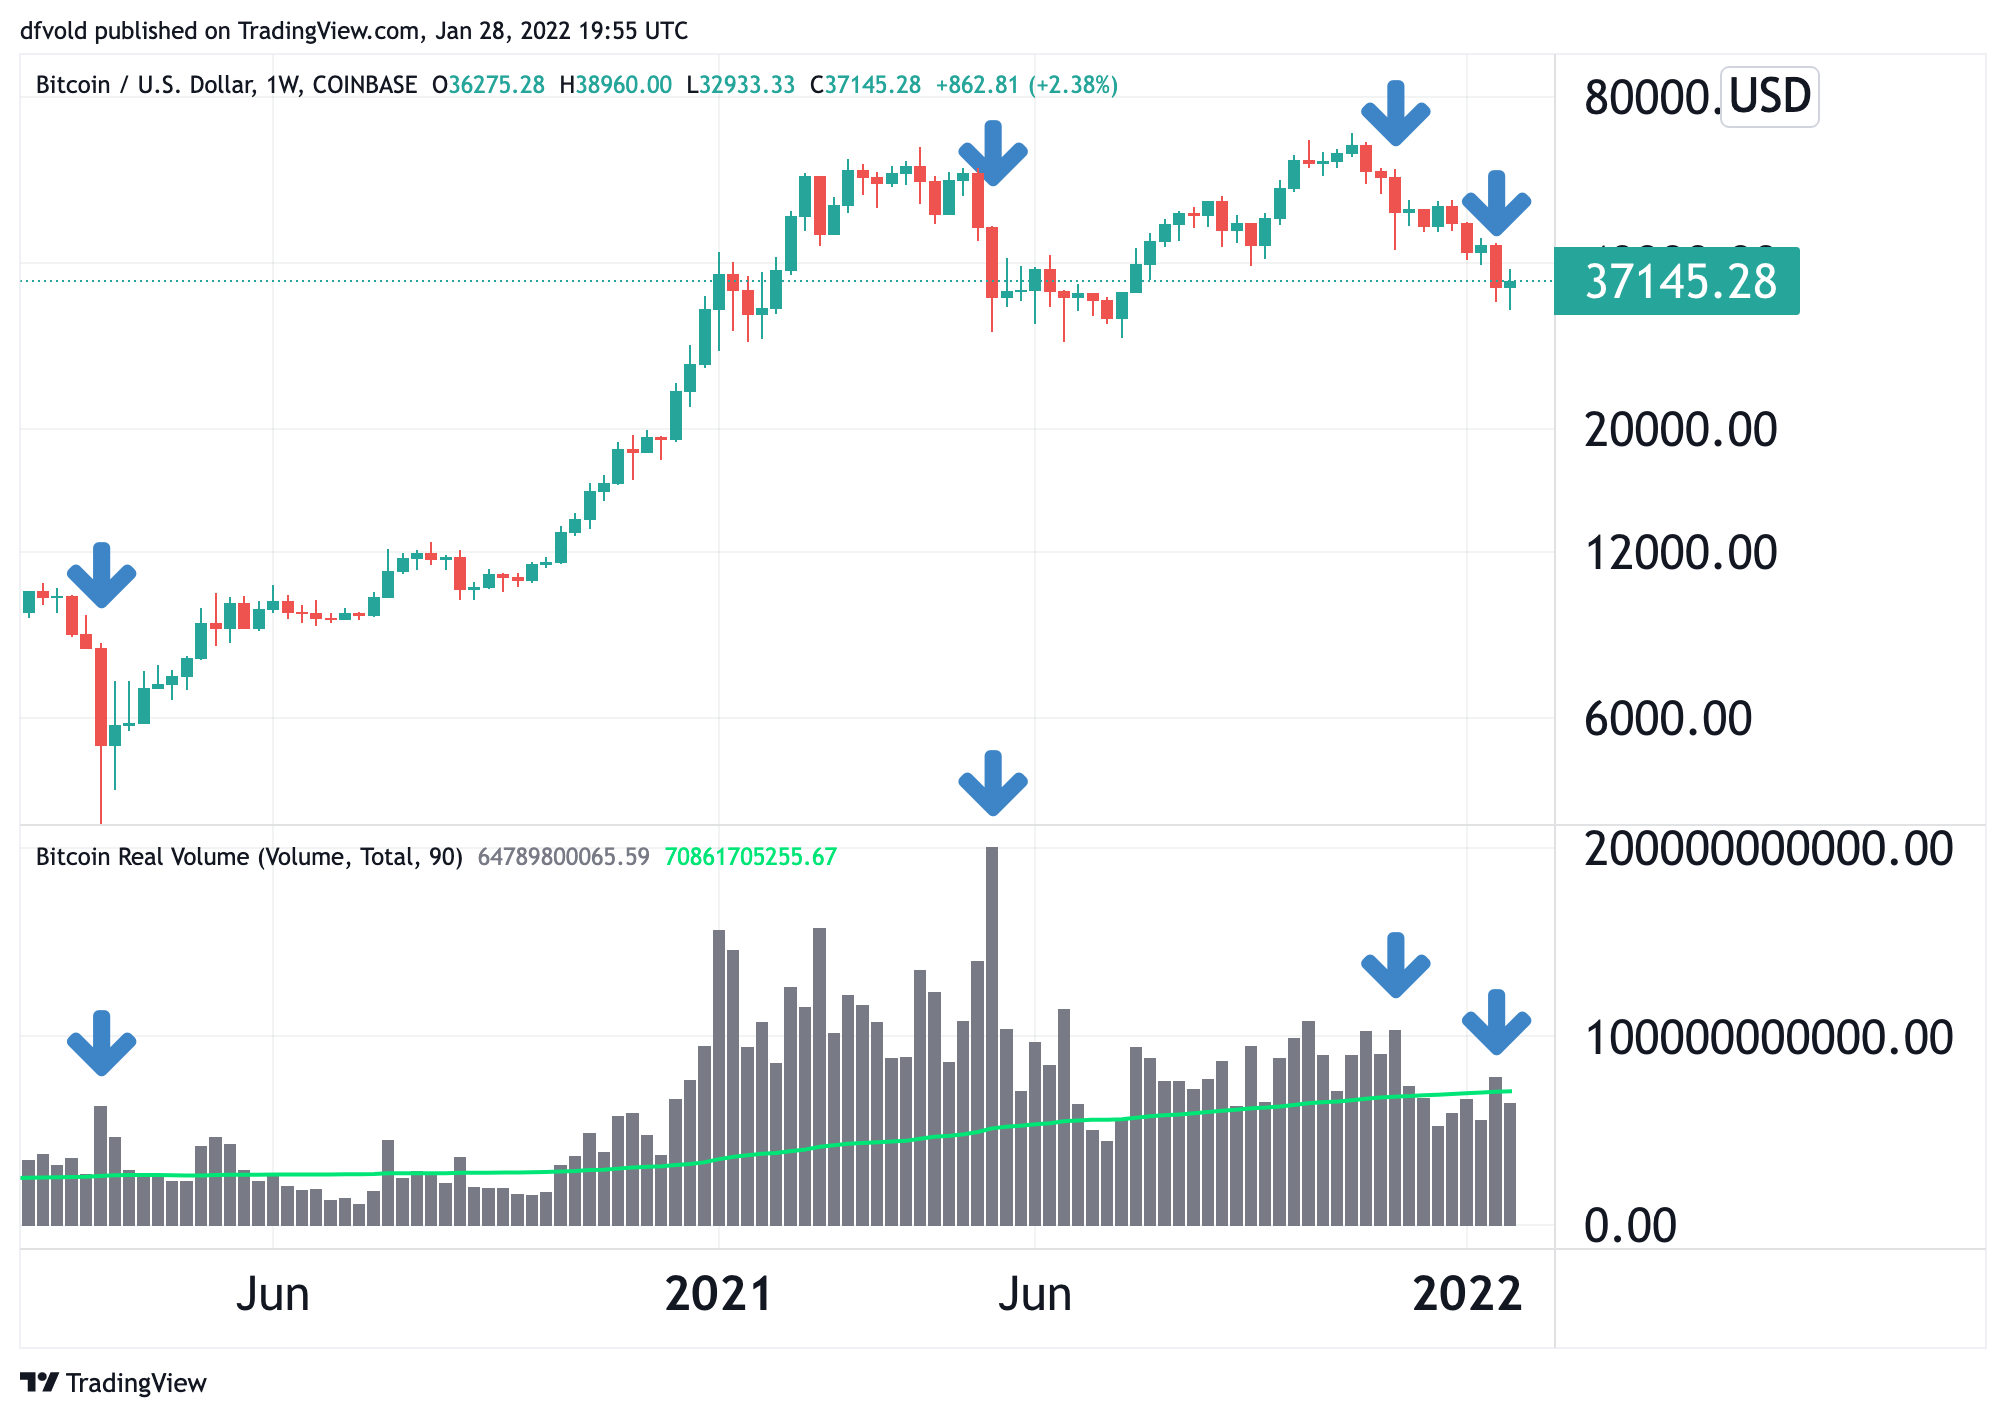
Judging from a TradingView indicator known as ‘Bitcoin Real Volume,’ only about half the USD volume was seen during the week with the most intense selling pressure in November 2021, compared to in May the same year. Meanwhile, the selling happening during the worst week for bitcoin in January this year saw even lower volumes, the data showed.
The indicator includes bitcoin trading volume against both the US dollar and a number of USD-pegged stablecoins across a handful of the largest crypto exchanges.
According to the indicator, bitcoin trading volume for the week of the market crash in March 2020 came in at USD 63.2bn, in May 2021 at USD 200.4bn, in November 2021 at USD 103.6bn, and most recently in January 2022 at just USD 78.7bn.
‘Bitcoin Real Volume’ during four market crashes:
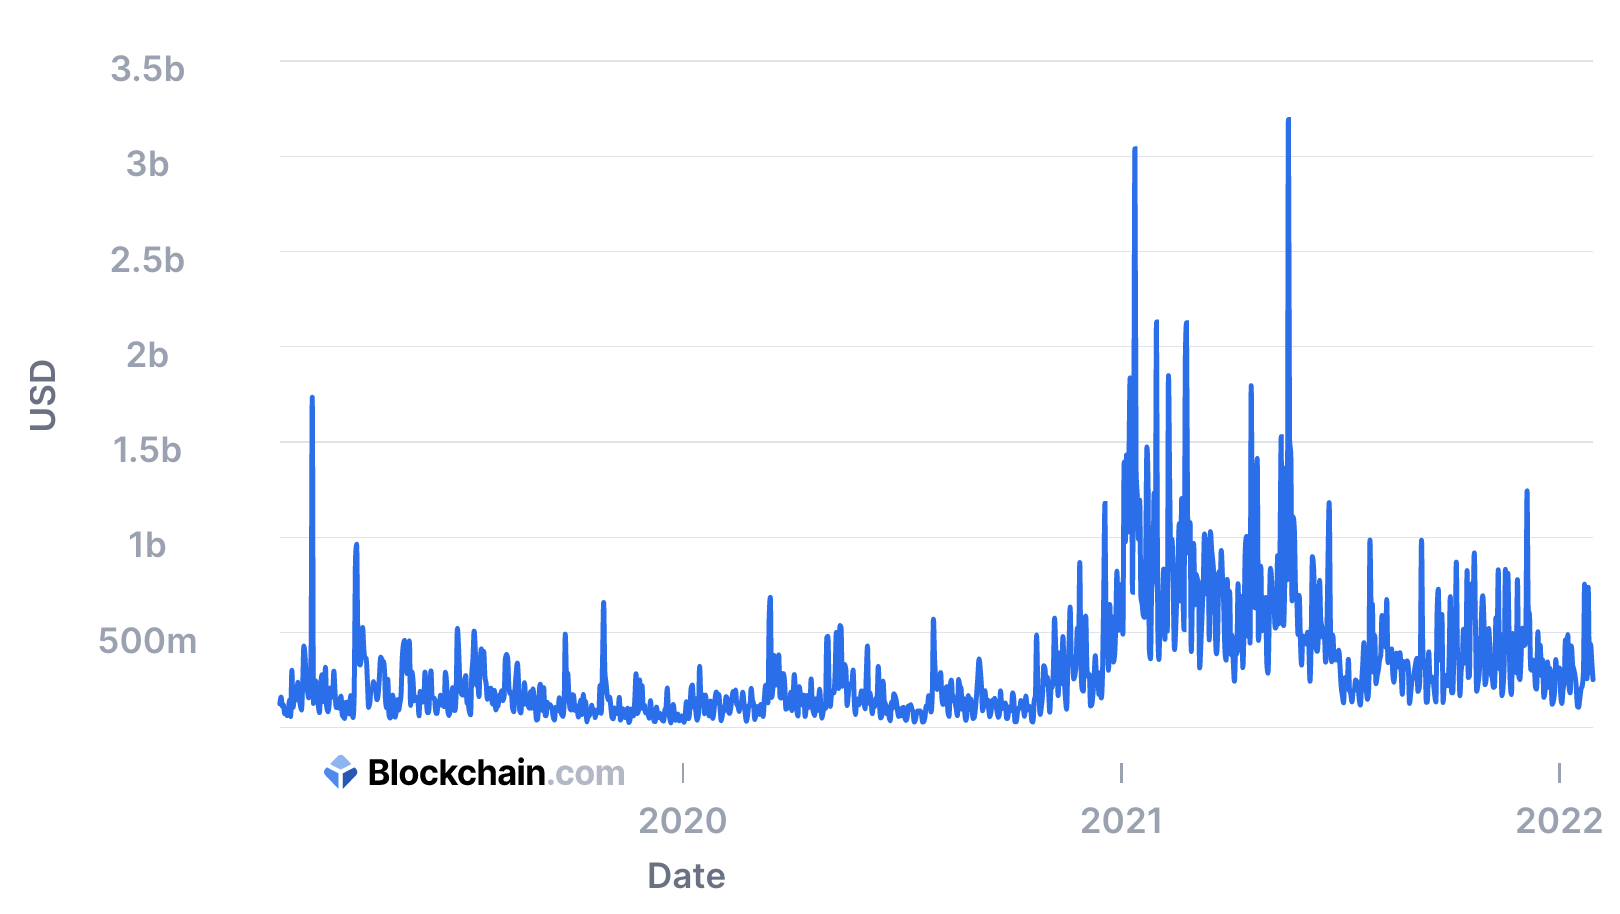
The same general trend was also reflected in Blockchain.com’s volume indicator, which tracks bitcoin trading volumes from selected exchanges. Looking at this indicator, we see volume spikes in March 2020, May 2021, November 2021, and January 2022, which all correspond to market selloffs in those months.
As with the previous indicator, Blockchain.com’s data also shows that May 2021 saw the most intense selling in terms of exchange trading volume, with the selloffs in November 2021 and January 2022 each becoming smaller than the prior crash.
Bitcoin trading volume on selected exchanges, per Blockchain.com:
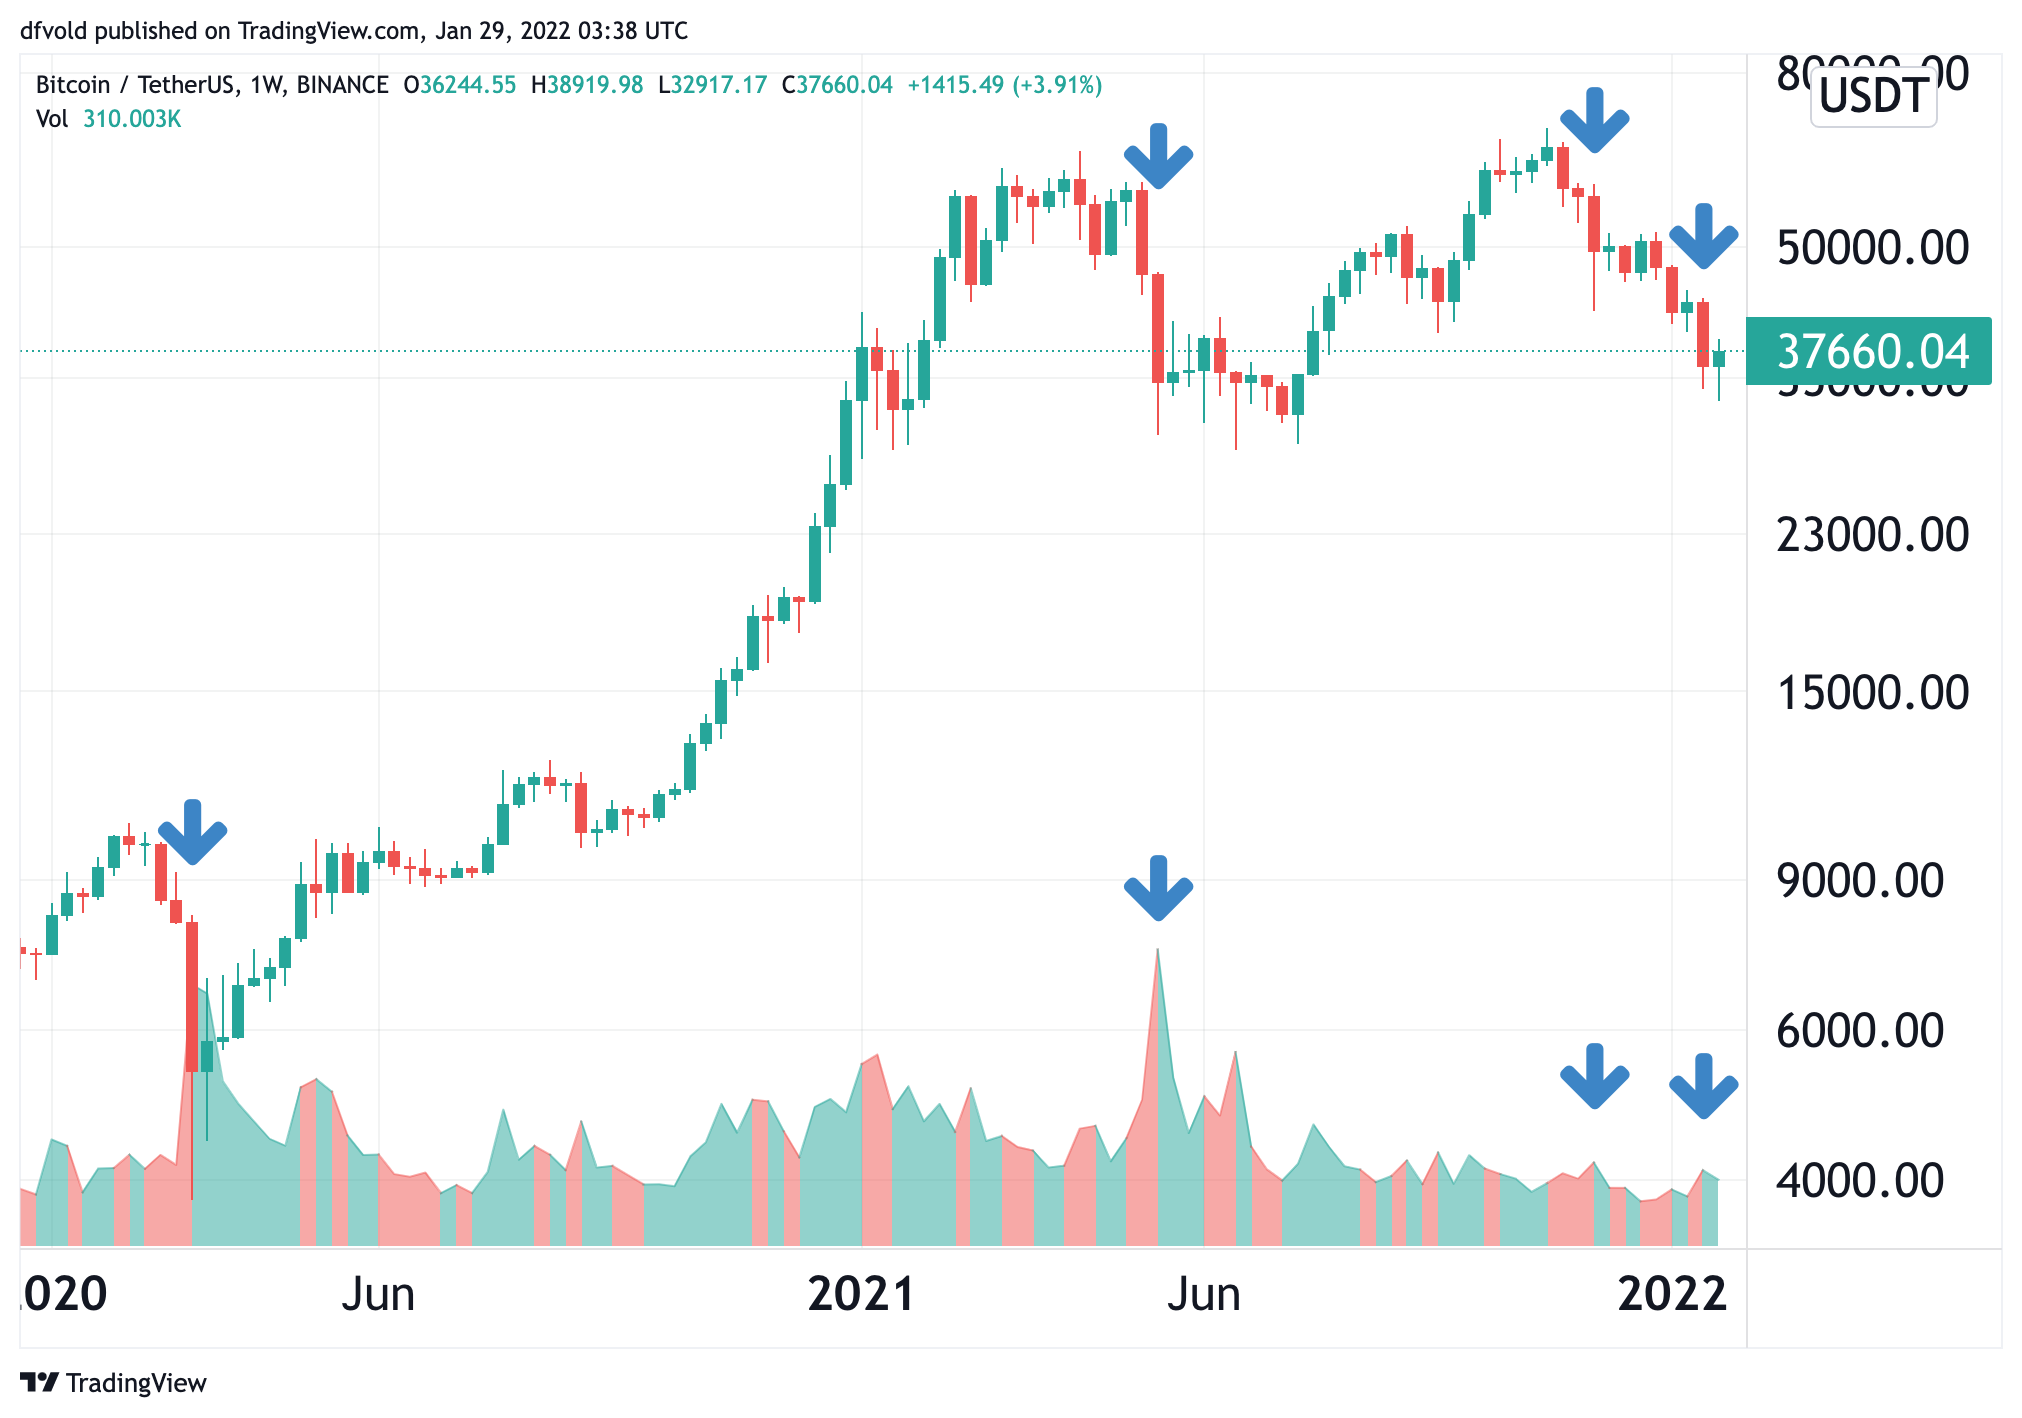
Similarly, volume data from the BTC/USDT trading pair on Binance, which is considered to be the largest crypto exchange by volume, also showed that the May 2021 selloff was the most intense by volume.
However, a notable difference with the Binance data was that the March 2020 crash came in with the second-biggest volume, followed by November 2021 and lastly January 2022.
BTC/USDT trading volume on Binance:
With the numbers showing that May 2021 holds the record across all data sources checked, it seems that less fiat currency has been cashed out for each subsequent market crash since that month. This could indicate that the weaker holders of bitcoin have already sold, with stronger holders now remaining.
The theory that weaker holders are leaving bitcoin and being replaced by stronger holders was also suggested in a report from crypto research firm Delphi Digital from earlier in January.
They said that long-term holders have used January’s lower prices as an opportunity to accumulate more bitcoin. This can be seen as part of a transfer from short-term “weak hands” to long-term “strong hands,” the report said.
With bitcoin’s volatile nature, however, it is anyone’s guess when the tide will once again turn in favor of the bulls. But with less selling taking place for each mini-crash in the coin, the time for a bottom forming in the market may be getting closer.
At 13:11 UTC, BTC was trading at around USD 37,000 and was down 20% in a month, trimming its annual gains to 8%.
____
Learn more:
– Bitcoin to Hit USD 93K This Year, According to Less Optimistic Survey
– USD 100K per Bitcoin ‘Hopium’ Now Moved to Mid-2022
– This is What’s Backing Ark’s Big Bitcoin, Ethereum and Web 3 Forecasts
– How Global Economy Might Affect Bitcoin, Ethereum, and Crypto in 2022
– Two Main Macro Scenarios in Play for Bitcoin & Crypto in 2022 – CryptoCompare
– Bitcoin in an Interest Rate Rising Environment
– Goldman Sachs Claims Adoption Won’t Boost Crypto Prices, Talks Down Stablecoin Plans
- XRP Price Prediction: Judge in XRP Ruling Delivers Fresh Blow
- Mark Zuckerberg Meta AI Predicts Gold and Silver Price Will Skyrocket by End of 2026
- Elon Musk Grok AI Predicts XRP Will Explode by End of 2026
- Sam Altman ChatGPT AI Predicts Bitcoin Price Will Shock Everyone by End Of 2026
- Ethereum Price Prediction: Tom Lee Predicts $5 Trillion Ethereum
2M+
250+
8
70


- XRP Price Prediction: Judge in XRP Ruling Delivers Fresh Blow
- Mark Zuckerberg Meta AI Predicts Gold and Silver Price Will Skyrocket by End of 2026
- Elon Musk Grok AI Predicts XRP Will Explode by End of 2026
- Sam Altman ChatGPT AI Predicts Bitcoin Price Will Shock Everyone by End Of 2026
- Ethereum Price Prediction: Tom Lee Predicts $5 Trillion Ethereum
More Articles

