Traders Flee Dollar for BTC, but Technicals Warn of Pullback to $92K: Analyst


Bitcoin’s recent volatility has left traders torn between optimism and caution, as shifting global capital flows collide with conflicting BTC technical signals pointing towards a pullback.
Key Takeaways:
- Traders are shifting from the US dollar to Bitcoin, but technical charts signal a possible pullback to $92,000.
- Bitcoin’s supply on exchanges has dropped sharply by 30%.
- Short-term indicators show mixed momentum with signs of overbought conditions.
In a recent note shared with Cryptonews.com, Sergei Gorev, Head of Risk at YouHodler, noted that “BTC quotes are currently in a state of uncertainty.”
He explained that while “many global traders are gradually withdrawing from the US currency and shifting to more risky assets, including cryptocurrencies,” which supports Bitcoin’s price, the charts are telling a different story.
BTC Flashes Volatility as Gorev Warns of Pullback
Gorev pointed to increased instability in BTC’s movements, warning that “the price on the BTC chart is behaving extremely erratically, and there is currently a possibility of a local price hike.”
However, he flagged the emergence of a “Head and Shoulders” pattern, often considered a bearish signal in technical analysis.
“When implemented in its scenario, [it] can lead to a correction in the price of BTC to the level of $92,000 per 1 BTC,” Gorev said.
Gold, meanwhile, continues to benefit from dollar weakness.
Gorev highlighted an “Inverted head and shoulders” pattern in gold’s chart, noting that “we may see new highs in gold metal prices, reaching up to $3,700 per ounce” if the setup plays out.
Last week, analysts at Bitfinex said Bitcoin could climb to $115,000 or higher by early July, with institutional demand and ETF inflows driving the rally.
“In a bullish scenario, driven by strong institutional interest and ETF inflows, Bitcoin could touch $115,000 or higher by early July 2025,” the analysts said.
Meanwhile, the available Bitcoin supply has fallen sharply, setting the stage for potential price surges as institutional demand builds, according to Sygnum Bank’s latest Monthly Investment Outlook for June 2025.
Over the past 18 months, liquid Bitcoin supply has dropped by 30%, driven by rising institutional adoption and an increase in acquisition vehicles such as exchange-traded funds (ETFs), the report stated.
In total, one million BTC have moved off exchanges during this period — typically a bullish signal, as coins are often withdrawn for long-term holding.
Bitcoin Shows Strength with Cautious Signs of Overbought Conditions
Bitcoin is currently trading around $109,510 with mixed signals across multiple timeframes.
On the 2-hour chart, BTC shows strong momentum as it nears the upper Bollinger Band ($111,308), indicating potential short-term overbought conditions.
The RSI on this timeframe is approaching the overbought zone at 69.86, just below the critical 70 level, suggesting cautious optimism but warning that a pullback or consolidation could occur soon.
The MACD histogram is positive, with the MACD line above the signal line, confirming upward momentum.
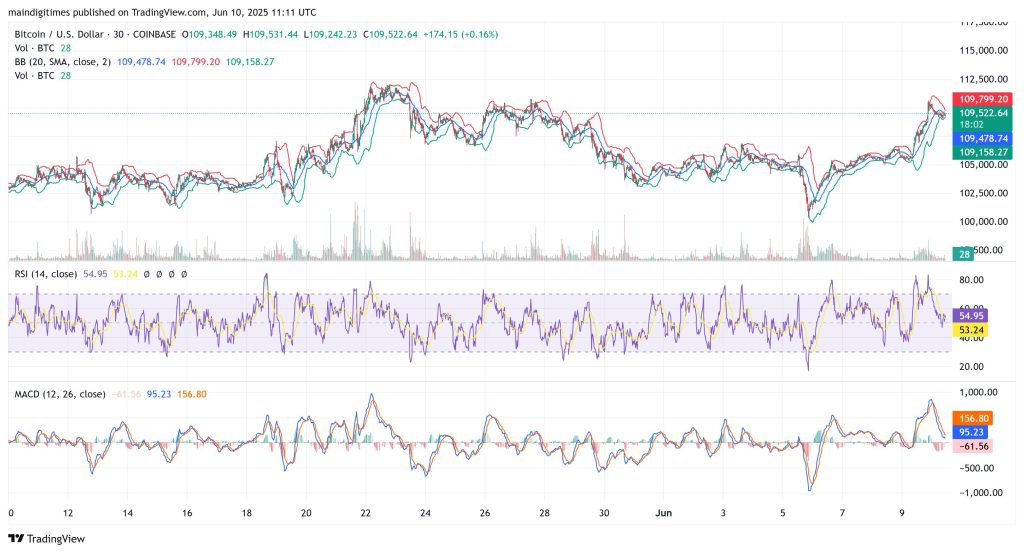
On the 30-minute chart, Bitcoin is showing signs of consolidation after a recent surge. Bollinger Bands have tightened slightly, reflecting reduced volatility, with price resting close to the middle band ($109,478).
The RSI at 54.95 shows neutral momentum, indicating a balance between buyers and sellers. The MACD on this timeframe is slightly bearish, with the signal line above the MACD line, hinting at a short-term pause or minor correction.
- Strange New Chinese AI ‘KIMI’ Predicts the Price of Bitcoin by the End of 2026
- Microsoft Leading Copilot AI Predicts Massive XRP Price by The End of June 2026
- Sam Altman ChatGPT AI Predicts XRP Price For The Next 30 Days
- Mark Zuckerberg New META AI Predicts Bitcoin Price by End of June 2026
- Senate Returns With Clarity Act: CBDC Blocked, Stablecoins Win

2M+
250+
8
70


- Strange New Chinese AI ‘KIMI’ Predicts the Price of Bitcoin by the End of 2026
- Microsoft Leading Copilot AI Predicts Massive XRP Price by The End of June 2026
- Sam Altman ChatGPT AI Predicts XRP Price For The Next 30 Days
- Mark Zuckerberg New META AI Predicts Bitcoin Price by End of June 2026
- Senate Returns With Clarity Act: CBDC Blocked, Stablecoins Win
More Articles

