
This Key On-chain Indicator Will Soon Join the List of Those Signalling a Bitcoin (BTC) Bull Market is Here


An indicator that has reliably triggered ahead of the last three major Bitcoin bulls markets looks like it is about to turn green.
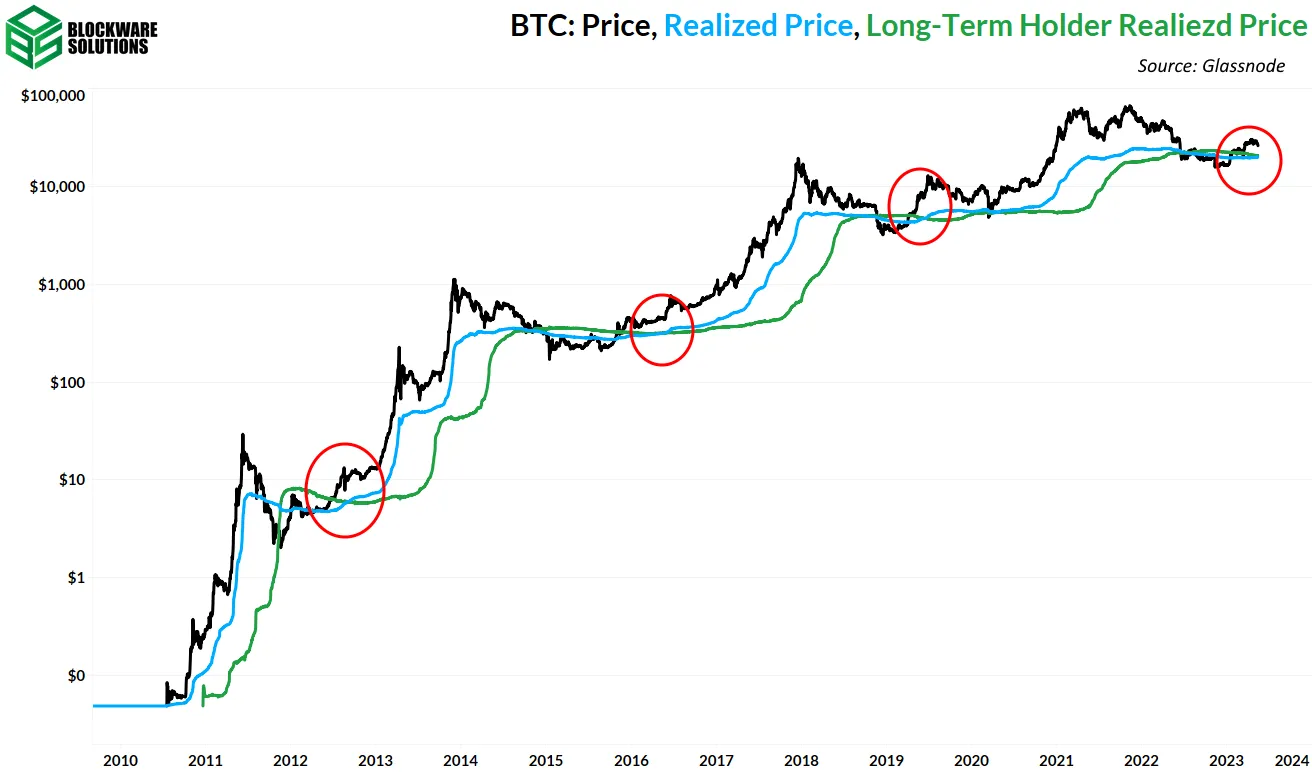
Bitcoin’s Realized Price – the average price at the time at which each coin last moved – looks like it will soon cross above the Realized Price of Long-term Holders, according to a chart presented by Blockware Solutions in their weekly newsletter citing Glassnode data.
The Realized Price of Long-term Holders is defined here as coins that haven’t moved in at least 155 days and sit outside of major centralized cryptocurrency exchanges.
The Realized Price was last just above $20,000, while the Realized Price of Long-term Holders was last just under $21,000.
Given Bitcoin’s rally into the upper-$20,000s to $30,000 area in recent months, the Realized Price is expected to keep rising.
The Realized Price of Longer-term Holders would also be expected to eventually rise, but with a delay thanks to the conditions that coins haven’t moved in at least 155 days.
The past three times the Realized Price crossed above the Realized Price of Longer-term Hodlers after a prolonged spell below it, Bitcoin went on to post a parabolic rally in the subsequent few years.
The List of Indicators Signalling a Bitcoin Bull Market is Here is Growing
The Realized Price/Realized Price of Longer-term Holders indicator will soon likely join a growing list of technical and on-chain indicators suggesting a new Bitcoin bull market is here.
As discussed in a recent article, all eight of the on-chain and technical indicators tracked by Glassnode’s Recovering from a Bitcoin Bear dashboard have been flashing that a bull market is here for most of the last six or so weeks.
A separate on-chain indicator tracked by Glassnode called “Reserve Risk” – which acts as a guage of HODLer conviction – also recovered from historic lows earlier this year, another significant bull market indicator.
Similarly, others have pointed to the widely followed Market Value to Realized Value Ratio, or MVRV Ratio, as also sending a historic bullish signal.
Elsewhere, CryptoQuant’s PnL Index “confirmed” that Bitcoin had entered into the early stages of a bull market earlier this year as well.
CryptoQuant PnL Index Confirms Early Bull Market For Now
— CryptoQuant.com (@cryptoquant_com) January 26, 2023
1/7 🧵👇 pic.twitter.com/ShhqUR1xEl
Is Bitcoin In a New Three-Year Bull Run?
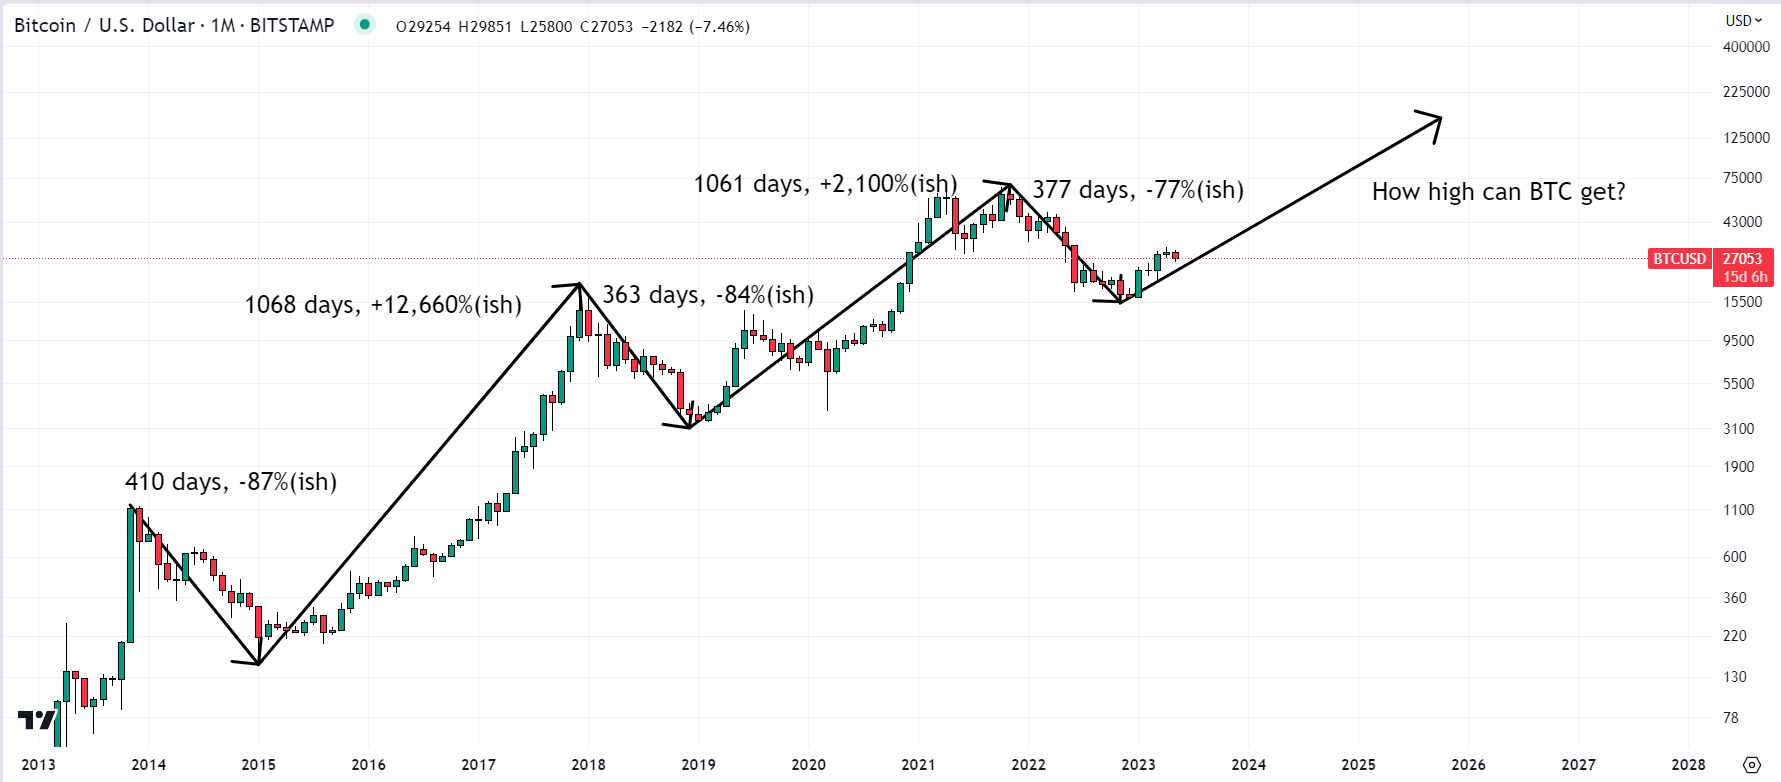
Analysis of Bitcoin’s longer-term market cycle, which tends to last about four years, suggests Bitcoin could be in the year stages of a potentially three-year-long bull market.
In the past three market cycles, each Bitcoin bear market has lasted for around one year, while each bull market has lasted around three years.
If Bitcoin’s November 2021 (around the time of the record highs) to November 2022 (around the time of the 2022 lows) bear market has concluded, we might now be about six months into a new roughly three-year-long bull market.
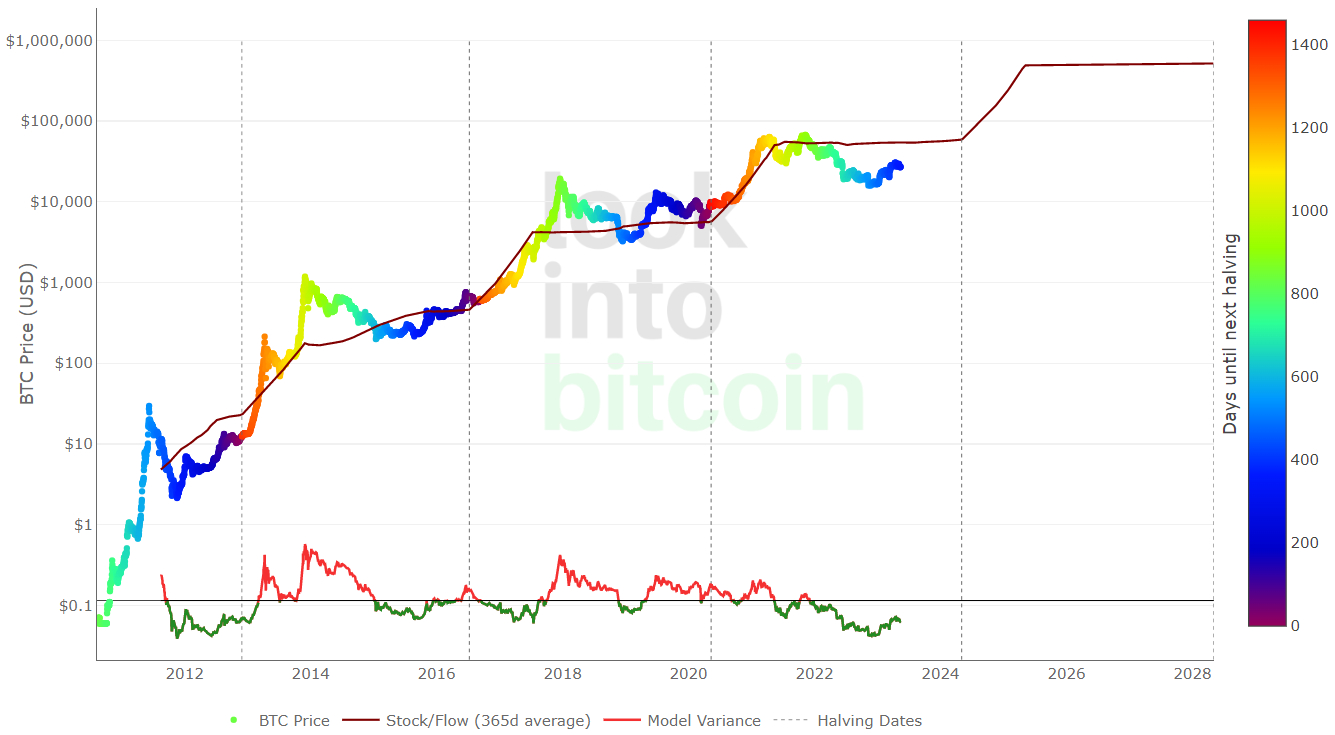
The Bitcoin Stock-to-Flow (S2F) model lends itself to the idea that a new bull run is coming in the lead-up to and aftermath of next year’s Bitcoin halving event.
According to the Bitcoin Stock-to-Flow pricing model, the Bitcoin market cycle is roughly four years, which shows an estimated price level based on the number of BTC available in the market relative to the amount being mined each year.
Bitcoin’s fair price right now is around $55K and could rise above $500K in the next post-halving market cycle – that’s around 18.5x gains from current levels.
Finally, Blockchaincenter.net’s popular Bitcoin Rainbow Chart shows that, at current levels, Bitcoin is in the “BUY!” zone, having recently recovered from the “Basically a Fire Sale” zone in late 2022.
In other words, the model suggests that Bitcoin is gradually recovering from being highly oversold.
During its last bull run, Bitcoin was able to reach the “Sell. Seriously, SELL!” zone.

If it can repeat this feat in the next post-halving market cycle within one to one and a half years after the next halving, the model suggests a possible Bitcoin price in the $200-$300K region. That’s around 8-13x gains from current levels.
- Mark Zuckerberg’s Meta AI Predicts Unbelievable Bitcoin Price by the End of 2026
- Google Gemini AI Predicts Crazy Solana Price by the End of 2026
- XRP Price Prediction: MVRV Data Points Bullish
- Elon Musk Grok AI Predicts Incredible XRP Price and Bitcoin Price by End of 2026
- Leading Claude AI Fable 5 Predicts Stunning XRP Price by The End of 2026
2M+
250+
8
70


- Mark Zuckerberg’s Meta AI Predicts Unbelievable Bitcoin Price by the End of 2026
- Google Gemini AI Predicts Crazy Solana Price by the End of 2026
- XRP Price Prediction: MVRV Data Points Bullish
- Elon Musk Grok AI Predicts Incredible XRP Price and Bitcoin Price by End of 2026
- Leading Claude AI Fable 5 Predicts Stunning XRP Price by The End of 2026
More Articles

