Realized Bitcoin P/L Ratio About to Rise Above 1 – How Will BTC Price Be Impacted?


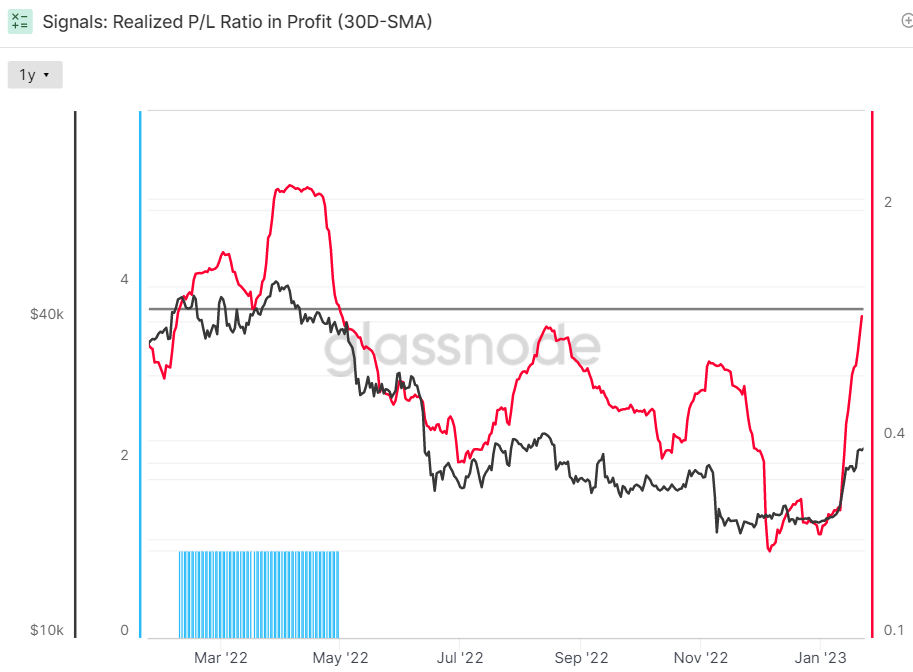
The 30-Day Simple Moving Average (SMA) of Glassnode’s Bitcoin Realized Profit-Loss Ratio (RPLR) indicator is about to move above one for the first time last April. That will mean that the Bitcoin market will soon be realizing a greater proportion of profits (denominated in USD) than losses. According to Glassnode, “this generally signifies that sellers with unrealized losses have been exhausted, and a healthier inflow of demand exists to absorb profit taking”.
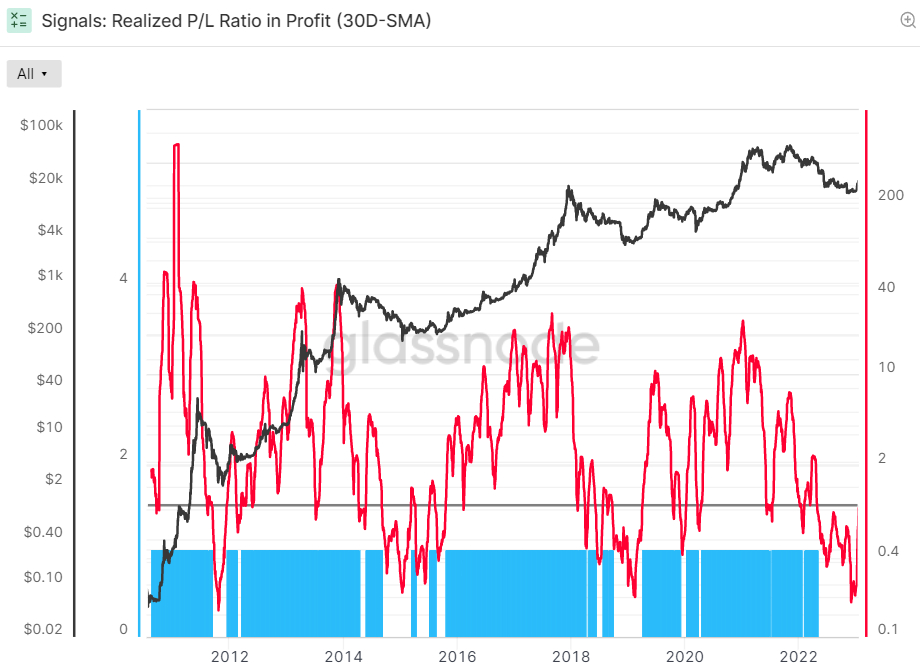
Historically, a break back above one in the 30-Day SMA of the Realized Profit-Loss Ratio following a prolonged spell below zero (due to a bear market) has coincided with Bitcoin market bottoms. When the RPLR bottomed in 2015 at 0.23 (and the Bitcoin price was just under $200), Bitcoin then went on to post a near 90x rally in the next just under three years.
Similarly, when the RPLR bottomed around 0.2 in 2019 and Bitcoin’s price had fallen to around $3,600, the cryptocurrency then went on to rally around 19x to by the time it hit record highs in late 2021 just under three years later. The RPLR recently bottomed around 0.18, its lowest since 2011 when Bitcoin was trading in the $16,000s.
Bulls will be hoping for history to once again rhyme, and that the world’s largest cryptocurrency by market cap can post another exponential rally from lows over the next three or so years. A 10x rally from recent lows would see Bitcoin hitting around $160,000.
Alternative Bitcoin Market Cycle Indicator Also Flashing Green
The RPLR is sending a clear signal that Bitcoin might be in the early stages of a new bull market. Alternative Bitcoin market cycle indicators are sending a similar message. According to Bitcoin’s stock-to-flow valuation model, a big rally could be coming up in the year’s ahead.
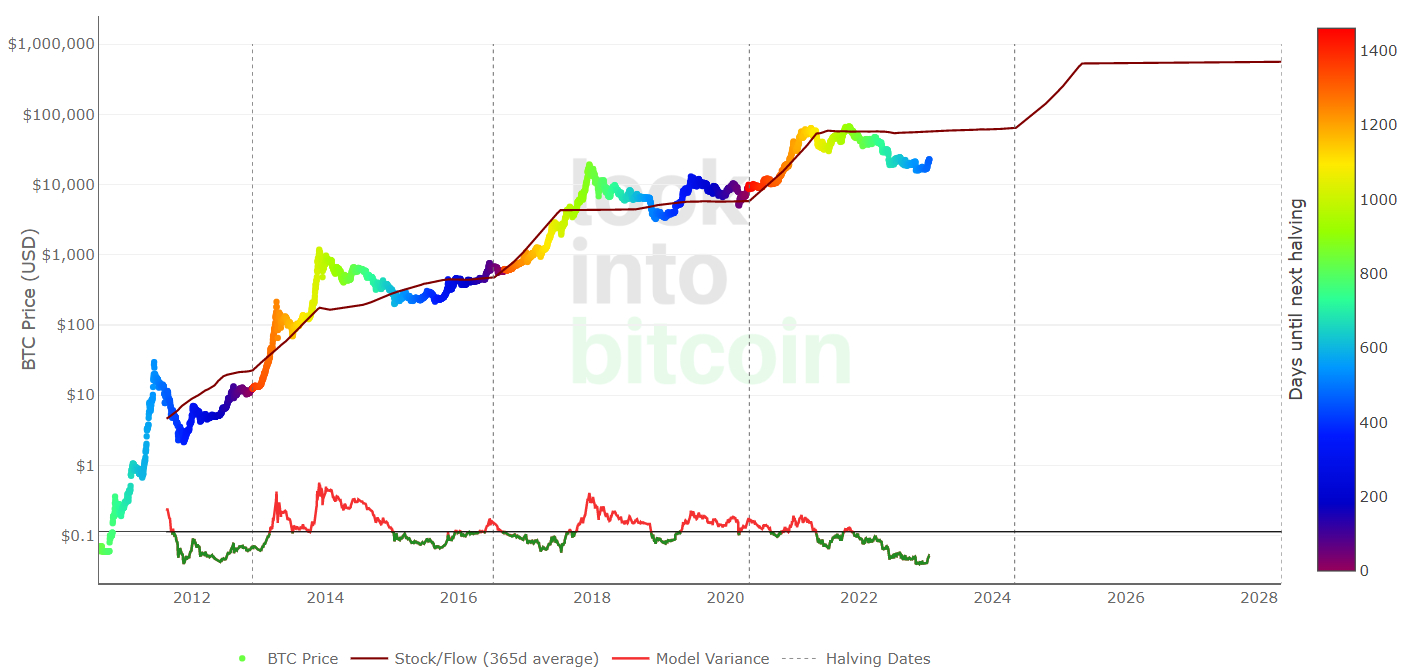
As can be seen in the above chart courtesy of look into bitcoin, Bitcoin’s price follows a predictable market cycle between each so-called “halving” (when the mining reward is cut in half). Immediately after the halving, there is typically an exponential surge in Bitcoin’s price, followed by a bear market that normally bottoms about halfway to the next Bitcoin halving. This cycle has been followed pretty well so far during the current cycle.
Similar chart analysis posted by pseudonymous crypto-focused Twitter account @CryptoHornHairs showed that Bitcoin is almost exactly following a near four-year market cycle where prices rally for 1064 days after each 364-day bear market. According to @CryptoHornHair’s analysis, Bitcoin’s price has followed this cycle almost to the letter of the past eight years.
$BTC #Bitcoin
— HornHairs 🌊 (@CryptoHornHairs) January 12, 2023
2015-2017 bull market: 1064 days
2017-2018 bear market: 364 days
2018-2021 bull market: 1064 days
2021-*current* market low: 364 days
Days left until the top if we just carbon copy the cycle timeframe again: 1001 days pic.twitter.com/KoNZxJRuy5
Other Indicators Pointing to a Bitcoin Bottom
At current levels in the upper $22,000s, Bitcoin is trading higher by around 37.5% this month, its best monthly gain since October 2021. The rally has unsurprisingly generated a lot of excitement and heated debate over the prospect of 2022’s bear market potentially ending.
Indeed, the broader macro picture is looking more favorable than it was in 2023 – the bulk of the Fed’s rate hikes appear to have already happened with US inflation falling rapidly back to the central bank’s 2.0% target and with US growth slowing significantly. Indeed, macro traders are increasingly betting on a more favorable interest rate backdrop in late 2023/into 2024.
In other words, the main driver of 2022’s bear market (a more hawkish than expected Fed) looks like it isn’t going to be (as much of ) a problem in 2023. At the same time, multiple other technical and on-chain indicators are also pointing to the Bitcoin bottom perhaps having been printed.
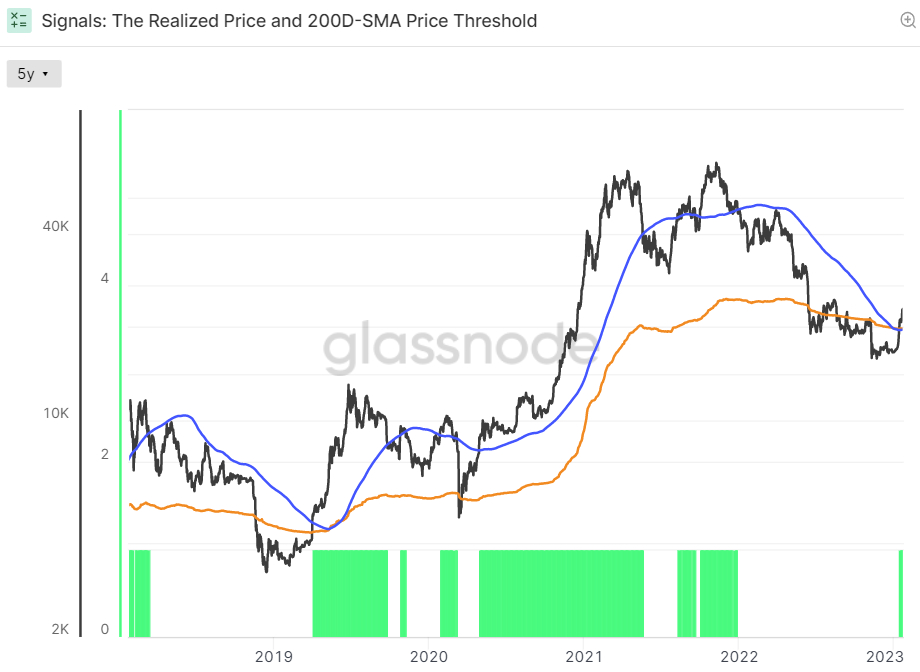
Firstly, Bitcoin recently surged above its 200-Day SMA and Realized Price. Both are viewed as highly significant levels, with a sustained break to the north or south of either often viewed as indicative of a shift in Bitcoin’s price momentum. Glassnode’s New Addresses Momentum and RHODL Multiple Indicators have also been trending higher. Elsewhere, Alternative.me’s Bitcoin Fear and Greed Index recently recovery to neutral (above 50). If it can now hold above 50 on a sustained basis, this has historically been typical of a bear market ending.
- Mark Zuckerberg’s Meta AI Predicts Unbelievable Bitcoin Price by the End of 2026
- Google Gemini AI Predicts Crazy Solana Price by the End of 2026
- XRP Price Prediction: MVRV Data Points Bullish
- Bitcoin Price Prediction: Saylor’s Strategy is a Risk to Bitcoin, According to JP Morgan
- Elon Musk Grok AI Predicts Incredible XRP Price and Bitcoin Price by End of 2026
2M+
250+
8
70


- Mark Zuckerberg’s Meta AI Predicts Unbelievable Bitcoin Price by the End of 2026
- Google Gemini AI Predicts Crazy Solana Price by the End of 2026
- XRP Price Prediction: MVRV Data Points Bullish
- Bitcoin Price Prediction: Saylor’s Strategy is a Risk to Bitcoin, According to JP Morgan
- Elon Musk Grok AI Predicts Incredible XRP Price and Bitcoin Price by End of 2026
More Articles

