Litecoin Completes Bullish Chart Pattern


After surging well 20% over the past 7 days, litecoin (LTC) is now one of the best-performing coins this week among the top 20 cryptocurrencies by market capitalization.
Over the past 24 hours, LTC is up by almost 4%, trading at about USD 66 as of pixel time (13:26 UTC). And following the latest surge in price, an interesting price pattern is now visible in the chart.
As some technical analysts may have already noticed, the litecoin price has been setting up for a “cup-and-handle” pattern to be formed over the past week or so. The pattern became more obvious after the price found support around the USD 52 level on January 24 and 25, and started trading higher again, forming the missing “handle” on the cup.
On Thursday, the cryptocurrency, which was created by Charlie Lee as a near-identical copy of bitcoin (BTC) in 2011, then surged even higher, which confirmed the pattern, as well as a clear break-out through the 200-day moving average (blue line in the chart).
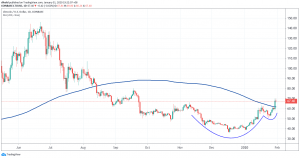
The next step for litecoin’s surge to continue from a technical standpoint would now be to ensure that the 200-day moving average line goes from being a level of resistance to become a support level in the chart. This essentially means that we would need to see the price bounce back up if it were to touch that line again. With the currently strong momentum, however, such a re-test may not even necessarily happen.
Both 100 and 200-day moving average lines are considered significant levels in the chart that many traders use to distinguish between bull and bear markets. For instance, Tom Lee of Fundstrat Global Advisors recently noted that bitcoin is “back in a bull market” after it broke through its 200-day moving average line.
The cup-and-handle pattern, on the other hand, is often used to call major bottoms in markets. The pattern was first popularized in William J. O’Neil’s classic How to Make Money in Stocks from 1988, and has later become known as one of the most reliable bullish chart patterns among technical analysts.
- Elon Musk Grok AI Predicts Incredible XRP Price Target by End of 2026
- Cardano News: ADA Price Just Gave Back Half Its 27% Weekly Rally, Are Whales About to Pull the Rug?
- Sam Altman ChatGPT AI Predicts Insane Bitcoin Price by 2026
- NOBLE Endorses CLARITY Act as Major County Sheriffs Drop Opposition
- XRP Price Prediction: Validators Welcome XRP Ledger Last Upgrade
2M+
250+
8
70


- Elon Musk Grok AI Predicts Incredible XRP Price Target by End of 2026
- Cardano News: ADA Price Just Gave Back Half Its 27% Weekly Rally, Are Whales About to Pull the Rug?
- Sam Altman ChatGPT AI Predicts Insane Bitcoin Price by 2026
- NOBLE Endorses CLARITY Act as Major County Sheriffs Drop Opposition
- XRP Price Prediction: Validators Welcome XRP Ledger Last Upgrade
More Articles

