Ethereum and XRP Test Supports


The broader crypto market once again saw some selling on Wednesday, although the pace of the sell-off has certainly slowed and the market appears to be searching for firm support. For major coins like ethereum (ETH) and Ripple’s XRP, that means looking for chart levels from as far back as mid-2017.

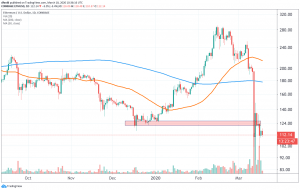
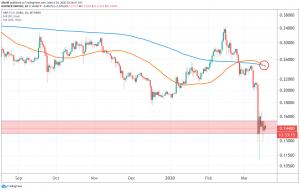
As of press time on Wednesday (11:08 UTC), ethereum is trading down 4% to a price of USD 113 (also down 43% in a week and 55% in a month), while XRP trades at USD 0.1437, down 3.7% over the past 24 hours, 31% in a week and 48% in a month. Most other altcoins are also seeing similar trading today. Bitcoin (BTC) is down 3.7% in a day and 35% in a week.
First taking a look at ethereum, we need to go back to the beginning of 2019 to find similar prices as we have now, which also allows us to look for potential support levels in the chart. Based on this, some support appears to be around the USD 105 level, which is still well below current levels.
If the USD 105 level were to break, however, the next area of interest below that would be the 2018 low of around USD 82, which may also provide some support.
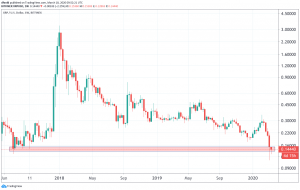
Moving over to the long-term weekly chart of XRP, it’s clear that the overall trend remains bearish for XRP. Since reaching its all-time high back in the beginning of 2018, the price has made a series of lower highs and lower lows – the very definition of a downtrend.
Zooming in to the daily chart, however, we see that the important 50 and 200-day moving average lines have crossed each other again, forming a so-called “death cross” on the chart of XRP. Interestingly, this happened less than a month after XRP and many other altcoins had “golden crosses” appear in their charts back in February.
For now, it’s too soon to say if the selling in XRP is over for this time, and traders should, therefore, remain cautious.
- Bitcoin Price Prediction: BTC USD Shrugging Off $800 Billion AI Sell-Off
- XRP Price Prediction: Ripple Token Spot Demand Hits Highest Since June
- XRP Price Fails to Complete Cup and Handle as Ripple Introduces Mint to Solve RLUSD Problem
- Ethereum News: How a $67M ETH Short Reveals Hyperliquid’s Institutional Leap
- Ethereum Price Gaining Ground as Its SMA 30D Funding Rate Climbs Highest in Six Months
2M+
250+
8
70


- Bitcoin Price Prediction: BTC USD Shrugging Off $800 Billion AI Sell-Off
- XRP Price Prediction: Ripple Token Spot Demand Hits Highest Since June
- XRP Price Fails to Complete Cup and Handle as Ripple Introduces Mint to Solve RLUSD Problem
- Ethereum News: How a $67M ETH Short Reveals Hyperliquid’s Institutional Leap
- Ethereum Price Gaining Ground as Its SMA 30D Funding Rate Climbs Highest in Six Months
More Articles

