This Bitcoin Price Top Indicator Could Actually Be a Good Bottom Indicator Too


Since reaching its all-time high of almost $69,000 in November 2021, Bitcoin has been on the decline ever since.
As we recently touched on, the price of Bitcoin has been on the slide for the better part of a year, but the bottom appears to be in sight. Though most indicators suggest that Bitcoin is now nearing the bottom of its recent bear market, it remains unclear just how low it can go or when it will occur.
But by repurposing the popular Pi Cycle Top indicator, we may now be inching closer to an answer.
How it Works
Created by Philip Swift, the founder of LookIntoBitcoin, the Pi Cycle Top indicator uses a combination of the 111-day simple moving average (111SMA) and 2x multiple of Bitcoin’s 350-day simple moving average (2x 350SMA) to forecast the top of Bitcoin’s market cycles.
Historically, the 2x 350SMA has proven to be an accurate predictor of Bitcoin’s top, having closely predicted the height and timing of the past 3 bull markets.
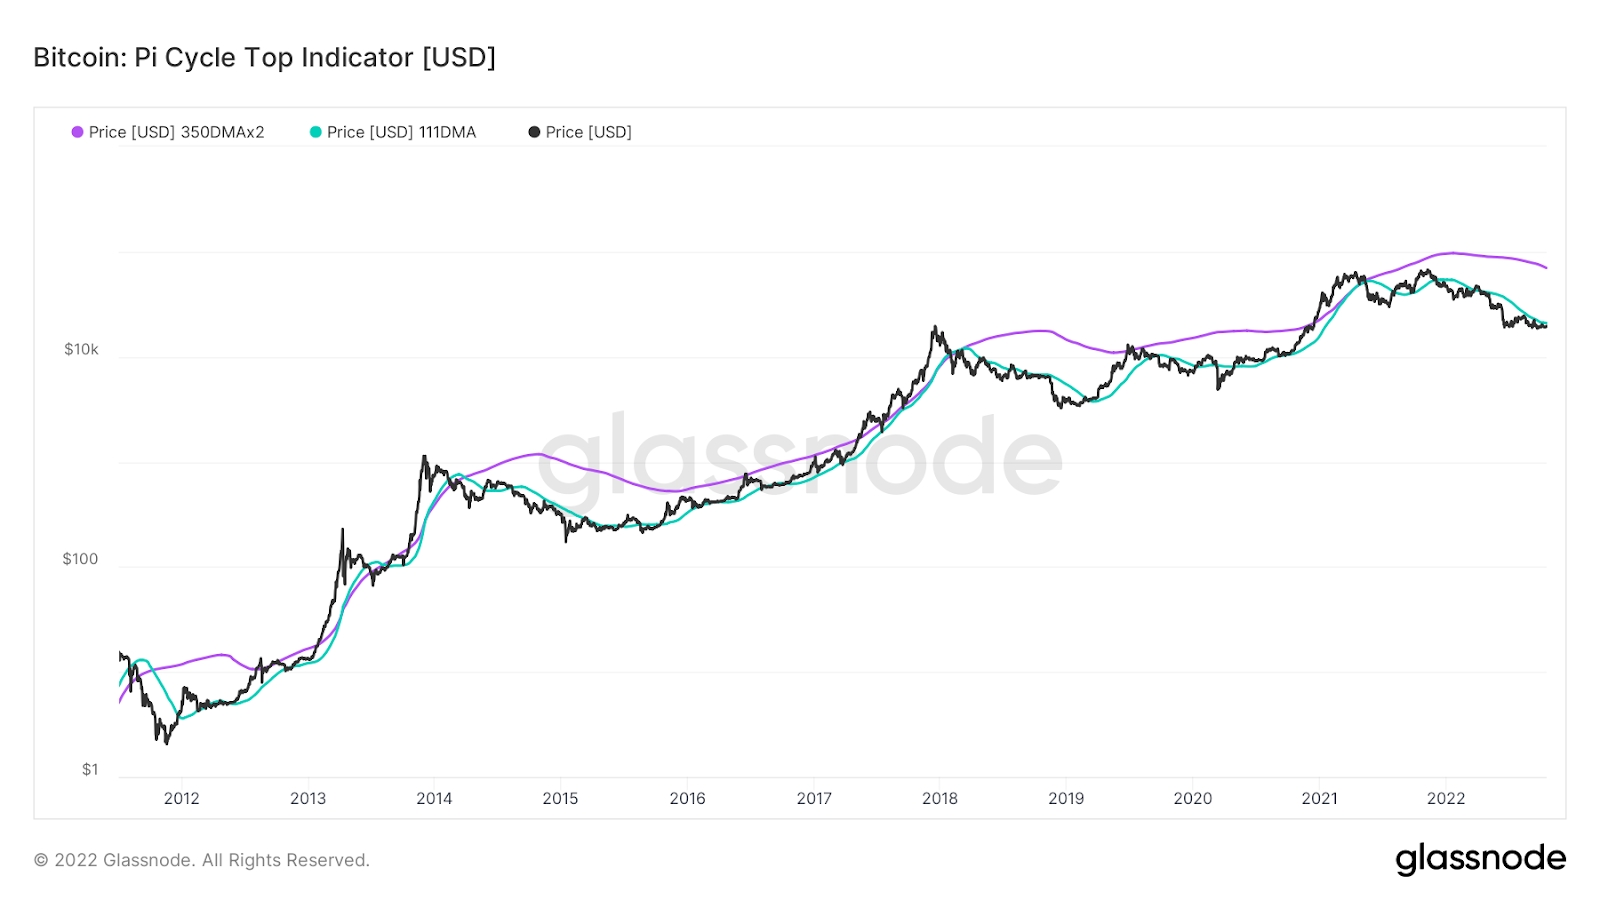
Though the Pi Cycle Top Indicator is primarily used for indicating Bitcoin’s top, it also demonstrates impressive predictive power for its bottom — with the 111SMA overlapping the bottom of the 2012, 2015, and 2019 bear markets.
Backtested on historical data, the 111SMA has been shown to predict the depth and timing of the Bitcoin bottom to within 5 months.
What it Means for the Bitcoin Price
Bitcoin is widely known to have a roughly four-year cycle centered around the halving event — with Bitcoin tending to bottom around 380-550 days prior to its halving date, and topping out around 360 to 520 days post-halving.
But these figures are far from precise enough to really take advantage of.
According to the 111SMA, the Bitcoin price now appears to be between 1-5 months away from its bottom, which means a further slide can be expected at some point before March 2023. Given that the 111SMA has, so far, never bottomed before Bitcoin, we can assume that the bottom is not yet in for either.
If history once again repeats itself, then Bitcoin can be expected to fall as much as 86% from its previous all-time highest value to potentially fall under $10,000 briefly. Should this be the case, then a further 49% drop could be on the horizon.
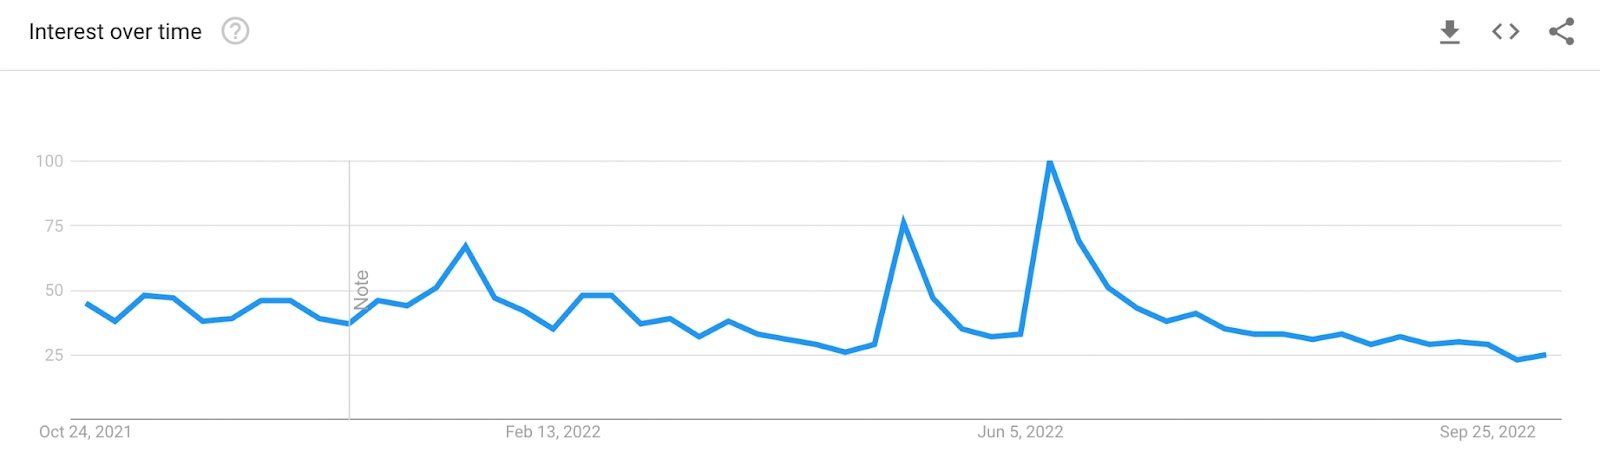
This is further corroborated by Bitcoin’s sliding trading volume — which has decreased by more than a third in the last three months. While Google search interest has fallen by 50% over the same period.
The relationship between trading volume and Bitcoin’s price is well-documented, with a clear positive correlation found between volume and price.
This agrees with its historical price action, which saw Bitcoin experience a sharp drop over a ~1 month period to reach its bottom, before beginning its long-term recovery.
But with the macroeconomic environment still in a bad way with the DXY continuing to rally and most countries seeing a decline in their GDP, risk-on assets like Bitcoin are unlikely to experience a dramatic comeback any time soon.
- Microsoft Copilot AI Predicts Insane XRP Price by End Of 2026
- Perplexity AI Predicts XRP Will Hit This XRP Price by End of 2026
- Sam Altman ChatGPT AI Predicts Insane SpaceX Stock Price by End of 2026
- Google Gemini AI Predicts Shocking Bitcoin Price by End of 2026
- Premium Claude AI Model Fable 5 Predicts Bold Bitcoin Price Target by End of 2026
2M+
250+
8
70


- Microsoft Copilot AI Predicts Insane XRP Price by End Of 2026
- Perplexity AI Predicts XRP Will Hit This XRP Price by End of 2026
- Sam Altman ChatGPT AI Predicts Insane SpaceX Stock Price by End of 2026
- Google Gemini AI Predicts Shocking Bitcoin Price by End of 2026
- Premium Claude AI Model Fable 5 Predicts Bold Bitcoin Price Target by End of 2026
More Articles

