
Bitcoin Price Takes Breather at $21k Two Month High – Is $30k by End of Month Possible?


Bitcoin price is extending the week-long rally that has seen it blast past $20,000 for the first time since early November. Bulls have $24,000 in sight, but first, they must disperse the stubborn seller congestion zone at $21,000.
Bitcoin Price on The Cusp Of A Bull Market
Over the last two weeks, Bitcoin price has disapproved calls for further downside action to $13,000 and $9,000, and analysts are changing the tune in favor of a sustainable bullish breakout.
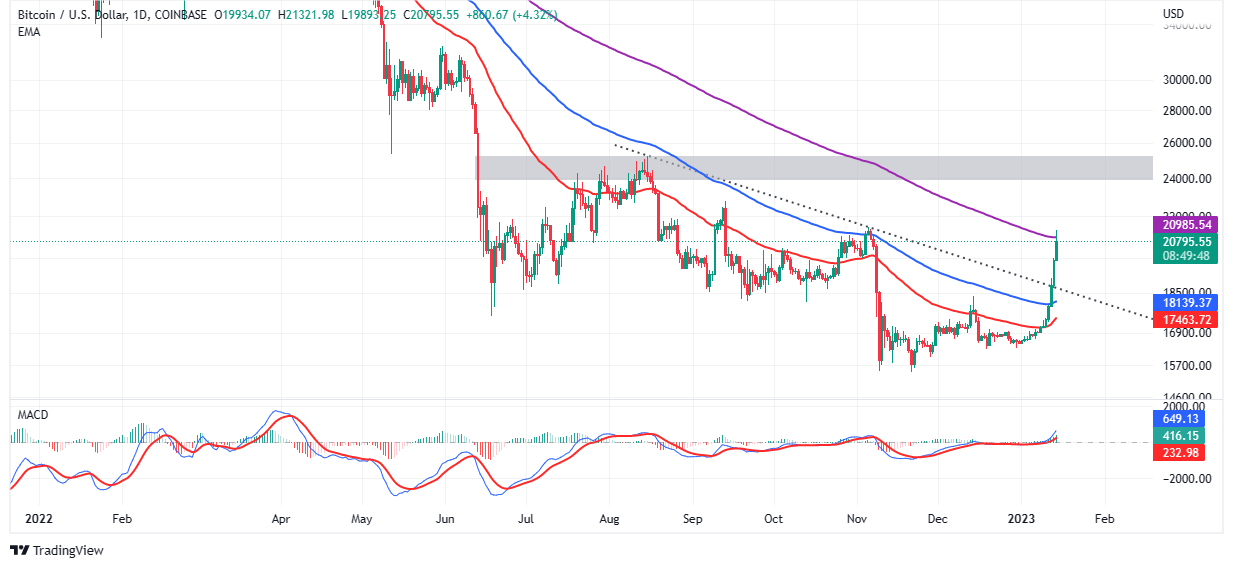
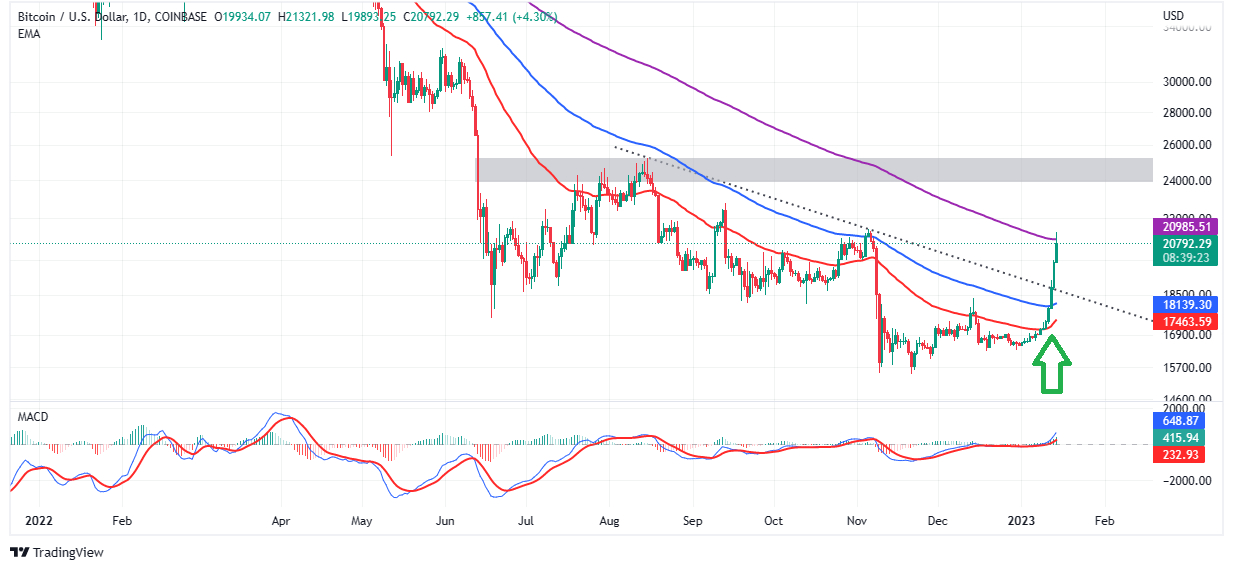
The bullish outlook in BTC price started after flipping above the 50-day Exponential Moving Average (EMA) (in red). However, the next break past the 100-day EMA (in blue) resolved the bulls’ presence in the market, paving the way for a much-needed move through the falling trend line (dotted).
Bitcoin price now trades at $20,720 after tagging a new yearly high of $21,383 as the green candle stretched its wick. A breakthrough resistance at the 200-day EMA (in purple) is necessary for BTC to confirm a macro bullish outlook.
Altcoin Sherpa, a popular crypto analyst and trader, told his more than 188k followers on Twitter that investors should consider taking profit at the 200-day EMA – supply zone. “Overall move looks a bit overextended and a pullback should be coming. Still don’t think this is the overall macro bottom but let’s see,” he wrote.
Therefore, a daily close above this level would be crucial for Bitcoin price as bulls push for another sharp move to $24,000 and $30,000 after that. Failure to do so would encourage more investors to book profits with the hope of buying a low-priced BTC downhill.
According to another crypto analyst, Mags, “Bitcoin price is closing in on the mid-range level around $21,500.” It is worth mentioning that the price has erased the entire FTX implosion dump. From here, the “best case scenario would be a continuation till $25k without re-testing $18.7k,” Mags said.
As experts call for a continued move north, Captain Faibik reckoned to his 44k followers that “once 21.3k resistance gets cleared, bull run 2023 will officially start.” For now, the path with the least resistance appears to maintain its northbound direction, bolstered by a buy signal from the Moving Average Convergence Divergence (MACD) indicator on the same daily time frame chart.
Traders looking for more long positions in Bitcoin must wait until the 200-day EMA resistance is out of the way. Moreover, they must ensure the MACD sustains the uptrend above the mean line and that its histograms stay green.
Fundamentals Back Bitcoin Price Relief Rally
Over 1.56 million addresses that previously purchased 816 BTC between $18,943 and $19,549 will likely keep throwing their weight behind Bitcoin price as it climbs toward $30,000. Moreover, the IOMAP model by IntoTheBlock shows that the largest cryptocurrency faces shrinking resistances above $20,000.
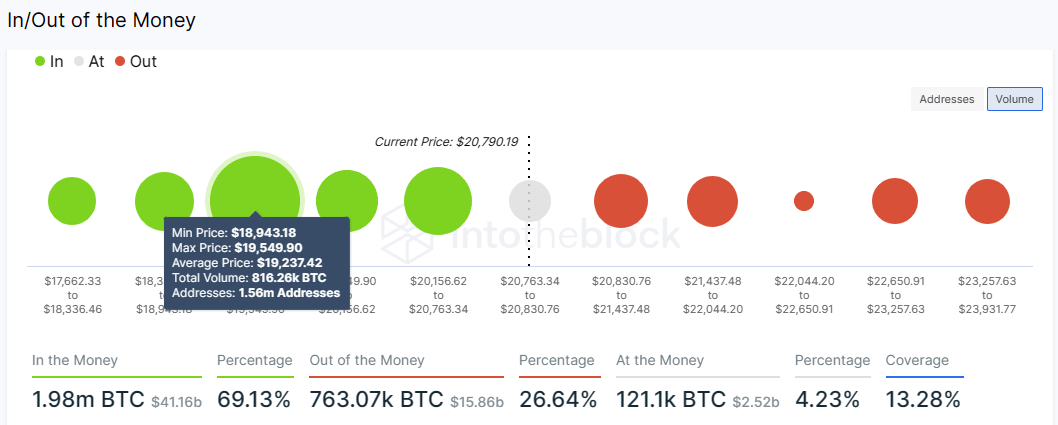
As observed from the chart below, Bitcoin price is in a suitable position to keep the rally intact as opposed to retracing below $20,000. Nevertheless, if investors book profits in droves, overhead pressure may force it to test support at $18,500 and $15,500.
Related Articles:
- Elon Musk Grok AI Predicts Shocking XRP Price in The Next 28 Days
- This ChatGPT AI XRP Price Prediction Should Not Make Sense But It Does
- Elon Musk Accepts Dogecoin for SpaceX Payments as DOGE Stalls Ahead of Historic IPO
- Nobody Wants To Admit Google Gemini AI Might Be Right About XRP Price Prediction
- XRP News: David Schwartz Just Said XRP Is Becoming a Settlement Layer for Stocks and Loans, Is the Infrastructure Actually Ready?
2M+
250+
8
70


- Elon Musk Grok AI Predicts Shocking XRP Price in The Next 28 Days
- This ChatGPT AI XRP Price Prediction Should Not Make Sense But It Does
- Elon Musk Accepts Dogecoin for SpaceX Payments as DOGE Stalls Ahead of Historic IPO
- Nobody Wants To Admit Google Gemini AI Might Be Right About XRP Price Prediction
- XRP News: David Schwartz Just Said XRP Is Becoming a Settlement Layer for Stocks and Loans, Is the Infrastructure Actually Ready?
More Articles

