Bitcoin Price May Be Nearing Bottom if these Drilling Analogy Metrics Are Correct


If there’s one thing practically every cryptocurrency holder or speculator has attempted to do, it’s predict or identify the bottom of a bear market for the bitcoin price.
Given that the delta between a trough and a subsequent all-time price high can be in the range of tens to hundreds of percentage points for popular cryptocurrencies, the potential benefits of building an accurate model to identify peaks and troughs are enormous.
Until recently, most models were only able to identify either the top or the bottom of a market with reasonable accuracy. But Glassnode, a prominent on-chain analytics and research firm, recently unveiled a novel model to accurately identify both — with a 100% hit rate against backtested data.
The new model, known simply as the drilling method, leverages multiple new and existing data points to help accurately identify market extremes — providing an additional source of data for traders and speculators.
This is how it works.
The Bitcoin Price and Mayer Multiples of 2.4
Created by the prominent investor Trace Mayer, the Mayer Multiple is defined as the multiple of Bitcoin’s price over its 200-day moving average (MA) — such that a current price of $50,000 and a 200-day MA of $25,000 would yield a Mayer Multiple of 2.
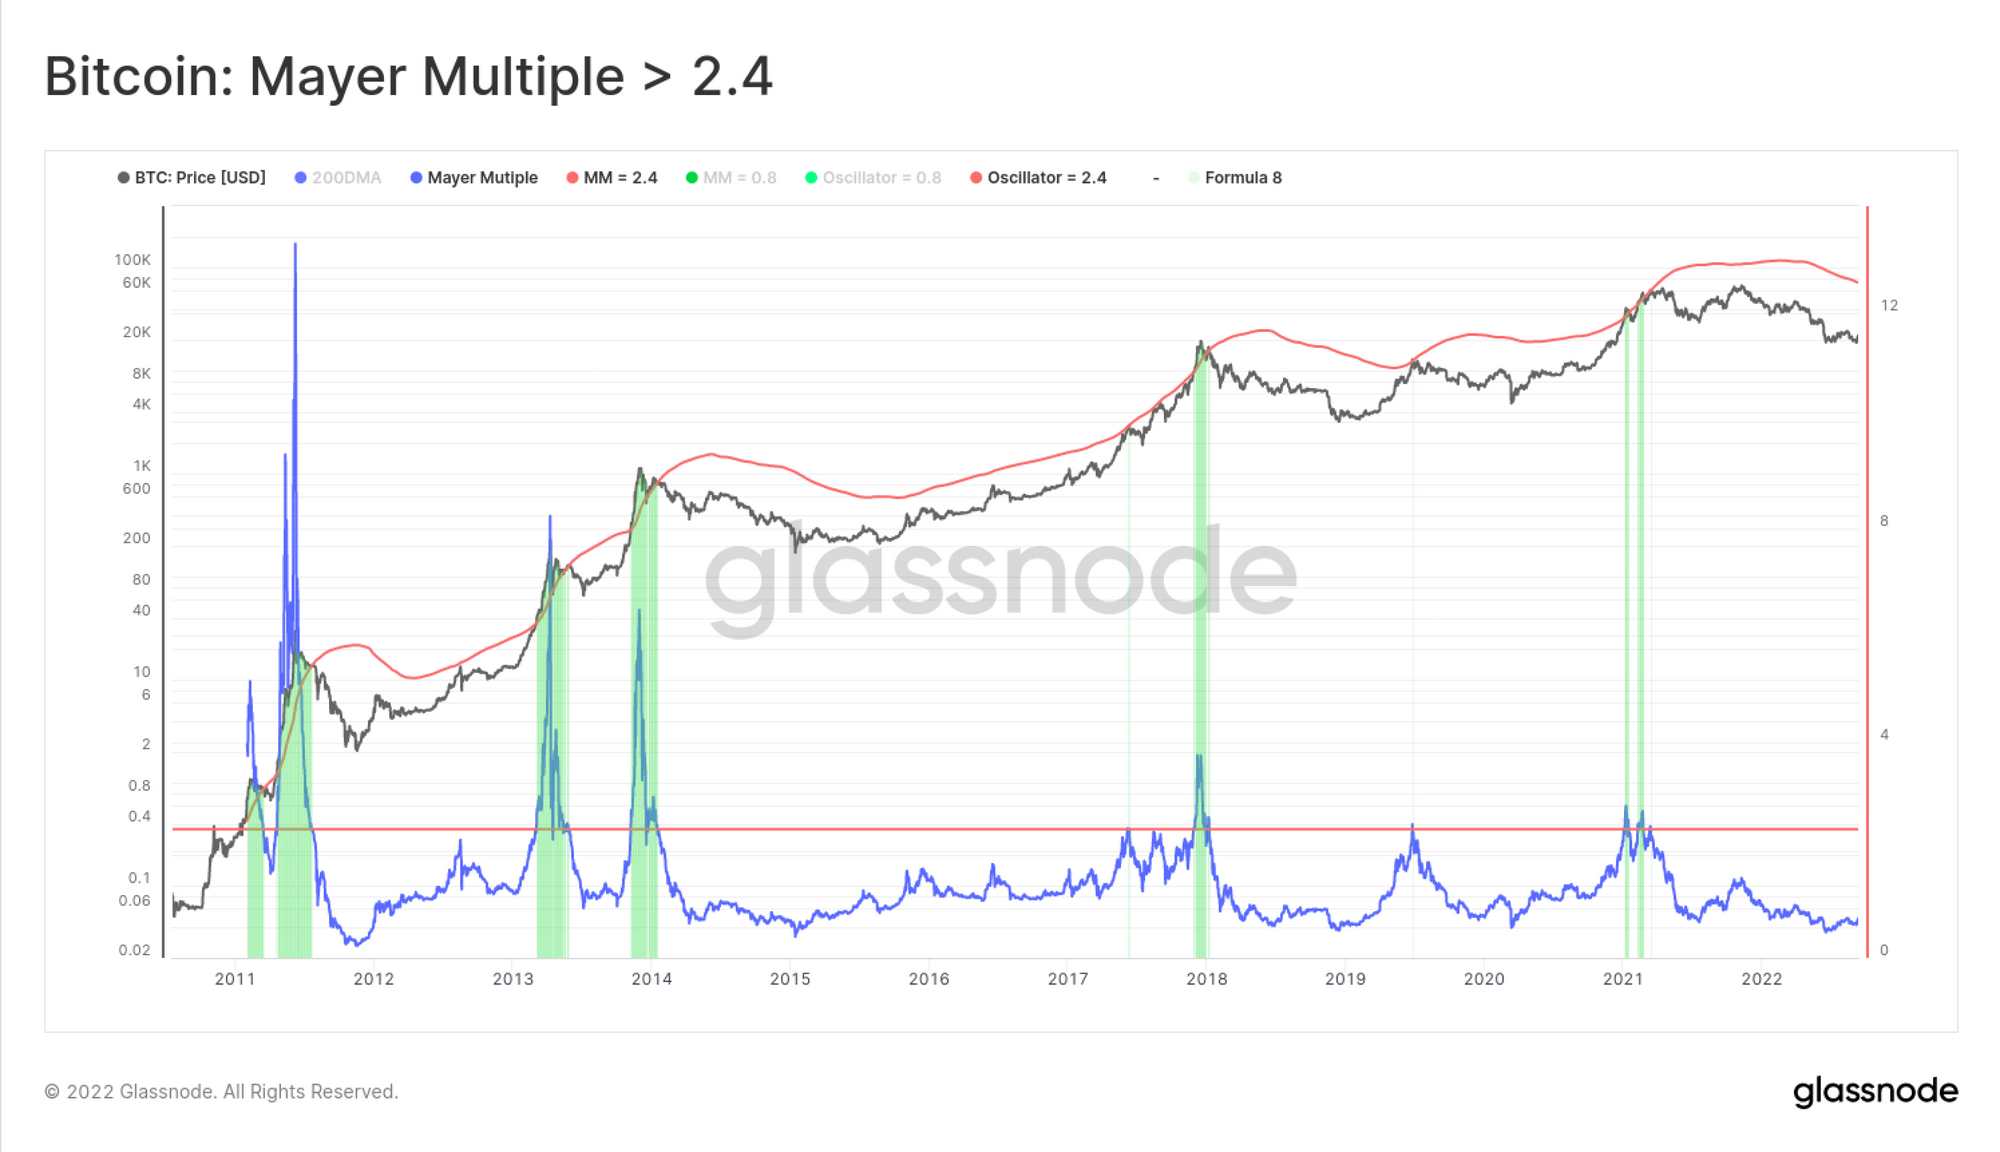
The Mayer Multiple has been used to indicate whether Bitcoin is in a bubble or not. By backtesting data, Trace Mayer found that a Mayer Multiple of 2.4 could accurately predict the top of a bull market, whereas a number less than 1 indicates a bear market.
As such, many traders believe that a Mayer Multiple of 2.4+ indicates the Bitcoin price is overvalued or that buyer exhaustion is near.
Going one step further, Glassnode created a construction that tests whether the Mayer Multiple is above 2.4, in addition to several other parameters to determine the condition of the Bitcoin market.
By taking the Mayer Multiple, the current price, and the percent of Bitcoin supply in profit, Glassnode was able to accurately identify whether Bitcoin is currently at the peak or trough of a market cycle.
What Is The Drilling Method?
As an incredibly volatile asset class, cryptocurrencies like Bitcoin are known to regularly shake out overleveraged speculators and fair-weather holders. But until now, there was no indicator that could gauge holder resistance to price volatility — a good measure of market hardiness.
As part of the report, Glassnode made the unusual connection between the resistance to Bitcoin price volatility and the measurement while drilling (MWD) technique — which describes how rock hardness/strength varies at different drilling depths.
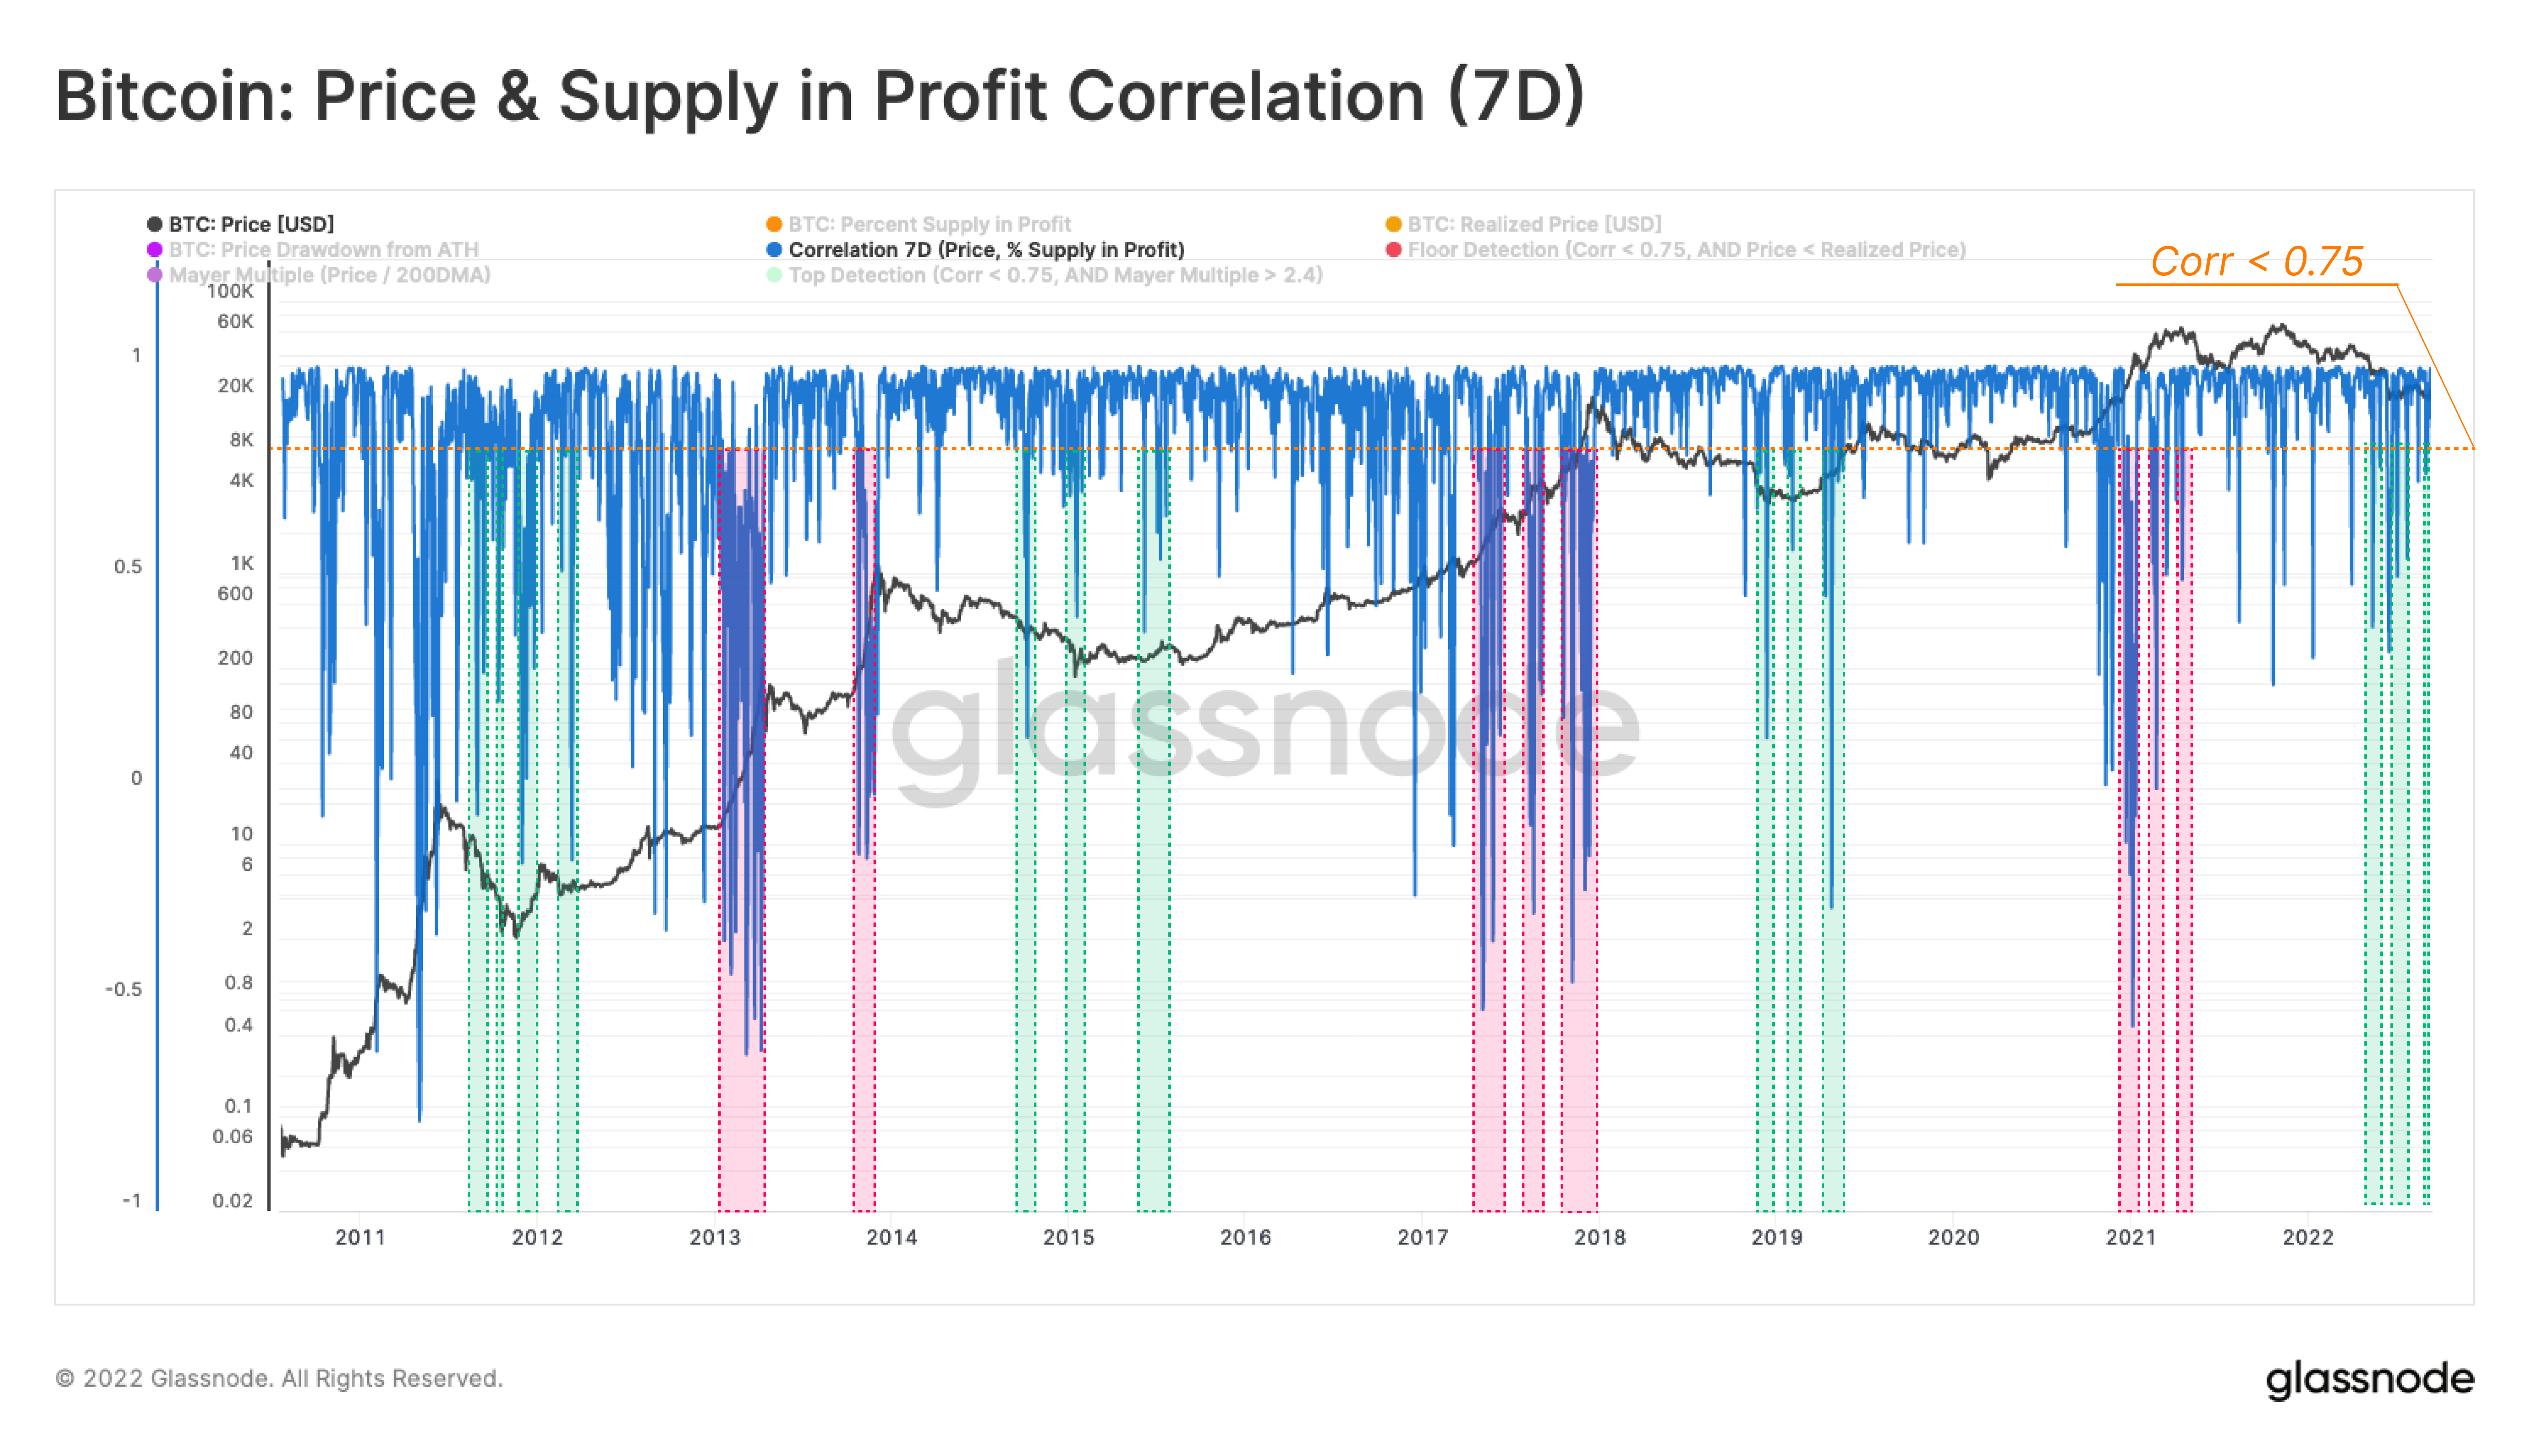
Where MWD records parameters like depth, penetration rate, rock density, porosity, and more to determine drilling resistance, Glassnode’s new drilling method instead tracks the correlation between Bitcoin’s price change and the change of the percent of supply in profit to help identify cycle extremes.
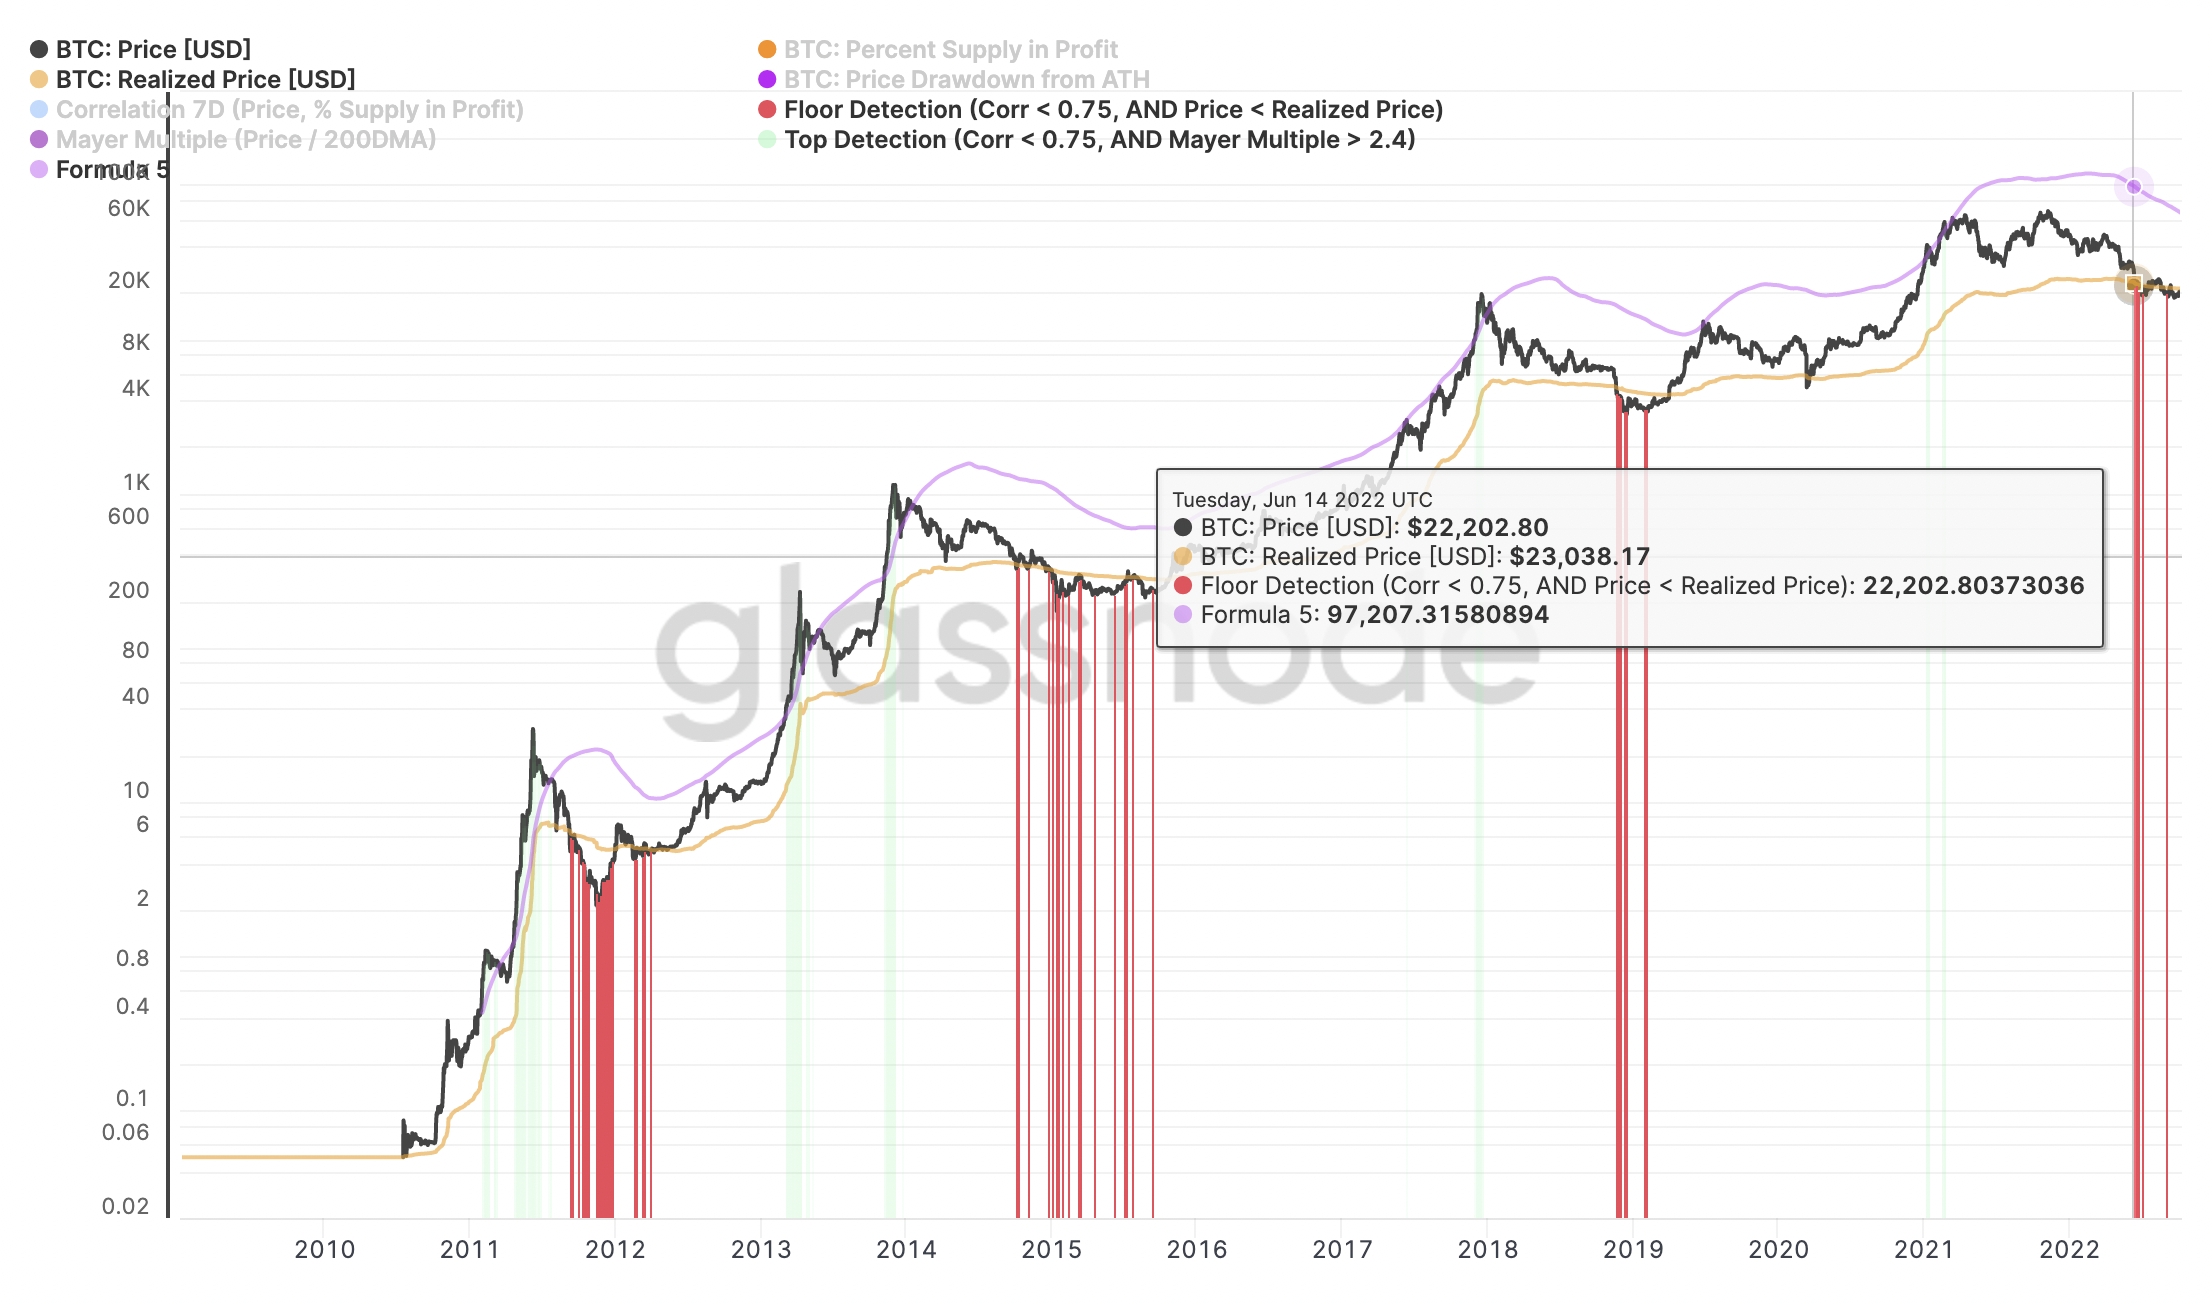
Using this method on backtested data, Glassnode identified top (red columns) and floor points (green columns) between 2010 and 2022.
Glassnode did this by looking at points where the Mayer Multiple was above 2.4 and then looking at the correlation between price and percentage of the supply in profit.
Based on the Mayer Multiple and whether the realized price (price the last time the BTC was moved) was higher or lower than the market price, Glassnode found the following:
When the correlation was under 0.75 while the Mayer Multiple was above 2.4, this indicates the market is close to the top of a cycle.
When the correlation was under 0.75 and the current price is below the realized price, this indicates the market is close to the bottom of a cycle.
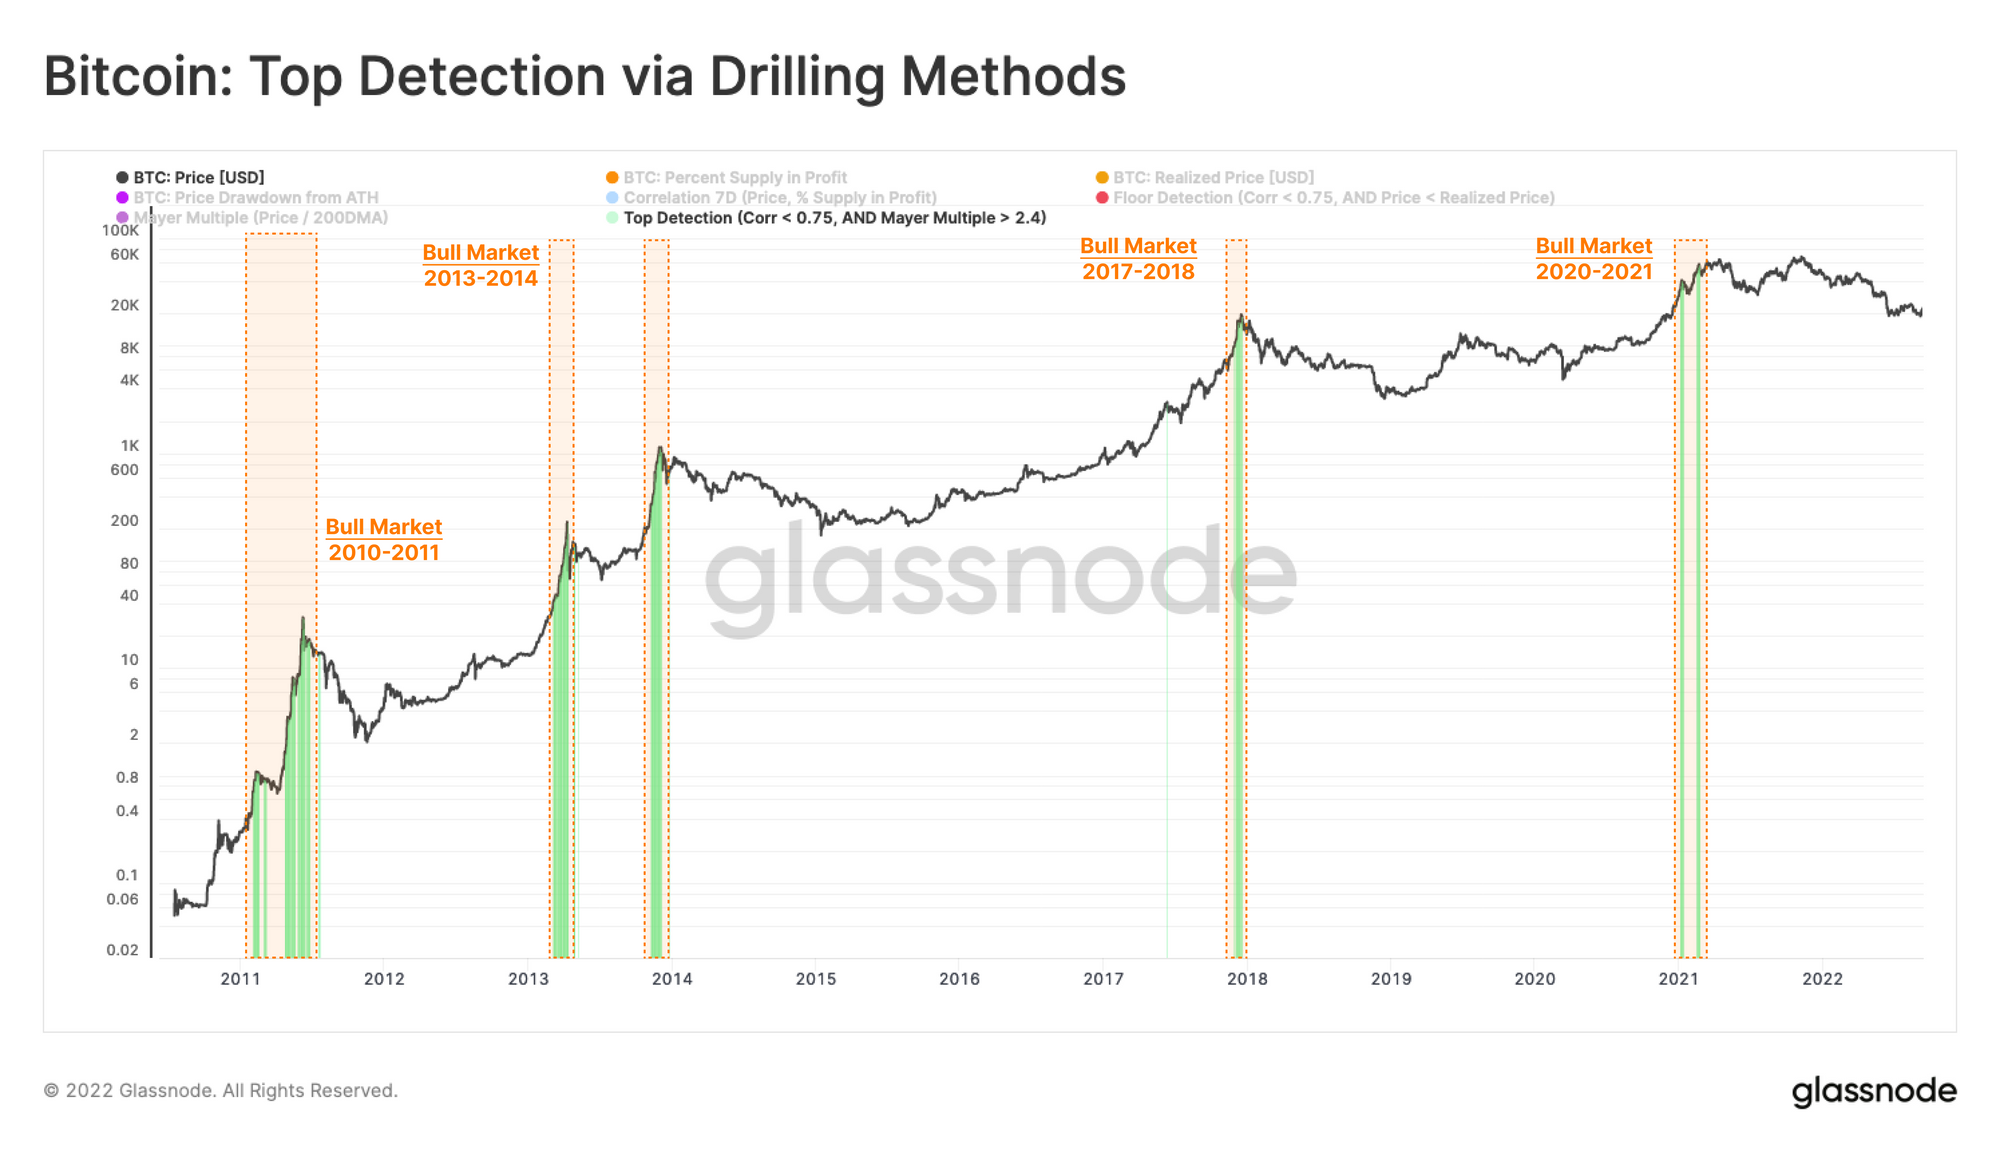
After applying this to Bitcoin’s market data for the past decade, the columns detected by the drilling method clearly overlap with the peaks (green columns) and troughs (red columns) of each cycle with high accuracy.
Put simply, the new technique provides an accurate gauge of market cycle extremes — with the potential to help traders better manage their risk.
What This Means for Bitcoin Price
As we have seen time and time again, Bitcoin (and most other cryptocurrencies) are highly cyclical assets — with their values forming a new absolute high and relative trough approximately every three to four years.
This is confirmed by Glassnode’s drilling method, which correctly identified the peaks of the previous four bull markets.
 It also accurately identified the bottoms of the interdigitating bear markets seen between 2011-2012, 2014-2015, 2018-2019, and most recently 2021-2022.
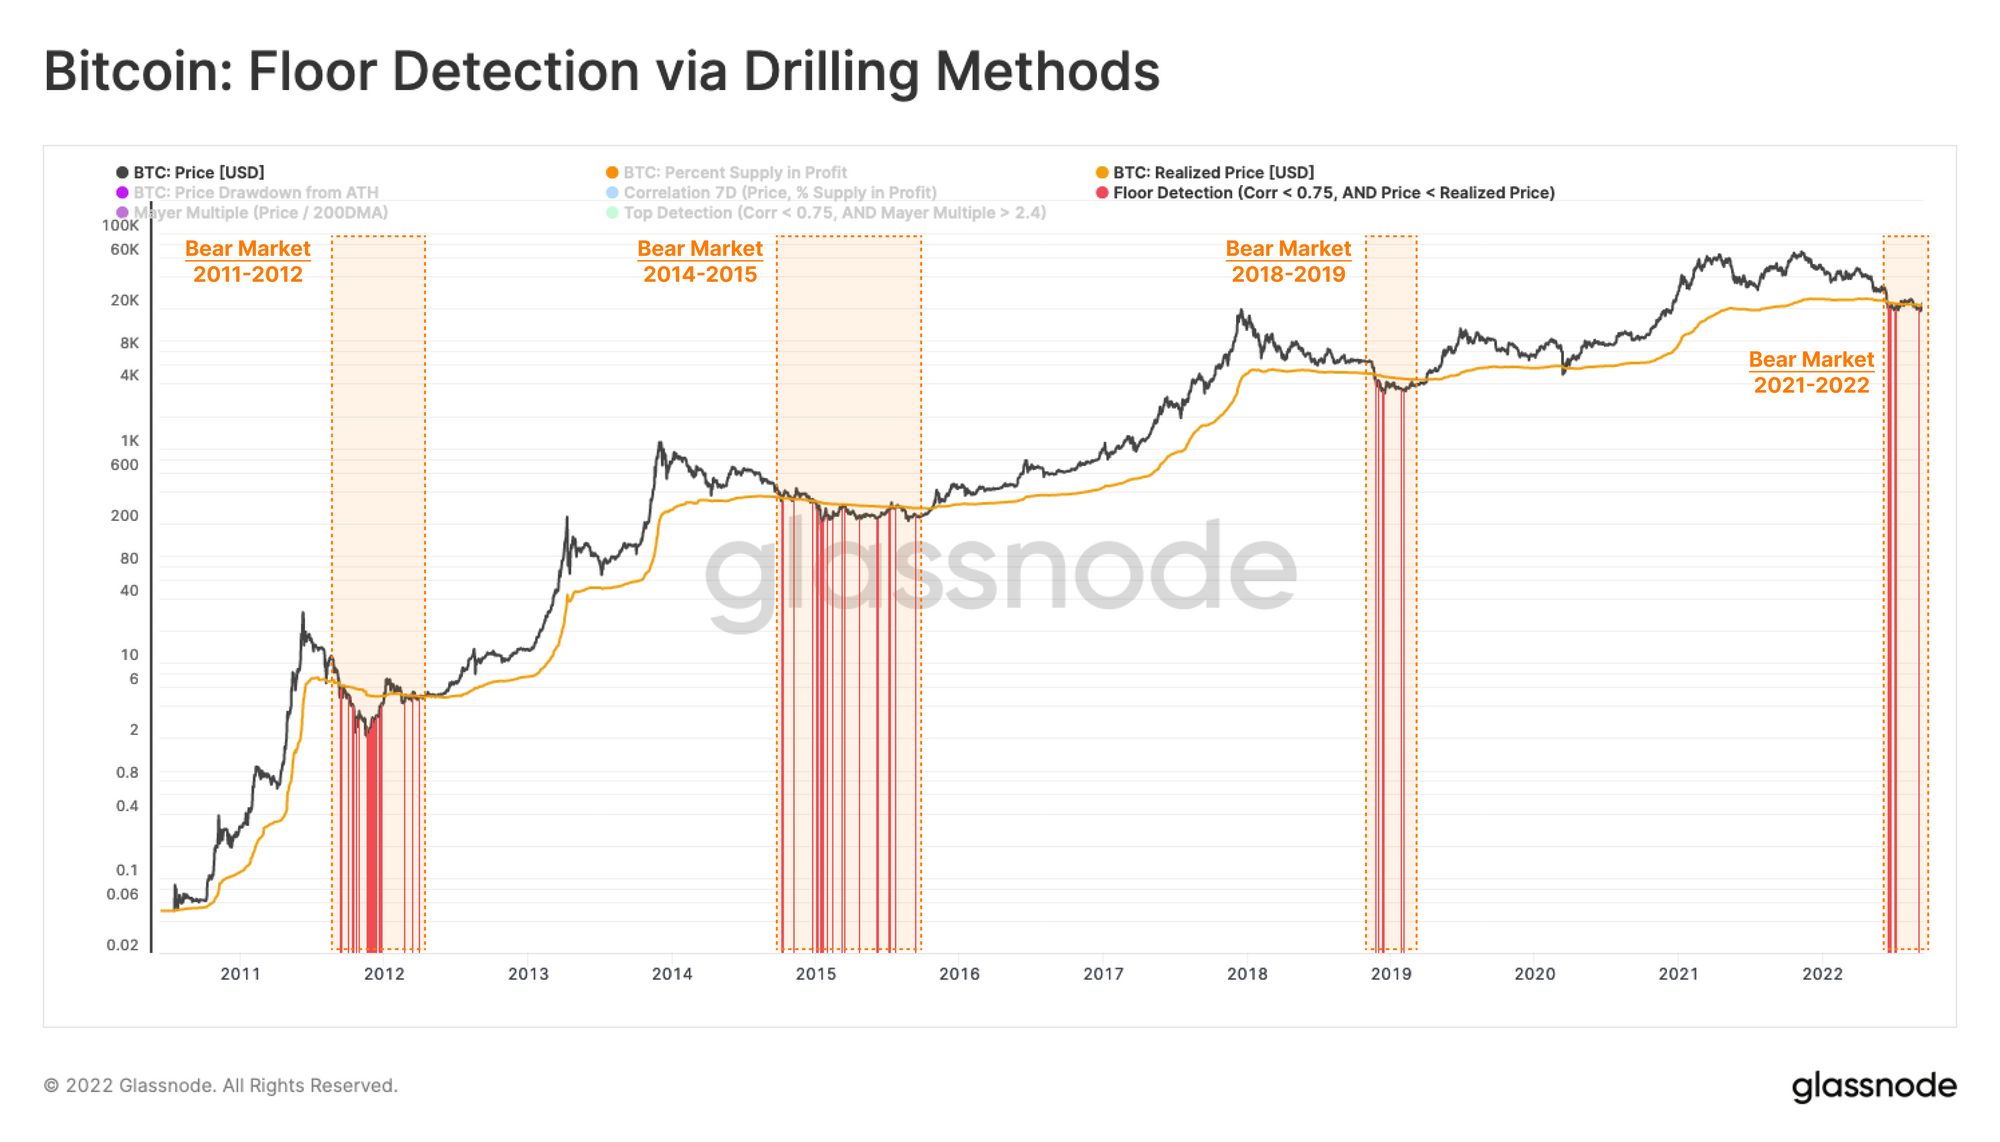 As shown in the above chart, the Bitcoin market is now squarely in bear territory. As shown in previous cycles, this period typically lasts 6-12 months.
But according to the new workbench pre-set, Bitcoin now looks to be at or close to the bottom of this cycle — since the bear market looks to have started in mid-June 2022. Some whales have already begun accumulating BTC.
Given that these conditions tend to last for 3-12 months, this would mean that the bottom could be found by June 2023, after which the market then typically begins to rally toward a new price high.
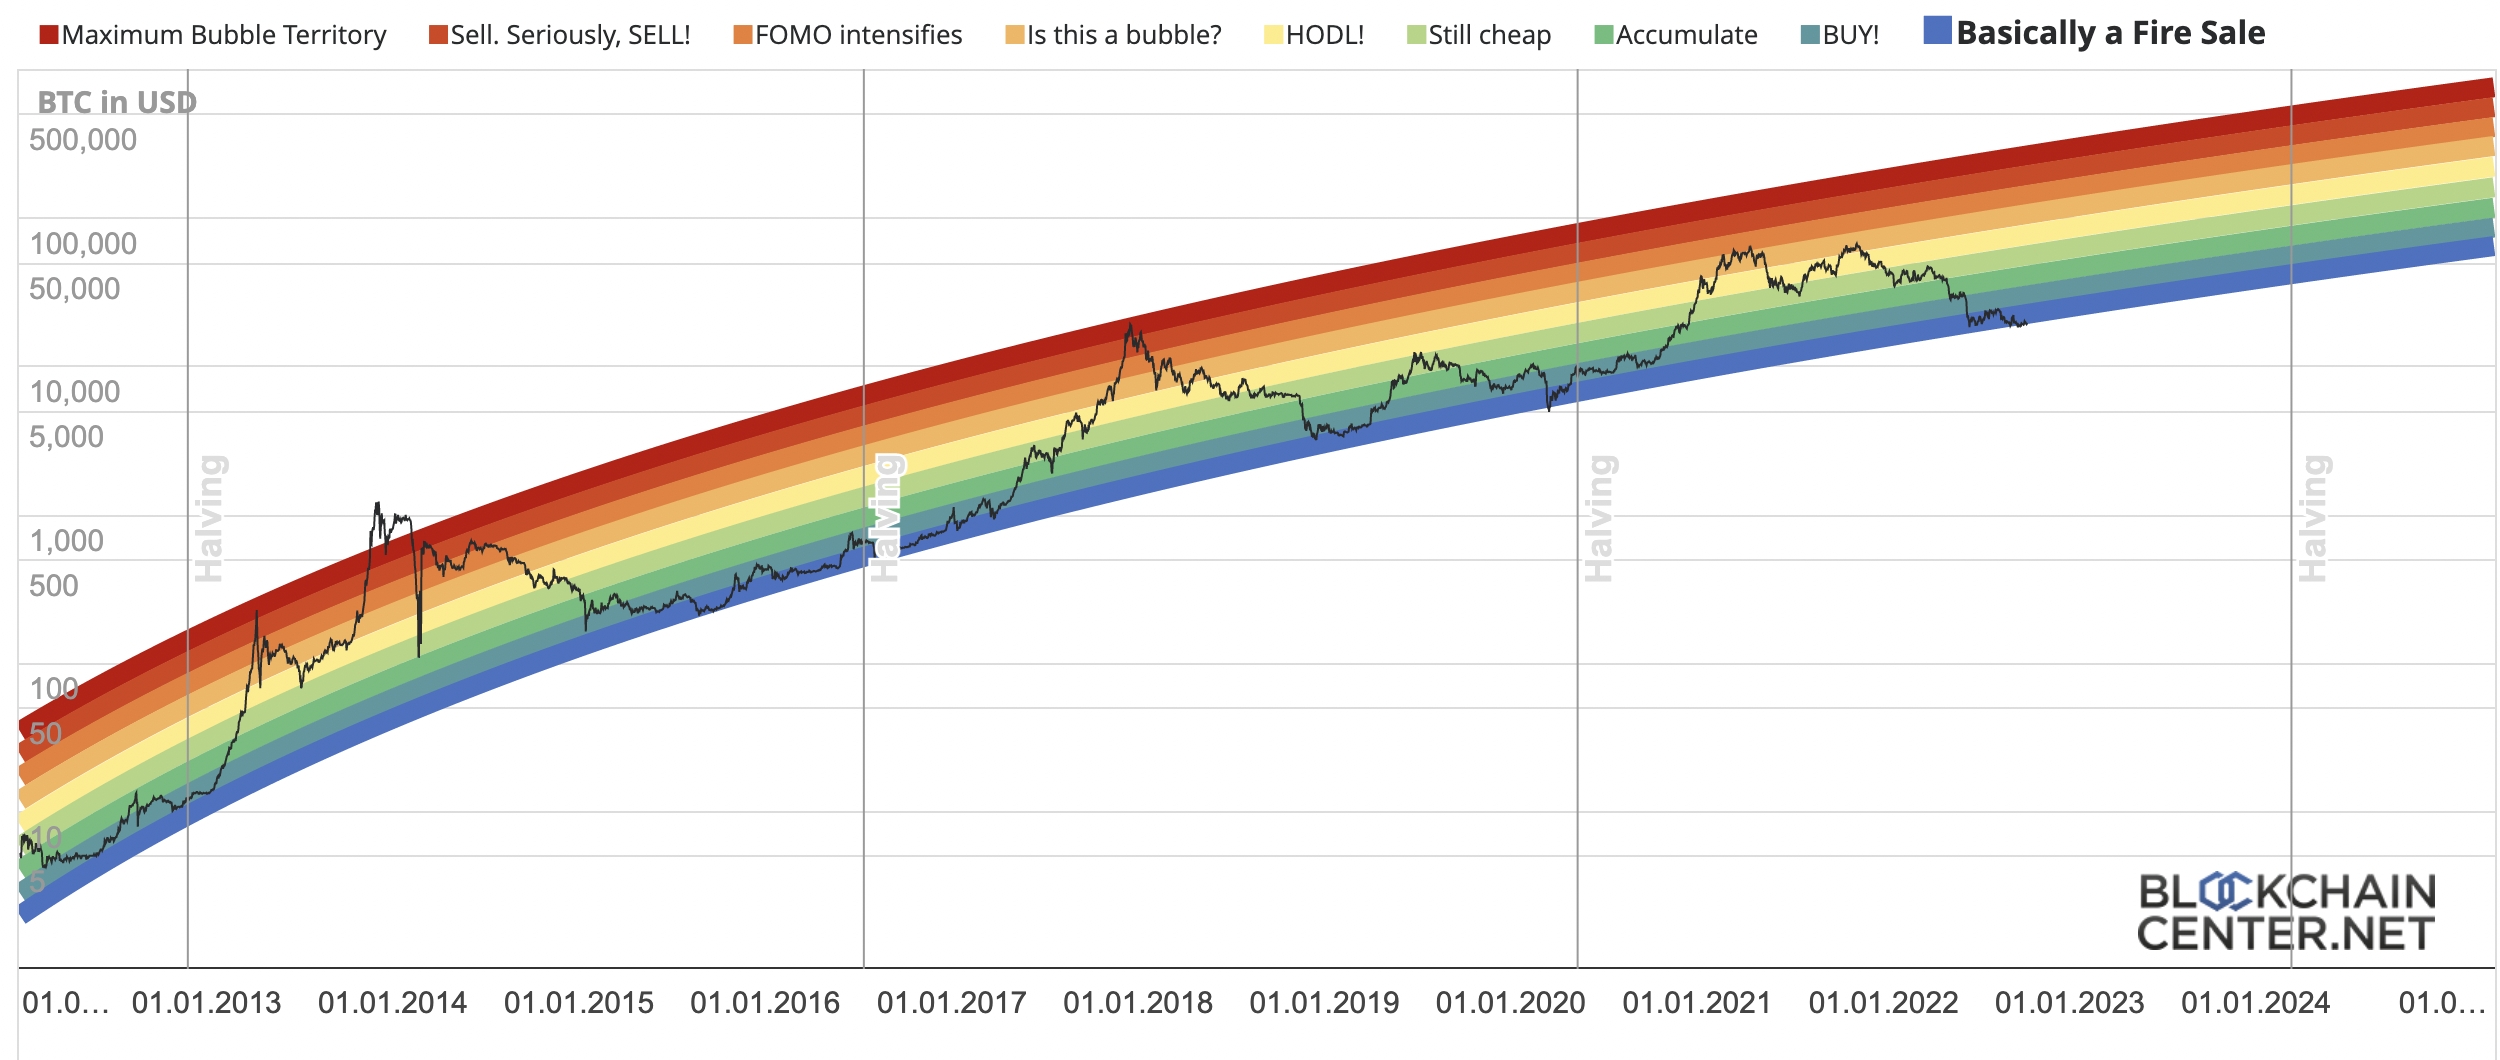
This estimation agrees with insights provided by several other bottom indicators, including the Bitcoin Rainbow Chart, weekly RSI, and crossover between the 50-week and 100-week moving averages — all of which indicate the bottom is either already in or close.
 Despite this pattern, it’s not an exact science, and it remains difficult to model when the bottom is likely to occur accurately.
Several methods have been proposed in recent years, including the popular stock-to-flow model (S2F) and Colin Talks Crypto Bitcoin Bull Run Index (CBBI). Still, the search continues for an even better predictor of the bottom.
Given the current adverse macroeconomic climate, with the FED repeatedly hiking interest rates, the DXY shattering records, a collapsing global stock market, the war in Ukraine, and many countries seeing their GDP shrink, there is little reason to believe that a bull run is near.
Nonetheless, the Bitcoin price is well-known to trade horizontally for potentially months on end before a new bullish wave begins. Glassnode’s new indicator posits that this will occur sooner rather than later.
- Mark Zuckerberg Meta AI Predicts Gold and Silver Price Will Skyrocket by End of 2026
- Elon Musk Grok AI Predicts XRP Will Explode by End of 2026
- Sam Altman ChatGPT AI Predicts Bitcoin Price Will Shock Everyone by End Of 2026
- Standard Chartered Holds $500K BTC Call as Trump Cites China Risk
- XRP Price Prediction: Can XRP Crack $1.20 Before Clarity Act?
2M+
250+
8
70


- Mark Zuckerberg Meta AI Predicts Gold and Silver Price Will Skyrocket by End of 2026
- Elon Musk Grok AI Predicts XRP Will Explode by End of 2026
- Sam Altman ChatGPT AI Predicts Bitcoin Price Will Shock Everyone by End Of 2026
- Standard Chartered Holds $500K BTC Call as Trump Cites China Risk
- XRP Price Prediction: Can XRP Crack $1.20 Before Clarity Act?
More Articles

