
Bitcoin Price and Ethereum Trade Sideways, Huobi Token Storms 58%


The leading cryptocurrency, Bitcoin, failed to break above the $16,800 level on November 27 and began to fall toward the 38.2% Fibonacci retracement level.
Similarly, the second most valuable cryptocurrency, Ethereum, has followed Bitcoin’s lead and is trading bearishly above $1,200.
Crypto Market Cap Update
Major cryptocurrencies were trading lower early on November 27 as the global crypto market cap fell by 0.16% to $840.32 billion on the previous day.
Over the last 24 hours, overall crypto market volume fell 10% to $33 billion. DeFi’s total 24-hour volume is currently $2.74B, accounting for 8% of the crypto market.
The overall volume of all stablecoins is now $31.69 billion, accounting for 93.28% of the total 24-hour volume of the crypto market.
Let’s take a look at the top 24-hour altcoin gainers and losers.
Top Altcoin Gainers and Losers
Apecoin (APE), UNUS SED LEO (LEO), and Huobi Token (HT) are three of the top 100 coins that have gained value in the last 24 hours. The APE price has soared by more than 15% to $2.75, the LEO price has grown by more than 8% to $4, and the HT price has increased by nearly 6.5%.
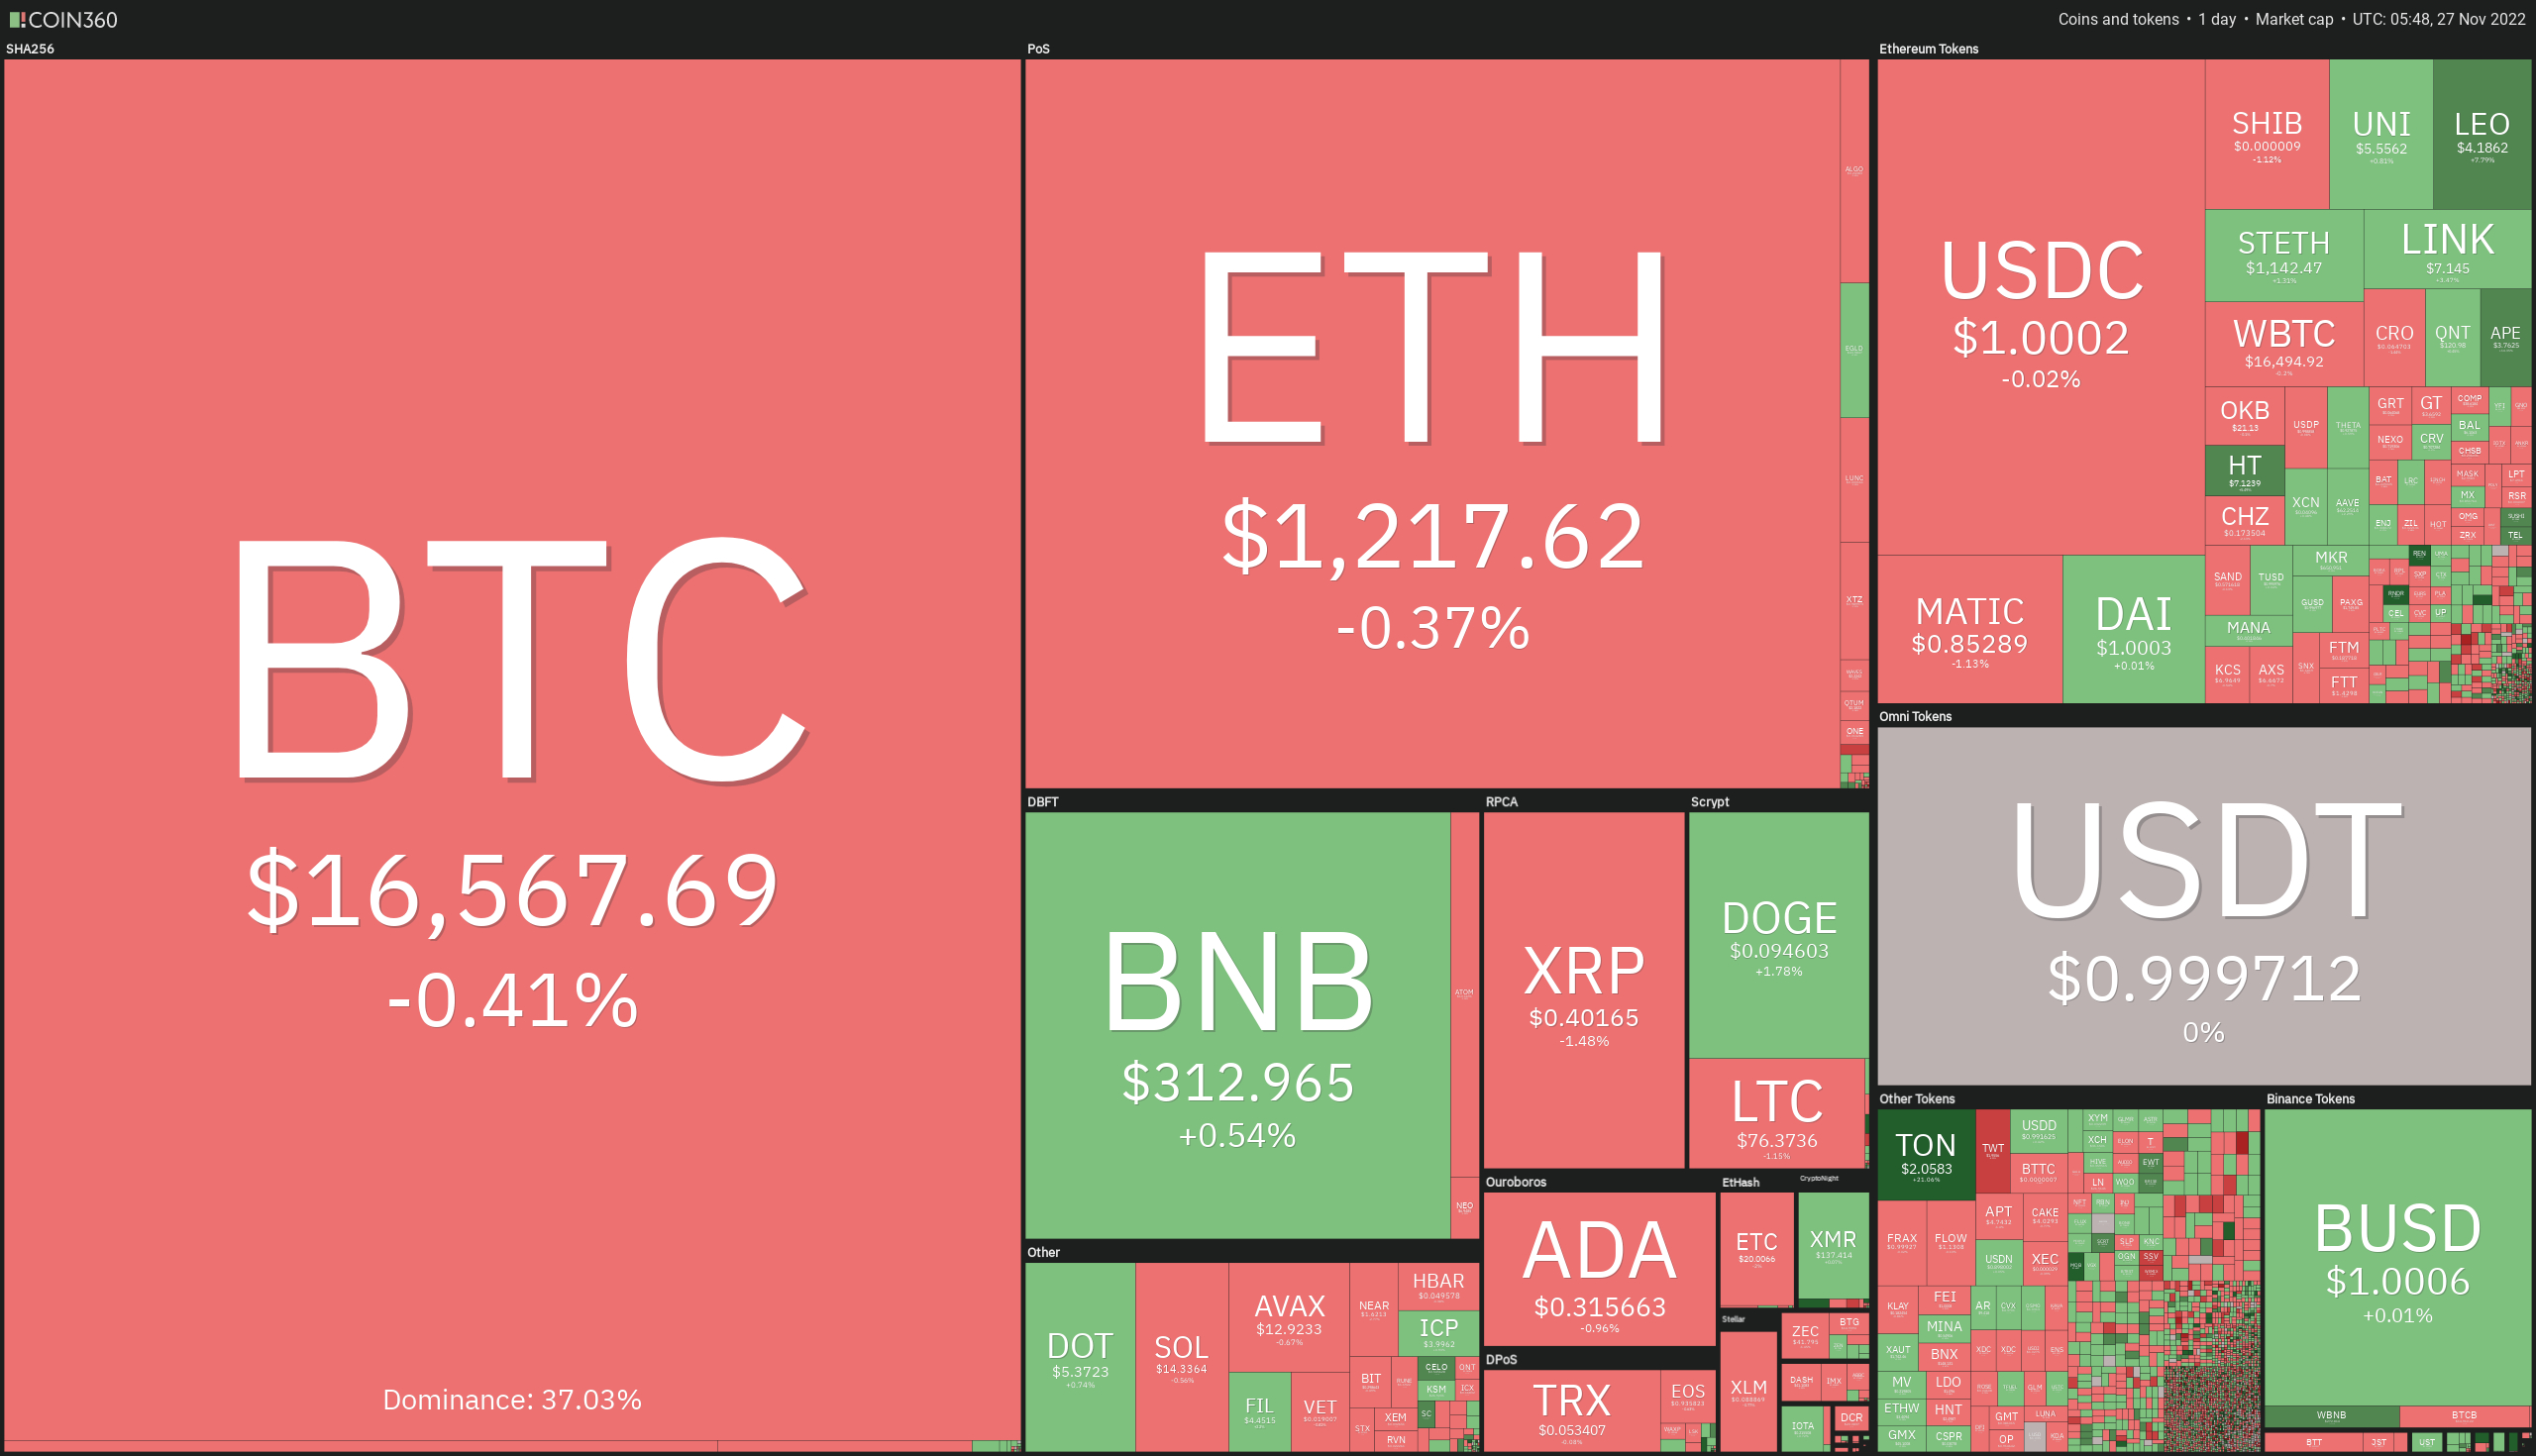
Trust Wallet Token (TWT), BinaryX (BNX), and Synthetix (SNX) are three of the top 100 coins that have lost value in the last 24 hours, where TWT has lost over 8% to trade at $1.95, BNX is down 4% to trade at $148. At the same time, SNX’s price is down over 4% to trade at $1.68.
Ava Labs President Says One Crypto Firm Threatens Markets More Than FTX
Ava Labs’ president John Wu has recently stated that the collapse of a major digital asset lender would have more severe consequences for the crypto markets than the recent FTX debacle.
According to a recent interview conducted by Bloomberg, Ava Labs president John Wu cites the potential collapse of Genesis Global Capital as a greater threat to the digital asset markets than the failure of the FTX exchange.
“In my seat, I actually think Genesis is a bigger issue in terms of the capital markets of crypto than even FTX.
Genesis was the largest lender out there. They’ve done unsecure as well as collateralized lending. There’s really no one else doing that lending. Without them in the markets, all the people in the value chain, all the companies like market makers who need to borrow in order to do market making, you’re going to see liquidity get sapped out of the markets, spreads widen, no investors want to come in and you have a vicious cycle.
So, Genesis is a very important part of the crypto capital markets.”
Earlier in November, news surfaced that Genesis had temporarily blocked withdrawals due to liquidity issues following the collapse of FTX and crypto hedge fund Three Arrows Capital (3AC).
Another report from last week indicated that before Genesis froze withdrawals, it had asked investors for a $1 billion loan to cover an unexpected expense.
Binance releases its Proof-of-Reserve
After the FTX went down, Binance CEO Changpeng Zhao (CZ) issued a rallying cry, demanding that other exchanges show their financial strength. Binance released its Proof-of-Reserve (PoR) mechanism on November 25 after most CEXs adopted his recommendations.
The publication of a Merkle Tree Proof-of-Funds came two weeks after the exchange initially promised to do so. There has been pushback to Binance’s most recent move.
Jesse Powell, CEO, and co-founder of Kraken, stated that Binance lacked a full PoR. The entire Proof of Repossession (PoR) requires, as he tweeted, the sum of clients’ liabilities, cryptographic proof that each account was included in the sum, and signatures validating the custodian’s power over the wallets.
Other participants, Powell said, have been remiss in noting accounts with negative balances. Kraken’s Proof-of-Reserve is useful for comparing the company’s holdings to its debts.
CZ responded by emphasizing that the official statement’s reference to a third-party audit will suffice to allay Powell’s worries about the PoR. Binance’s latest move, if carried out correctly, has the potential to restore faith in centralized exchanges and cryptocurrency.
Despite these efforts, Bitcoin and other leading currencies are declining. Let’s look at Bitcoin price prediction.
Bitcoin Price
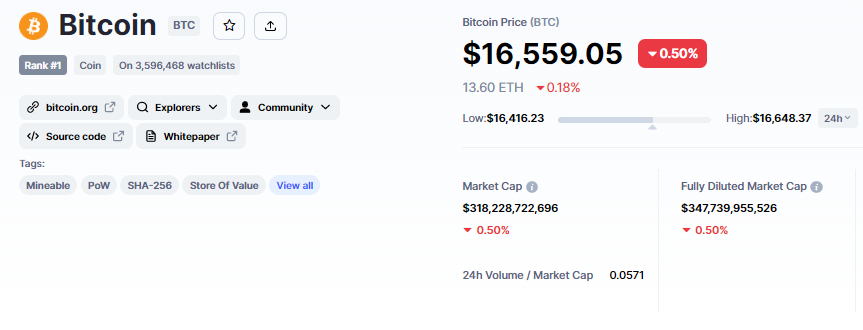
The current Bitcoin price is $16,558 and the 24-hour trading volume is $18 billion. During the last 24 hours, the BTC/USD pair has dropped nearly 0.50%, while CoinMarketCap currently ranks first with a live market cap of $318 billion, down from $348 billion yesterday. It has a total supply of 21,000,000 BTC coins and a circulating supply of 19,217,818 BTC coins.
On Sunday, the BTC/USD is trading choppy, with a narrow trading range of $16,300 to $16,800. In order to forecast future trends, Bitcoin must first break through the previously mentioned trading range.
In the 4-hour timeframe, the BTC/USD pair is currently holding above the 23.6% Fibonacci retracement level of $16,400, and a breakout of this level can determine the next trading range.
If Bitcoin breaks below the 23.6% Fib level, it will be exposed to the 38.2% Fib level of $16,275 and the 61.8% Fib level of $15,900.
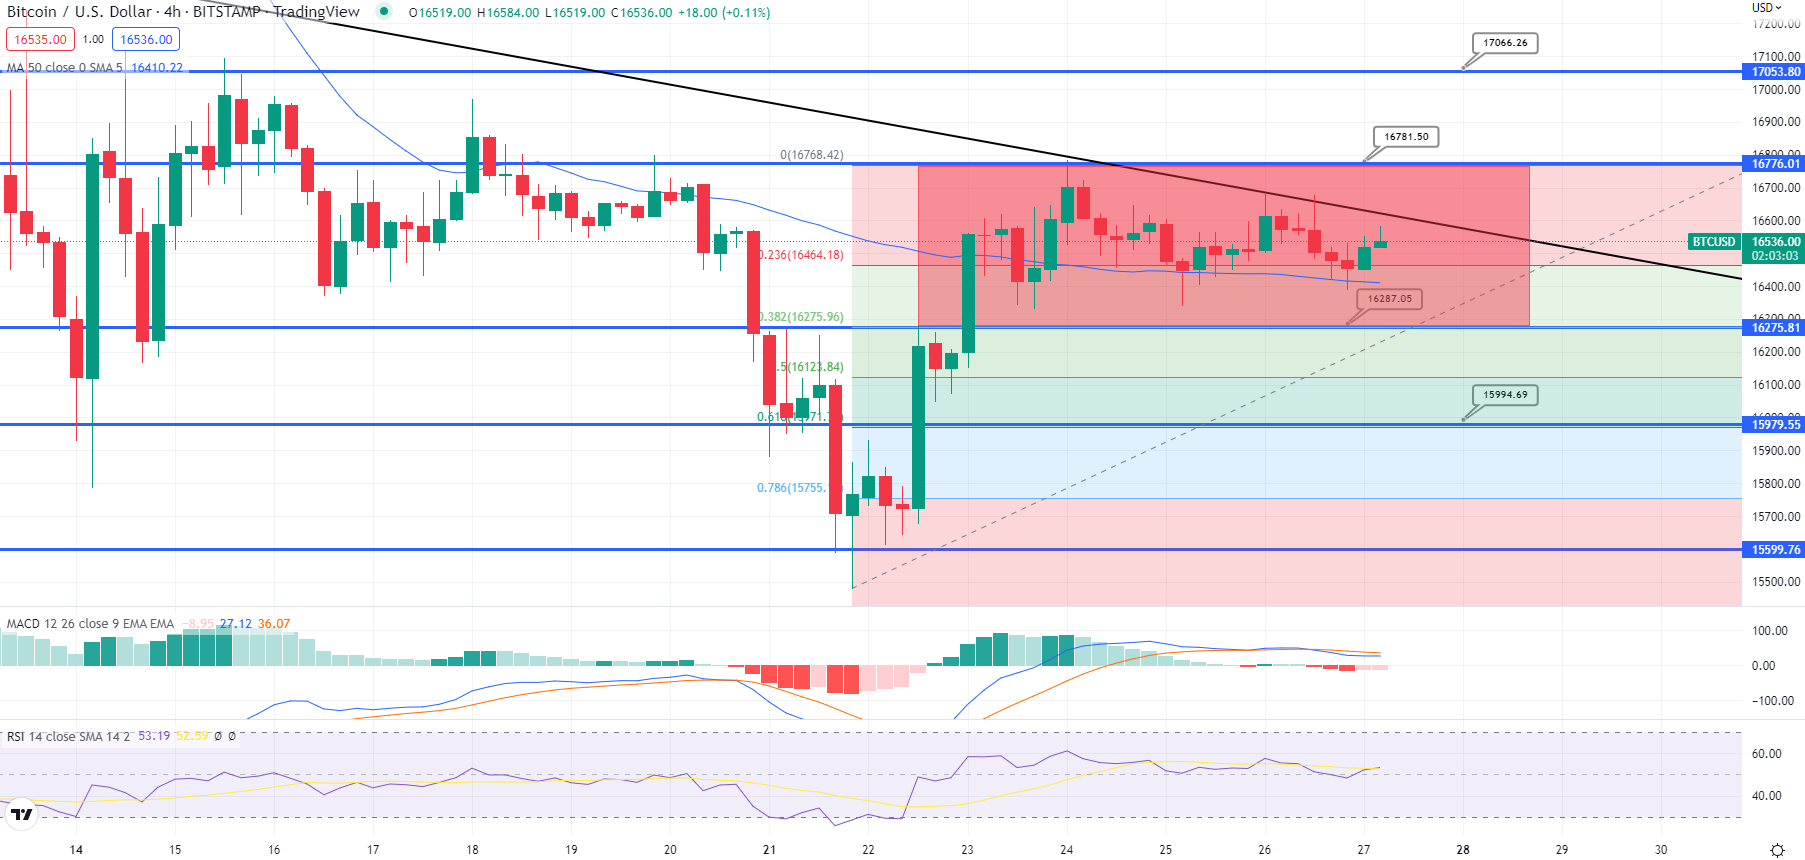
Leading technical indicators, such as the RSI and MACD, are oscillating between buying and selling ranges, indicating investor indecision. The 50-day moving average, on the other hand, is keeping the BTC supported near $16,450, indicating a high likelihood of an uptrend continuation.
If buyers enter the market, a bullish breakout of the $16,785 level could send BTC to $17,000 in a matter of days.
Ethereum Price
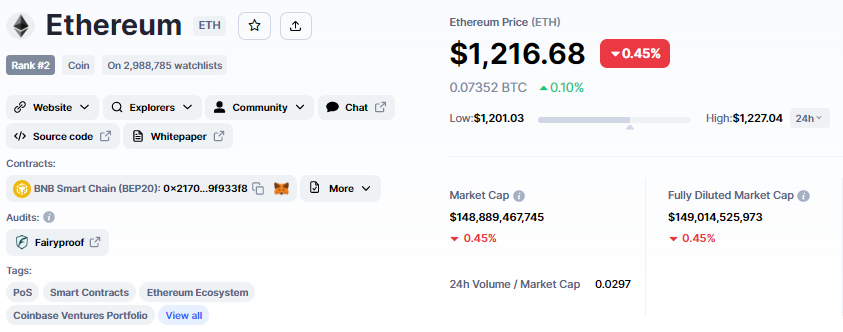
The current price of Ethereum is $1,216, with a 24-hour trading volume of $4 billion. In the last 24 hours, Ethereum has lost nearly 0.50%. CoinMarketCap currently ranks #2, with a live market cap of $148 billion. It has a circulating supply of 122,373,866 ETH coins.
Ethereum is trading slightly bullishly, having formed an upward channel that’s supporting it around $1,200 (psychological level). On the 4-hour chart, Ethereum is forming “higher highs and higher lows, ” signaling an increased bullish bias.
The 50-day moving average line at $1,175 is suggesting a bullish trend, while the RSI and MACD indicators are also holding in a buying zone.
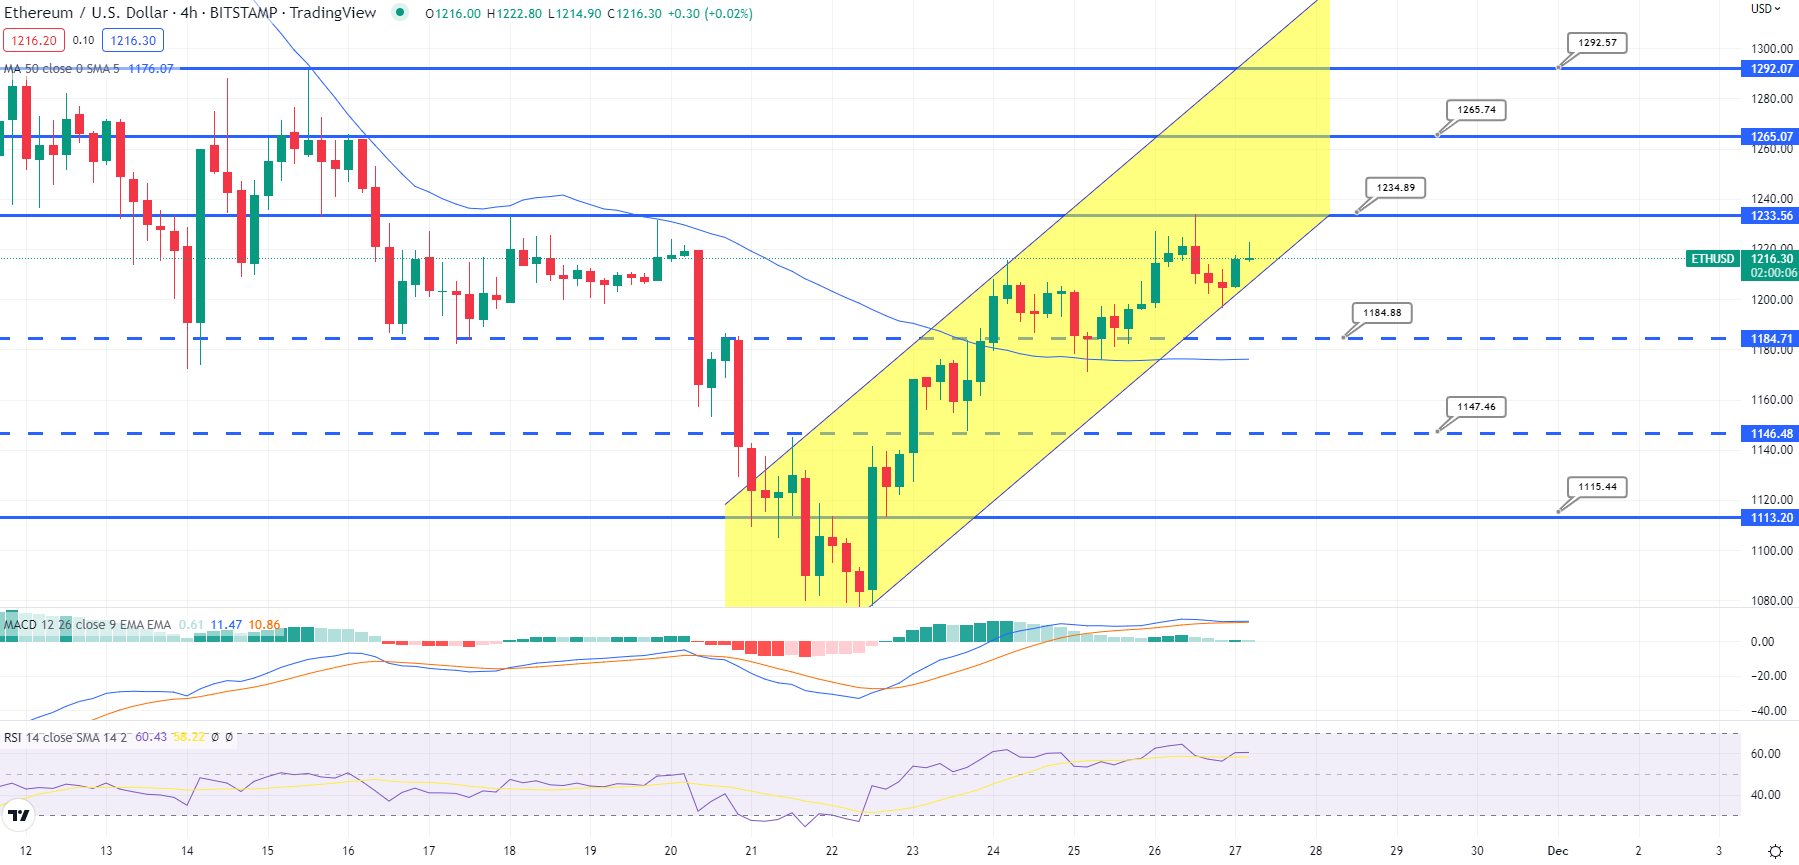
On the upside, the major resistance level for ETH remains $1,235, and a break above this could take it to the $1,250 level. On the downside, a bearish breakout of an upward channel at $1,200 could spark selling until the $1,185 and $1,145 levels are reached.
Huobi Token Storms 58%
Huobi Token is on the rise, having surged over 58% in the last seven days and over 4% in the last 24 hours. CoinMarketCap currently ranks #39, with a live market cap of $ 1 billion. There are 153,357,694 HT coins in circulation, with a maximum supply of 500,000,000 HT coins.
On the technical front, the HT/USD pair has risen above $7 and reached the 61.8% Fibonacci retracement level. At the same time, HT has crossed above the 50-day simple moving average line at $6.75, indicating a strong bullish trend.
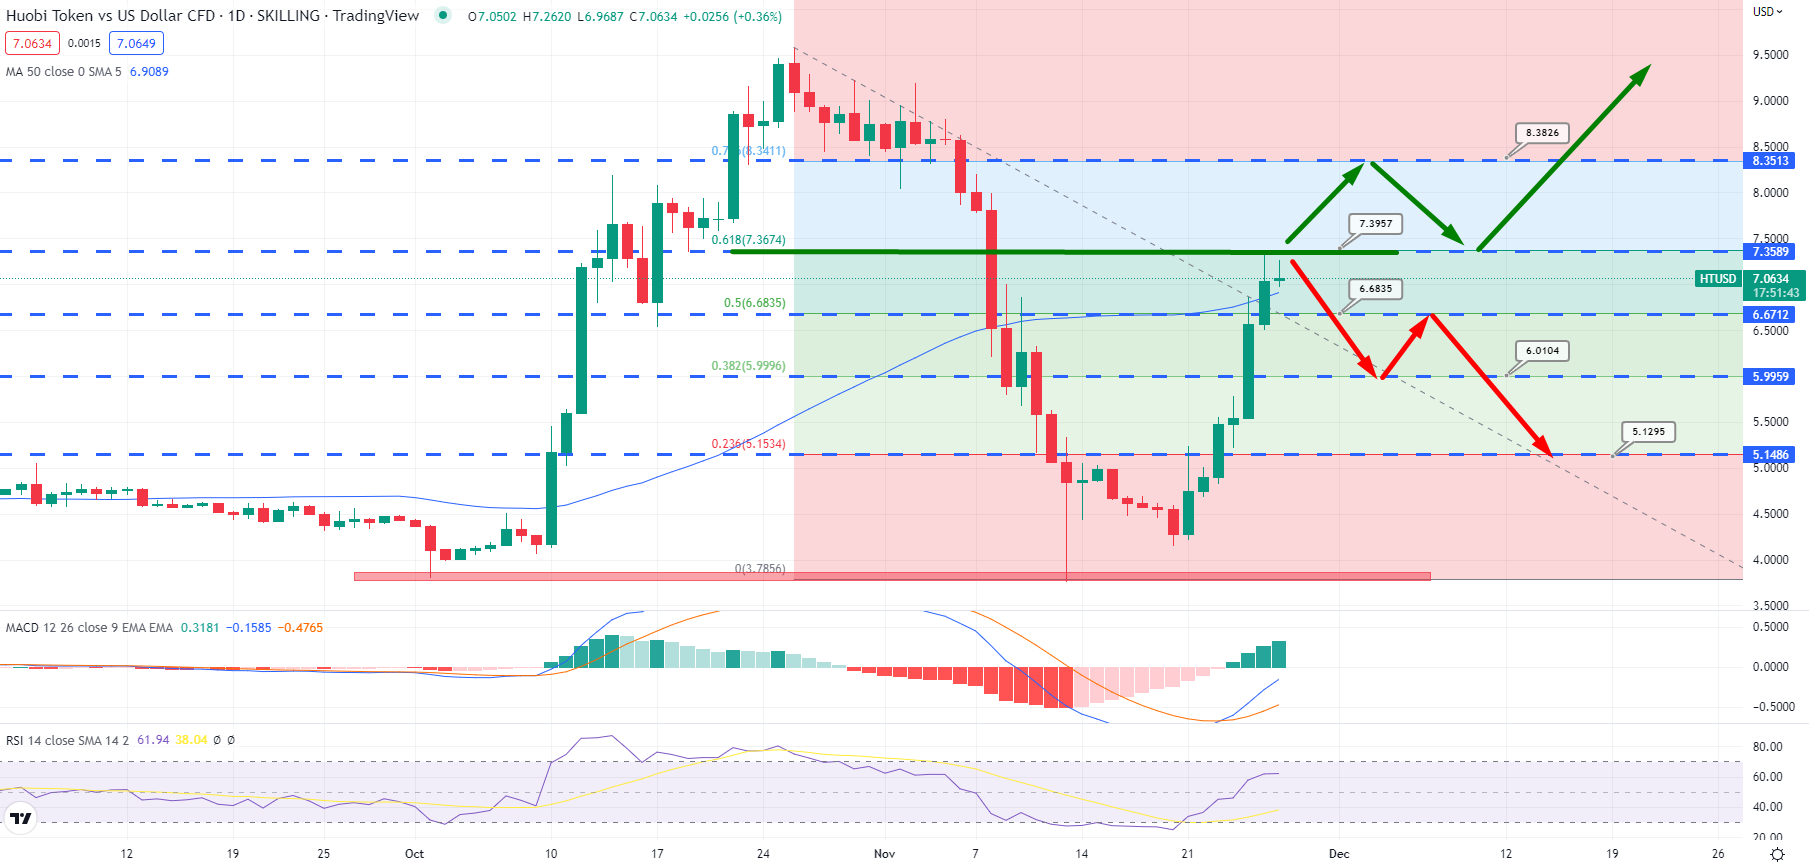

The RSI and MACD, on the other hand, have entered the overbought zone, which is not a good sign for the bulls. As a result, failure to break above the $7.40 resistance level may result in a bearish correction to the $6 or $5.15 levels.
Increased demand for HT, on the other hand, could cut through $7.40 resistance and expose price to $8.35 or $9.50 resistance levels. Let’s keep an eye on $7.40 because it’s a likely pivot point for HT.
Presale Cryptocurrency With Enormous Potential Gains
Dash 2 Trade (D2T)
Dash 2 Trade is an Ethereum-based trading intelligence platform that provides real-time analytics and social data to traders of all skill levels, allowing them to make better-informed decisions. The platform will go live in the first quarter of 2023, providing investors with information to help them make proactive trading decisions.
Dash 2 Trade, a platform for crypto trading intelligence and signals, has piqued investors’ interest after raising $7 million in just over a month. As a result, the D2T team has decided to call it quits at stage 4 and lower the hard cap target to $13.4 million.
Dash 2 Trade has also been a success, with two exchanges (LBank and BitMart) promising to list the D2T token once the presale concludes. 1 D2T is currently valued at 0.0513 USDT, but this will rise to $0.0533 in the final stage of the sale. D2T has so far raised over $7 million by selling more than 82% of its tokens.
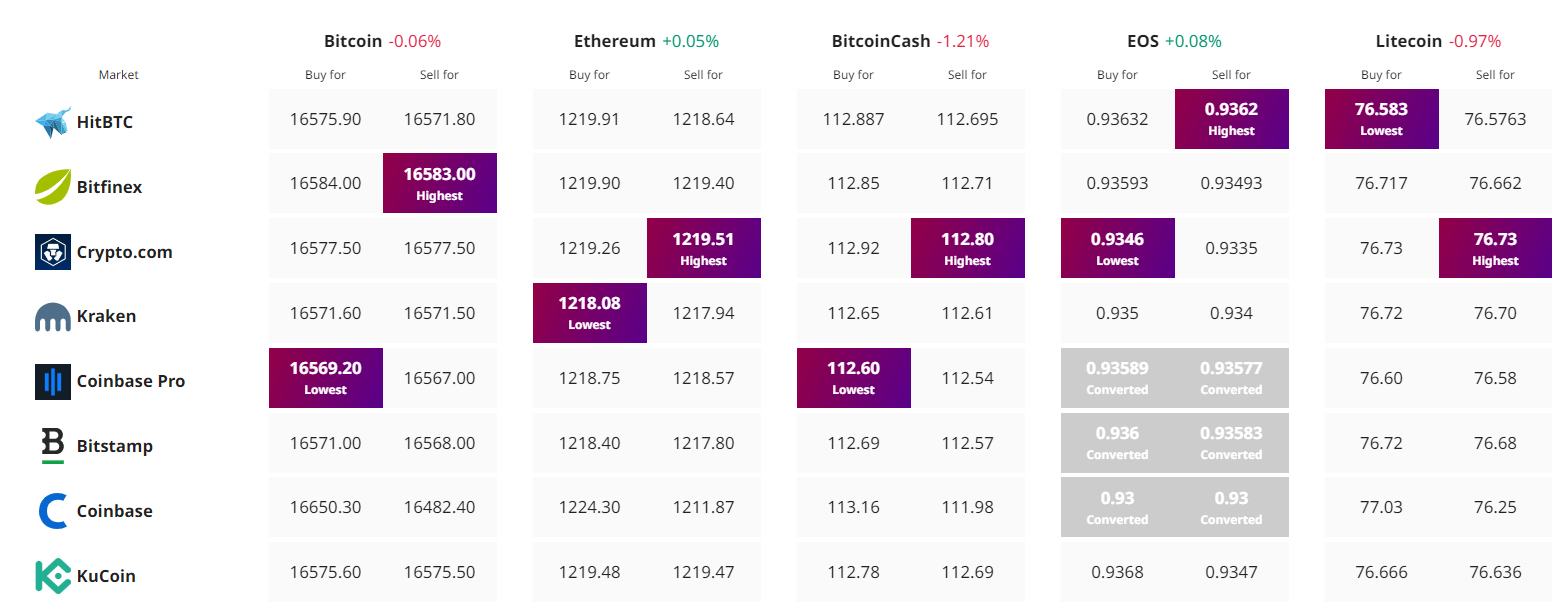
Find The Best Price to Buy/Sell Cryptocurrency
- Mark Zuckerberg Meta AI Predicts Gold and Silver Price Will Skyrocket by End of 2026
- Elon Musk Grok AI Predicts XRP Will Explode by End of 2026
- Sam Altman ChatGPT AI Predicts Bitcoin Price Will Shock Everyone by End Of 2026
- Standard Chartered Holds $500K BTC Call as Trump Cites China Risk
- XRP Price Prediction: Can XRP Crack $1.20 Before Clarity Act?
2M+
250+
8
70


- Mark Zuckerberg Meta AI Predicts Gold and Silver Price Will Skyrocket by End of 2026
- Elon Musk Grok AI Predicts XRP Will Explode by End of 2026
- Sam Altman ChatGPT AI Predicts Bitcoin Price Will Shock Everyone by End Of 2026
- Standard Chartered Holds $500K BTC Call as Trump Cites China Risk
- XRP Price Prediction: Can XRP Crack $1.20 Before Clarity Act?
More Articles


