
Bitcoin Ends First Half in Red, Can Second Half Bring Happiness?


Bitcoin price closed the first half of 2018 in deep red, down from well above USD 17,000 to USD 6,000. BTC/USD is showing a few positive signs, but it faces many challenges in Q3 2018. Ethereum and Ripple also struggled lately and remains at risk of mor
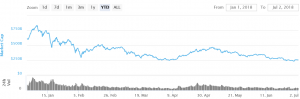
Bitcoin started 2018 with a spike above the USD 17,000 level. However, the price faced heavy selling interest due to regulation and exchange hack issues. As a result, a fresh round of bearish wave was initiated and BTC/USD tumbled by more than USD 10,000. In February 2018, the price formed a low around USD 6,000 and later corrected above USD 10,000.
The upside move was capped by USD 12,000 and the price resumed its downtrend. During the past few months, the price traded with a bearish bias below the USD 10,000 resistance level. On the positive, there was no substantial decline below the USD 6,000 support area. Recently, the price traded towards the USD 5,650 level, but jumped back above USD 6,000.
Overall, it seems like the USD 5,500 – USD 6,000 zone is a crucial support. As long as the price is above the stated support zone, it could make an attempt to recover during the coming months. A few significant resistances on the way to USD 10,000 are at USD 6,500, USD 7,500, USD 8,000 and USD 9,200. Finally, a convincing break above USD 10,000 may perhaps start a solid upward wave towards USD 12,000 and USD 15,000.
On the flip side, if bitcoin fails to stay above the USD 5,500 – USD 6,000 support zone, then there could be a lot of pressure on buyers. The next supports are at USD 5,000 and USD 4,200.
Meanwhile, last week, Mohamed El-Erian, chief economic advisor at Allianz, an insurance giant, told CNBC that bitcoin would be a buy if the price falls below USD 5,000. El-Erian sees bitcoin emerging as more of a tradeable commodity than a currency, but doesn’t expect it will get all the way back to USD 20,000.
Ethereum Price Outlook
Ethereum followed bitcoin and fell from well above USD 1,350 in January 2018 to USD 370 in April 2018. Later, ETH/USD corrected above USD 500 and tested the USD 800 level where it faced a crucial resistance.
It declined once again and is currently trading well below the USD 500 pivot level. However, the USD 400 support zone is holding declines in Ethereum and it may perhaps continue to act as a strong support.
To start a decent recovery, ETH/USD must settle above the USD 500 pivot level. Above this, the next hurdles for buyers are at USD 650 and 800. The final barrier for a larger upward wave is at USD 1,000. On the other hand, a break below the USD 400 support could push the price toward the 2018 low near USD 370. Below this last, there is an open space up to USD 250.
Bitcoin Cash, Ripple and Other Altcoins Market
Bitcoin cash and ripple were under heavy selling pressure during the first half of 2018. BCH/USD declined from well above USD 2,500 to USD 650 which acted as a strong support. It is currently consolidating losses and is preparing for the next move. Resistances are at USD 800, USD 1,000 and USD 1,250.
Ripple peaked around USD 3.70 in January 2018 and declined more than USD 3.00. It traded close to the USD 0.40 level and is currently in a bearish zone. Resistances are seen near USD 0.65, 0.75, 0.80 and 1.00. Above this last, XRP/USD could recover towards the USD 1.50 level.
To sum up, bitcoin and altcoins declined heavily during the first half of 2018. Prices are now stable and are following a consolidation pattern. Going forward, a successful break above key resistances in bitcoin could stage a decent comeback in the coming months. Key levels to watch out are USD 6,500, USD 7,500, USD 8,000 and USD 9,200 on the upside, and USD 6,000, USD 5,500 and USD 5,000 on the downside.
- Mark Zuckerberg Meta AI Predicts Gold and Silver Price Will Skyrocket by End of 2026
- Microsoft Copilot AI Predicts Insane XRP Price by End Of 2026
- Elon Musk Grok AI Predicts XRP Will Explode by End of 2026
- Sam Altman ChatGPT AI Predicts Bitcoin Price Will Shock Everyone by End Of 2026
- Standard Chartered Holds $500K BTC Call as Trump Cites China Risk
2M+
250+
8
70


- Mark Zuckerberg Meta AI Predicts Gold and Silver Price Will Skyrocket by End of 2026
- Microsoft Copilot AI Predicts Insane XRP Price by End Of 2026
- Elon Musk Grok AI Predicts XRP Will Explode by End of 2026
- Sam Altman ChatGPT AI Predicts Bitcoin Price Will Shock Everyone by End Of 2026
- Standard Chartered Holds $500K BTC Call as Trump Cites China Risk
More Articles


