
Biggest Crypto Gainers Today on DEXTools – PARROT, ANUBIS, SOJU


Bitcoin exchange inflows have reached one-month highs according to data from Glassnode, signaling increasing selling pressure as the price of Bitcoin has fallen below $26,000.
The one-day moving average of bitcoin’s exchange net flow reached $9.75 million on August 16, marking the highest level seen in the past month.
Glassnode also reported that the amount of bitcoin sent to exchanges recently hit a 4-month high of approximately 370 BTC.
Despite Bitcoin’s price dipping under $26,000, some cryptocurrencies are making gains. What are the biggest crypto gainers today on DEXTools?
📈 #Bitcoin $BTC Exchange Net Flow (1d MA) just reached a 4-month high of 369.461 BTC
— glassnode alerts (@glassnodealerts) September 1, 2023
Previous 4-month high of 355.407 BTC was observed on 28 July 2023
View metric:https://t.co/YUEyldv0jg pic.twitter.com/yxHGYeG3uH
The metric is designed to monitor the cumulative transfer of Bitcoin to and from wallets that belong to centralized exchanges.
A high positive figure indicates growing reserves on exchanges, which typically precedes periods of selling activity.
Bitcoin has fallen over 20% from highs of around $28,000 last week, erasing gains made following a court victory by Grayscale over the SEC regarding a bitcoin spot ETF.
The decline comes as the SEC postponed decisions on several bitcoin ETF applications that were anticipated on Friday, September 1.
According to analyst Ki Young Ju of CryptoQuant, bitcoin velocity recently hit a 3-year low, suggesting that long-term holders are inclined to sell at current levels. The Average Dormancy metric has also risen, meaning more older coins are being spent.
“Although the current price is below the 2021 all-time high, it’s evident that long-term bitcoin holders are capitalizing on the surge and changing hands,” said Ju.
“The market psychology is atrophied, the turnover rate has fallen, and the old hands are changing hands – it seems to be a difficult condition for a strong rise right now.”
Bitcoin is currently trading around $25,800, down over 60% from its all-time high of nearly $69,000 in November 2021.
Some analysts say further declines may occur if inflows to exchanges remain elevated.
With bitcoin exchange flows indicating selling pressure, some traders may want to rotate into altcoins with stronger technicals.
PARROT, ANUBIS, and SOJU are some of the biggest crypto gainers today on DEXTools, posting significant surges despite Bitcoin’s lackluster price performance.
PARROT Takes Flight: Soaring 1,490.71% – Will the Meme Coin Resurge?
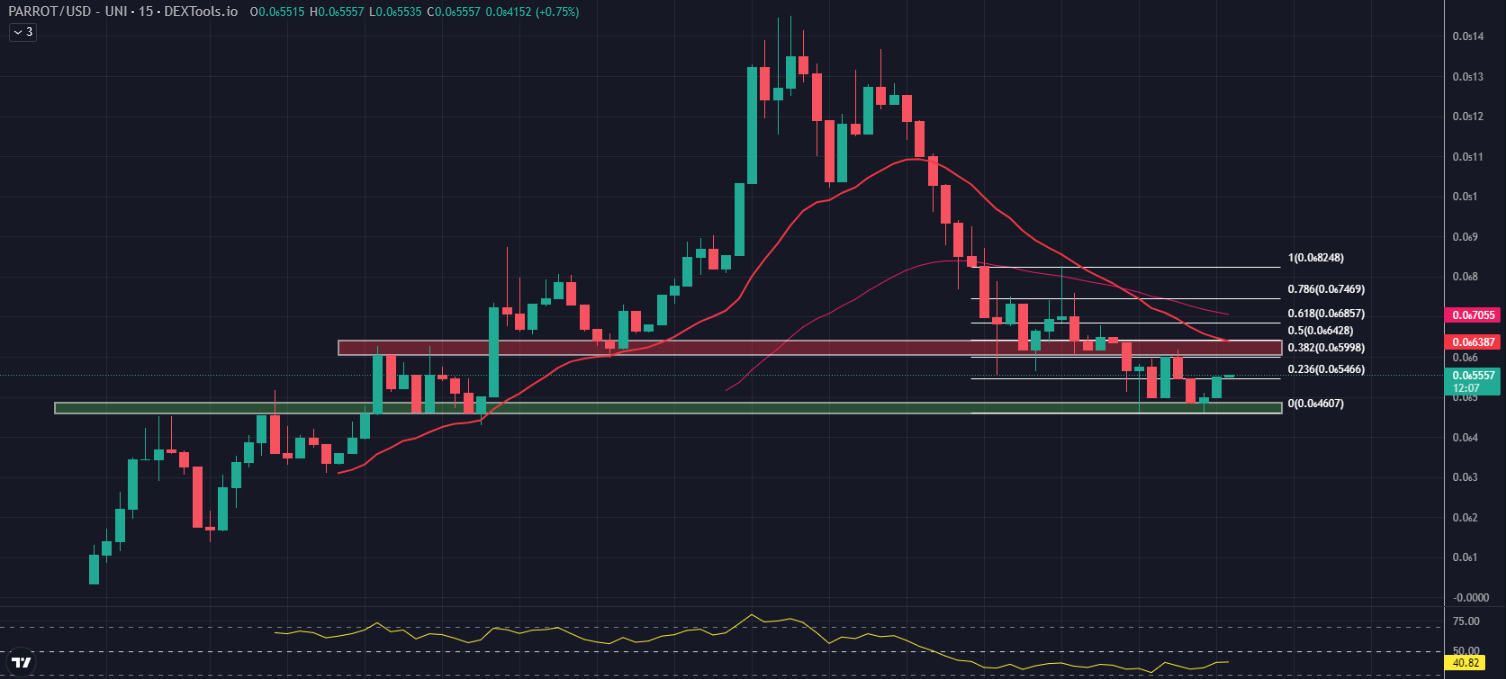
PARROT has emerged as one of the top gainers today, posting a rise of 1,490.71% as of writing.
After achieving a noteworthy high with an almost 4,200% increase, the meme coin has weathered some selling pressure, which has brought its price down to the current level of $0.0000005557.
As PARROT hovers around its earlier support zone, anticipation builds over a potential resurgence or an additional downturn.
Looking at the 15-minute technical indicators for PARROT, the 20 EMA currently stands at $0.0000007055, while the 50 EMA is at $0.0000006387.
Both these figures are above the current price, suggesting a bearish trend in the short term.
The RSI currently stands at 40.82. Typically, an RSI below 30 indicates oversold conditions, while an RSI above 70 signals overbought conditions.
The current RSI for PARROT sits in a neutral zone, suggesting a balance between buying and selling pressures.
The immediate support level, as indicated by the Fibonacci retracement level of 0.236, sits at $0.0000005466. If the price dips below this level, it could signal a continuation of the bearish trend.
On the upside, a horizontal resistance zone has been established between $0.0000006045 and $0.0000006398. This zone coincides with the Fib 0.382 level at $0.0000005998 and Fib 0.5 level at $0.0000006428 respectively.
If the price of PARROT can break through this resistance zone, it could trigger a bullish reversal, potentially leading to further gains.
Traders are advised to exercise vigilance and observe how PARROT behaves at these critical support and resistance levels.
Depending on whether it can maintain support or break through resistance, we could see a continuation of the current bearish trend or a potential bullish reversal.
ANUBIS: Bearish Trend Ahead? Key Indicators Suggest Caution
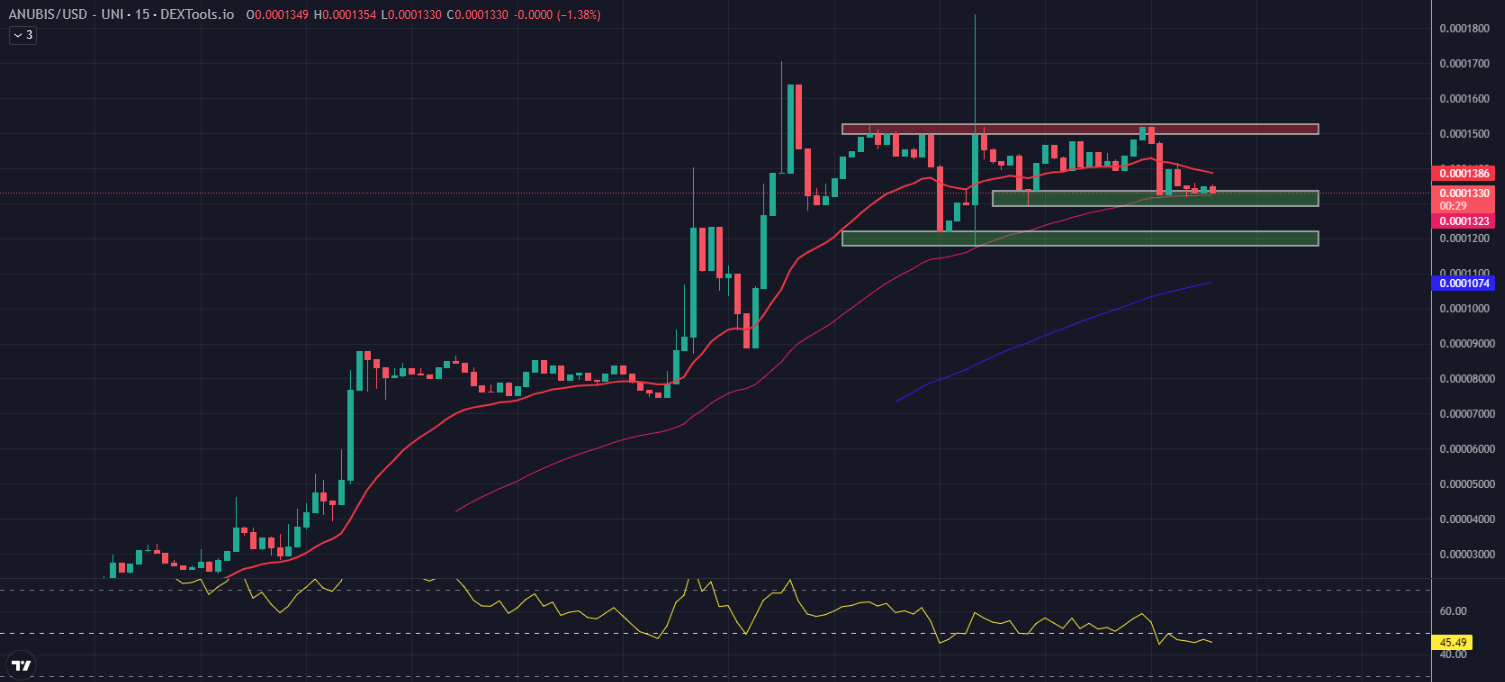
Following yesterday’s surge of nearly 1,300%, ANUBIS continues to chart an upward trajectory with an additional gain of 68.13% so far today.
However, since reaching an intraday high of $0.0001839, the cryptocurrency has seen a retracement to the current level of $0.0001330 and seems to be trading sideways in recent hours.
This has led to speculation among traders and market analysts of a potential bearish trend emerging.
The 15-minute technical indicators for ANUBIS show the 20 EMA at $0.0001386, slightly above the current price, and the 50 EMA at $0.0001323, just below the current price.
The 100 EMA is further down at $0.00010774, indicative of the cryptocurrency’s previous lower trading range.
This close trading of the 20 and 50 EMA might suggest a bearish crossover could be on the horizon, which would be a signal for traders to potentially brace for a downturn.
The RSI is presently at 45.49. This is well within the neutral zone (30-70), highlighting the market’s current indecision. In this context, the RSI indicates a balanced market, not tilting heavily towards either the bulls or the bears.
The immediate resistance for ANUBIS lies at the 15-minute 20 EMA of $0.0001386.
Following this, the next significant barrier for the bulls to overcome would be the horizontal resistance zone of $0.0001496 to $0.0001526. This area could pose a challenge, as it would require a strong buying momentum to break through.
On the flip side, immediate support can be found at the horizontal support levels of $0.0001291 to $0.0001336.
This range aligns closely with the 15-minute 50 EMA of $0.0001323, which could act as a safety net if the price faces downward pressure.
Despite the impressive gains in the last two days, the close proximity of the 20 and 50 EMAs, combined with the current sideways trading pattern and neutral RSI, point towards a potential bearish outlook for ANUBIS.
Traders are advised to keep a close eye on these key technical indicators and prepare for a possible shift in market sentiment.
SOJU: From 5,450% Surge to Consolidation – What’s Next?
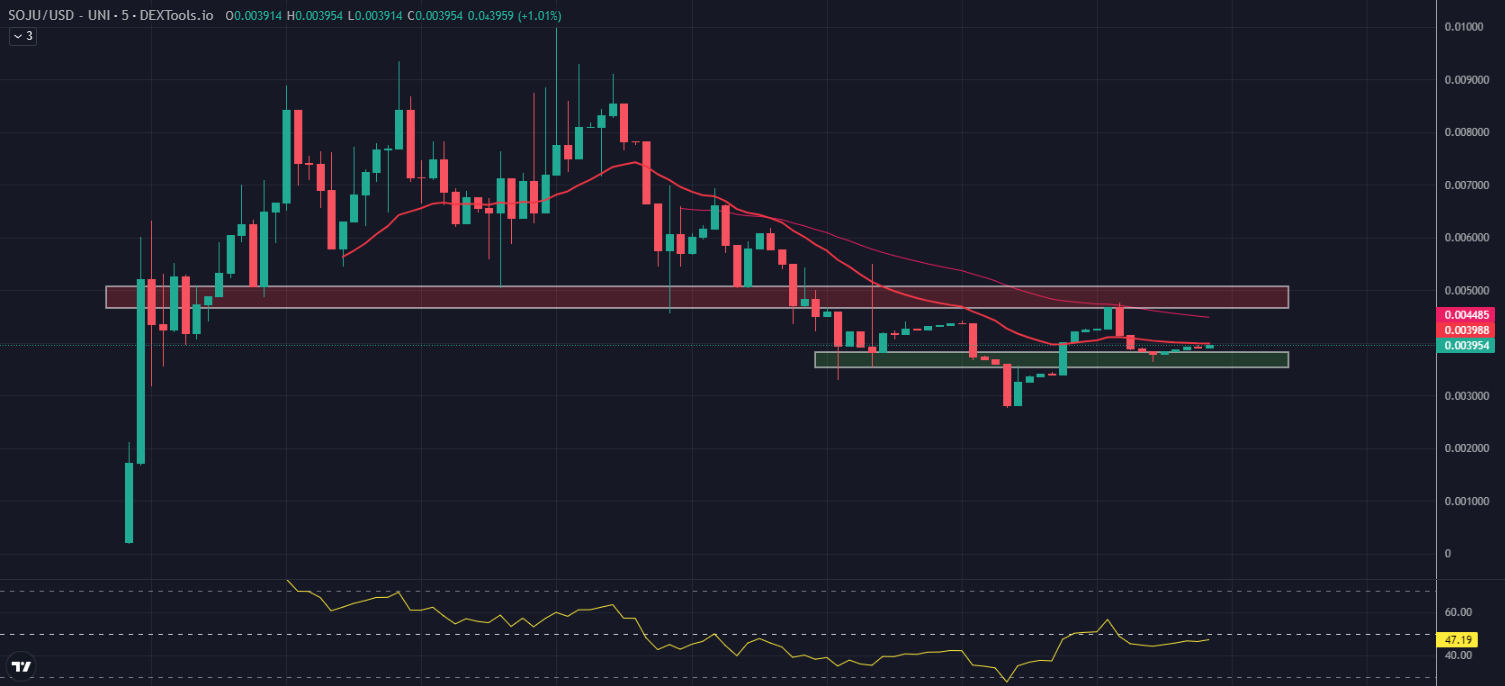
Today’s DEXTools crypto trading narrative has been dominated by SOJU, which is witnessing a surge of 1,674.24% so far today.
At one point during the frenzied trading, it catapulted by a massive 5,450%, notching an intraday high of $0.009952.
Following this dramatic surge and a period of retracement, SOJU is now consolidating above a horizontal support zone that lies between $0.003532 to $0.003829.
The 5-minute chart offers insightful details into SOJU’s price action. The 20 EMA currently lies at $0.003988, slightly above the current price.
Meanwhile, the 50 EMA stands at a slightly higher level of $0.004485. These EMAs are considered crucial indicators of short-term market sentiment, and their positioning suggests a mild bearish bias, given that the current price is below both these levels.
However, traders should note that the Relative Strength Index (RSI), currently at 47.19, indicates a neutral market condition. This implies that the SOJU’s price has room to maneuver in either direction.
The immediate resistance for SOJU lies at the 20 and 50 EMAs of $0.003988 and $0.004485, respectively.
A break above these EMAs could see the price test the next horizontal resistance zone, between $0.004665 and $0.005073.
On the flip side, should SOJU’s price dip, the immediate support level to watch is the aforementioned horizontal zone between $0.003532 and $0.003829.
A successful hold at this level could provide a solid base for SOJU to stage another rally. Traders are advised to closely monitor SOJU’s price movements in relation to the EMAs and the RSI.
A potential bullish scenario could be a break above the 20 and 50-period EMAs, which could pave the way for further upside. Conversely, a drop below the current support zone could signal a temporary pullback.
Other Cryptocurrencies to Consider
For those engaged in cryptocurrency investments and looking to diversify their holdings, it might be advantageous to participate in presales of promising new cryptocurrency ventures.
This method allows investors to gain early access to tokens at significantly reduced prices compared to the proposed initial public offering price.
Although it carries a certain level of risk, investing in presales of projects that eventually prosper post-launch can yield significant profits.
Numerous presale tokens are supported by proficient founding teams and showcase pioneering ideas that could radically change the blockchain industry.
Spotting these potential game-changing projects early on and obtaining tokens during the presale phase offers considerable growth potential if the venture thrives post-launch.
However, the risks are just as substantial. If the project teams fail to execute their strategies, presale investors could face financial losses.
Despite everything, the gains could be extraordinary if a presale investment turns out successful.
The market analysts at Cryptonews.com utilize their sector expertise and experience to assess upcoming presales and pinpoint notable opportunities based on the team’s proficiency and the project’s unique offering.
After a rigorous evaluation, they have curated a list of presale offerings that demonstrate immense potential due to the skill of their teams and the novelty of their ideas.
For cryptocurrency investors who are willing to take on higher risk, participating in these carefully chosen presales could potentially provide profitable investment opportunities in 2023 and beyond.
New Cryptocurrencies to Buy In 2023
Disclaimer: Crypto is a high-risk asset class. This article is provided for informational purposes and does not constitute investment advice. You could lose all of your capital.
- Elon Musk Grok AI Predicts Shocking XRP Price by End of 2026
- Mark Zuckerberg’s Meta AI Predicts Unbelievable Bitcoin Price by the End of 2026
- Sam Altman ChatGPT AI Predicts Shocking Bitcoin Price by End of 2026
- BTC USD Recovering: Why is The Crypto Market Going Up Today, July 2nd?
- Elon Musk Grok AI Predicts Incredible XRP Price and Bitcoin Price by End of 2026
2M+
250+
8
70


- Elon Musk Grok AI Predicts Shocking XRP Price by End of 2026
- Mark Zuckerberg’s Meta AI Predicts Unbelievable Bitcoin Price by the End of 2026
- Sam Altman ChatGPT AI Predicts Shocking Bitcoin Price by End of 2026
- BTC USD Recovering: Why is The Crypto Market Going Up Today, July 2nd?
- Elon Musk Grok AI Predicts Incredible XRP Price and Bitcoin Price by End of 2026
More Articles

