Analysts Optimistic as Bitcoin Price Breaks Key Long-Term Barrier


After the price of bitcoin (BTC) crossed the technically important 200-day moving average line earlier this week, some analysts have come out with bullish calls for the number one digital asset.

Tom Lee of Fundstrat Global Advisors wrote in a private note to clients that the break of the 200-day moving average line means that bitcoin now is “back in a bull market.” He also added that the price has historically rallied by a larger percentage in the next six months whenever it breaks above the 200-day moving average line, than when it breaks below it, Yahoo Finance reported.
Lee also shared some highlights from his analysis on Twitter, where he said that 2020 is “shaping up to be [a] great year for BTC.”
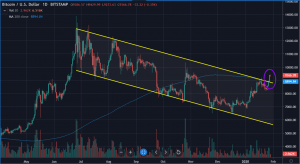
However, Lee was not the only analyst who pointed out the significance of the recent price action in bitcoin. In addition, Mati Greenspan, founder of Quantum Economics, wrote in his newsletter that the break of the 200-day moving average roughly coincided with the break-out from a downward-facing trading channel that has lasted for months in the chart.
“Both of these barriers have now been completely pulverized,” the analyst noted.
Further, Greenspan also responded to those who question whether the break-out can hold this time, writing:
“Several have already pointed out to me that we’ve recently seen several false breakouts and so it’s possible that this will be reversed too. However, I would argue that it’s a lot less likely this time. Simply for the fact that unlike the late-October Xi-boom, for example, this move has happened more gradually, allowing the market to really give a proper timely test of the relevant price levels.”
He added:
“I’ve seen it happen several times in my career, where a large move was widely anticipated by the market but is really taking its time. Then, when the technical breakout finally occurs there’s a moment, or a day, or even a few days of shock and disbelief to see it’s really happening.”
At pixel time (10:48 UTC), BTC trades at c. USD 9,378 and is almost unchanged in a day. The price went up 13% in a week and 30% in a month.
- Google Gemini AI Predicts Jaw-Dropping XRP Price For Next 90 Days
- Sam Altman ChatGPT Predicts Explosive XRP Price by End of 2030
- You Will Not Like Where Google Gemini AI Predicts Bitcoin Price Going in 2026
- XRP Price Prediction: Ripple Jumps 10% as Crypto Total Market Cap Closing $2.4T
- Experts Claim July 4 CLARITY Act Signing Is “Realistically Impossible”, What Happens to Crypto Now?
2M+
250+
8
70


- Google Gemini AI Predicts Jaw-Dropping XRP Price For Next 90 Days
- Sam Altman ChatGPT Predicts Explosive XRP Price by End of 2030
- You Will Not Like Where Google Gemini AI Predicts Bitcoin Price Going in 2026
- XRP Price Prediction: Ripple Jumps 10% as Crypto Total Market Cap Closing $2.4T
- Experts Claim July 4 CLARITY Act Signing Is “Realistically Impossible”, What Happens to Crypto Now?
More Articles

