Why the Bitcoin Price Bottom is Between These Two Levels and Its Time to DCA In


$20,000 is widely held as a key psychological level for Bitcoin as it places BTC above its 2017 high and a clear level to defend.
By identifying Bitcoin’s price floor, investors can maximize their capital efficiency and skew the balance of risk and reward in their favor — gaining the maximum possible upside with the least possible downside risk.
Glassnode, the prominent on-chain market intelligence platform, recently released a report in which it attempts to identify the upper and lower bounds for Bitcoin’s bottom using a variety of floor indicators.
The data indicates that the bottom is close, very close — and that it may be found before February 2022.
Realized Price
A cryptocurrency’s realized price is the average price that holders paid for their coins/tokens at the time of purchase — the average of the sum of these values produces the realized price.
If the realized price is above the current spot price, then the holder community is in an aggregate profit, whereas if it is below, they are in an aggregate unrealized loss.
The former situation means there are still in-profit players that could exit their positions and drive down the market, whereas the latter indicates selling activity is likely to be minimal — since few holders want to sell at a loss.
According to Glassnode’s live workbench, Bitcoin’s realized price is currently hovering around $21,100.
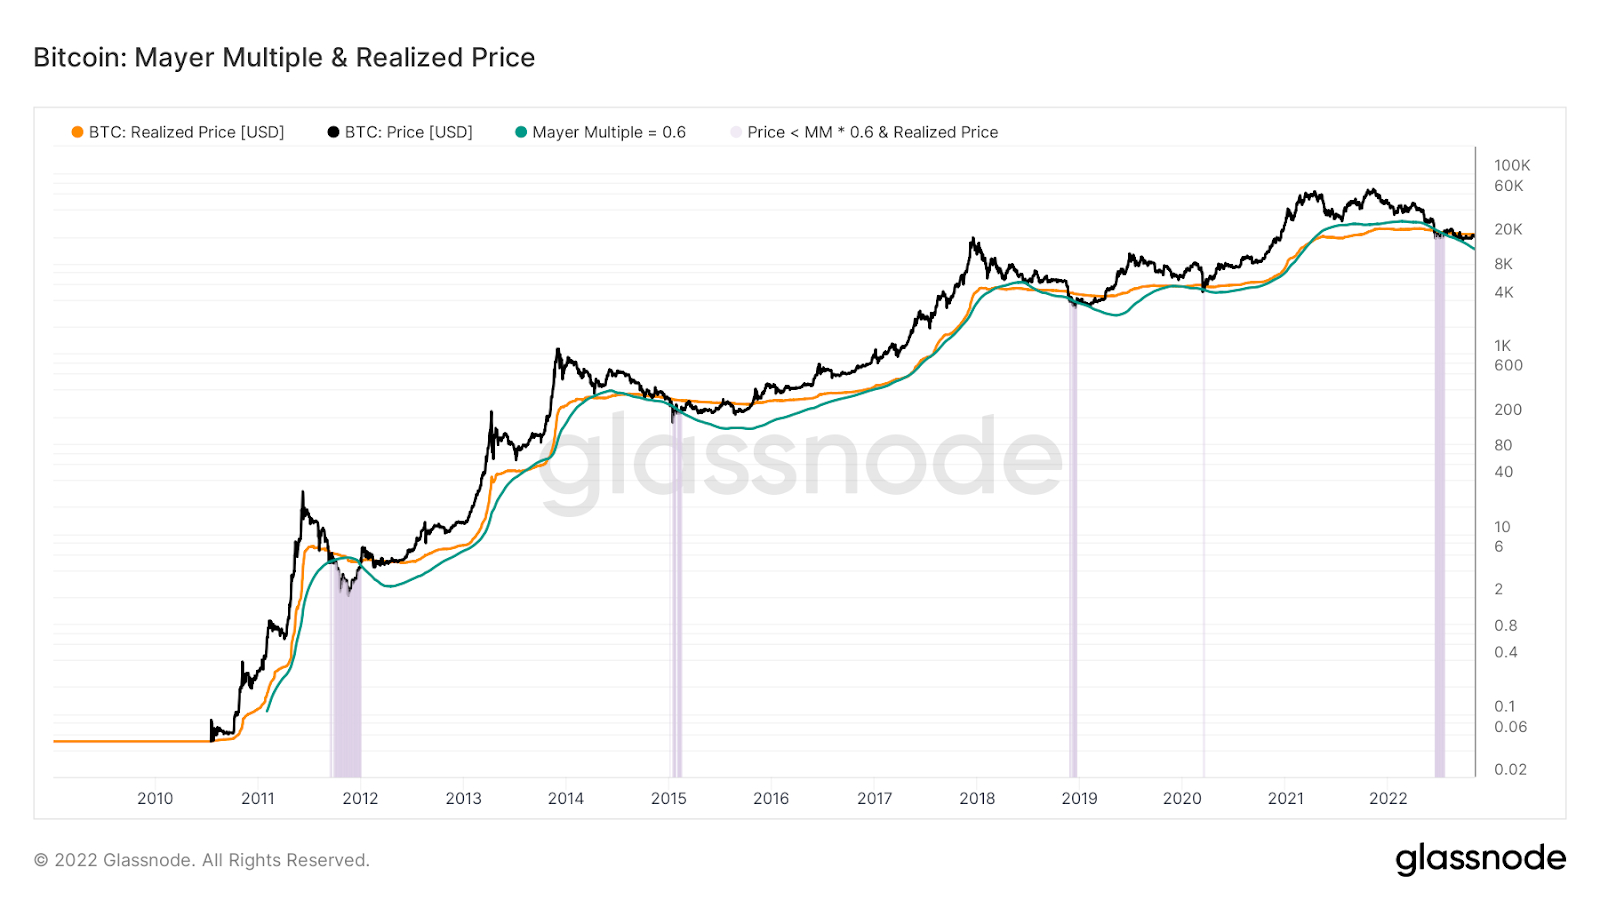
Historically, Bitcoin’s spot price has only traded at or below the realized price on rare occasions, and usually for less than six months. Bitcoin has currently been trading below its realized price since mid-August — or for approximately 2.5 months.
It’s important to note that the realized price is an aggregate metric, within the spectrum of different entry prices. There will almost always be a subset of holders that are in profit, even while the aggregate is in a loss — and vice-versa when the aggregate is winning.
Nonetheless, studies have shown that investors can be nudged into selling at a steep loss if market conditions are severe enough.
Though not a direct measure of the severity of market conditions, the Crypto Fear & Greed Index can be used to measure the degree of fear in the market — and hence the odds of a panic sell-off.
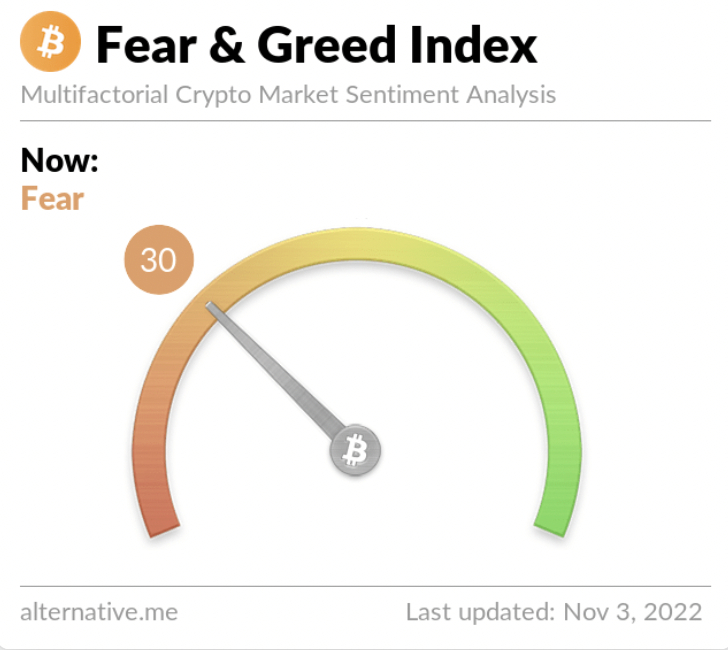
Currently sitting at 30, the Fear & Greed Index indicates a general bearish sentiment, but nothing like what was seen during recent flash crashes. For comparison, the index sat at just 10 in early January 2022 — after Bitcoin collapsed by 50% in 2 months.
Balanced Price
The Balanced Price is another indicator often used to identify the lower bounds of a market.
This is defined as the difference between the Realized Price and the Transferred Price (calculation shown below). The Realized Price is also known as its coinday weighted price. Glassnode posits that the Transferred Price represents a suitable lower bound for the Bitcoin price.

The Transferred Price uses the Coin Days Destroyed metric and the Bitcoin supply to look at the spending behavior of Bitcoin holders. By looking at the delta between the Realized Price and the Transferred Price, we can find the fair valuation of Bitcoin and establish it as a potential bottom.
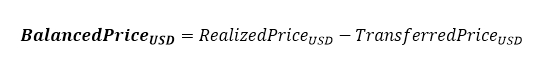
The Balanced Price currently sits at around $16,500.
What’s Next for Bitcoin
As we previously touched on, the Realized Price establishes the upper bound for Bitcoin’s bottom at $21,100, whereas the Balanced Price sets the lower bound at $16,500.
At its current price of $20,280, Bitcoin is close to the upper end of the bounds and could be due to fall by as much as 18.7% to reach its lower bound. Should history repeat itself, this would likely occur within the next 3 months.
With the U.S. federal reserve and other central banks now hiking interest rates in an attempt to curb spending and put the breaks on the economy the current recession may be short-lived. And with the price of energy coming down (including natural gas, crude oil, and diesel), the macroeconomic situation appears to be improving.
Given that Bitcoin (and most other digital assets) still remain weakly correlated to the stock market, which is in turn heavily driven by the macroeconomic climate, odds are both are at or near their bottom — and due for a turnaround.
For those employing a weighted or standard dollar-cost averaging (DCA) strategy, it might be time to start scaling in, given that the risk-reward ratio is beginning to tilt in your favor.
- Bitcoin Price Prediction: BTC USD Shrugging Off $800 Billion AI Sell-Off
- XRP Price Prediction: Ripple Token Spot Demand Hits Highest Since June
- XRP Price Fails to Complete Cup and Handle as Ripple Introduces Mint to Solve RLUSD Problem
- Ethereum News: How a $67M ETH Short Reveals Hyperliquid’s Institutional Leap
- Ethereum Price Gaining Ground as Its SMA 30D Funding Rate Climbs Highest in Six Months
2M+
250+
8
70


- Bitcoin Price Prediction: BTC USD Shrugging Off $800 Billion AI Sell-Off
- XRP Price Prediction: Ripple Token Spot Demand Hits Highest Since June
- XRP Price Fails to Complete Cup and Handle as Ripple Introduces Mint to Solve RLUSD Problem
- Ethereum News: How a $67M ETH Short Reveals Hyperliquid’s Institutional Leap
- Ethereum Price Gaining Ground as Its SMA 30D Funding Rate Climbs Highest in Six Months
More Articles

