Indicators Work Beautifully, Until They Don’t…


When we first get into investing, we are confronted with charts. Charts that show how our particular asset of interest is performing. No matter what you’re into, its price performance can be shown on a chart, and in a number of different ways. For the general public there’s the good old line chart; easy to understand and what we were all taught at school.
Something like that is all well and good for showing performance between two points in time, like a daily session in London or New York, but besides showing us that the price is now higher or lower than it was this morning at the open, its not much use for anything else. For that reason price performance is often shown on a candle chart, like this:
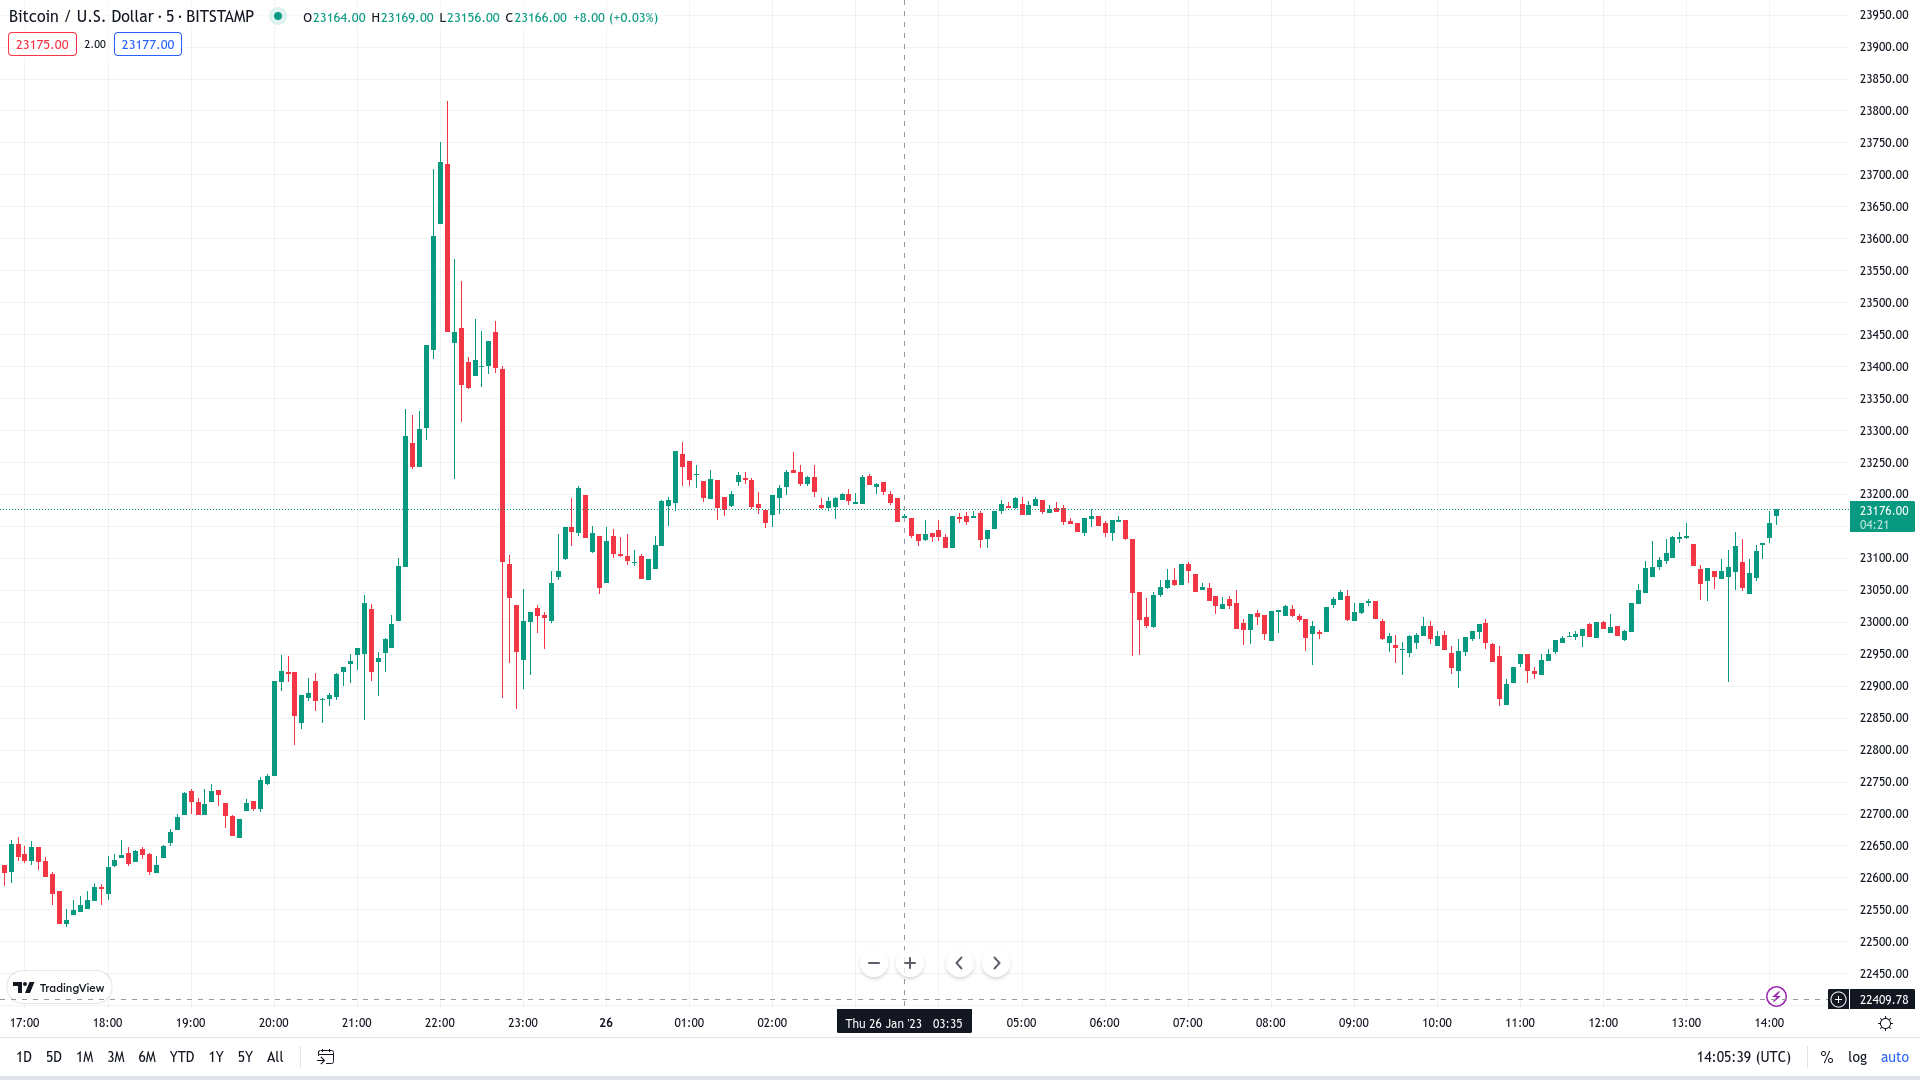 For the untrained eye, this is a fearsome spectacle. Green and red blocks, some with tails and some without. Luckily it doesn’t take very long to learn what these candles are telling us and help us build up a picture of what we are looking at. But, like every such price chart, it tells us what HAS happened, not what WILL happen. Which is obvious. If it did that, we’d all be billionaires.
So, to take this information and give us an IDEA of what the future might bring, we use indicators. These come in a multitude of different shape and sizes, some very simple to follow like a moving average, and some more involved like a Volume Weighted Average Price, or VWAP, or a Moving Average Convergence Divergence, or MACD. To further complicate matters, indicators can be combined with other indicators to supposedly give a more refined prognostication. You will have no doubt seen a chart with a moving average moving upwards, an RSI above the 50 level and a support level just below price and been told ‘The stars are aligned, BUY, BUY, BUY!’. Or equally, during the Bitcoin bull run, a moving average moving downwards, an RSI below 50 and a resistance level far above and been told ‘The stars are aligned, BUY, BUY, BUY!’
So, can both be right? And are these indicators truly predicting the future?
Well, the reasoning behind both of the scenarios pointing to a buy possibility are conflicting, but can be reasoned logically. The first is purely indicator driven: everything is pointing up, so price is going up. The second is the famous ‘buy the dip’ situation that was doing the rounds at the time. This notion is that the price is currently consolidating or pulling back slightly before continuing its push higher, so by getting in now you are getting a better deal. Again, makes sense, as long as we can be sure that the price is actually doing that, and no-one can say that for sure.
This brings me to the title of this article: Indicators work beautifully, until they don’t
We must always remember that indicators are only as good as the information they are given. A moving average doesn’t know that price is approaching an old high and could well pull back sharply. It just shows a nice line moving upwards, as each subsequent candle had closed higher than the last. It doesn’t take into account the time of day, which sessions are currently open, just opening or just closing, or what time of year it is for that matter. If you plotted ice cream sales from June to the end of August with a moving average, it would indicate that by Christmas ice cream sales will be astronomical. But our own knowledge and expertise tells us that the opposite is most likely.
Let’s take a look at the run up to the Bitcoin high of November 2021, with some standard indicators:
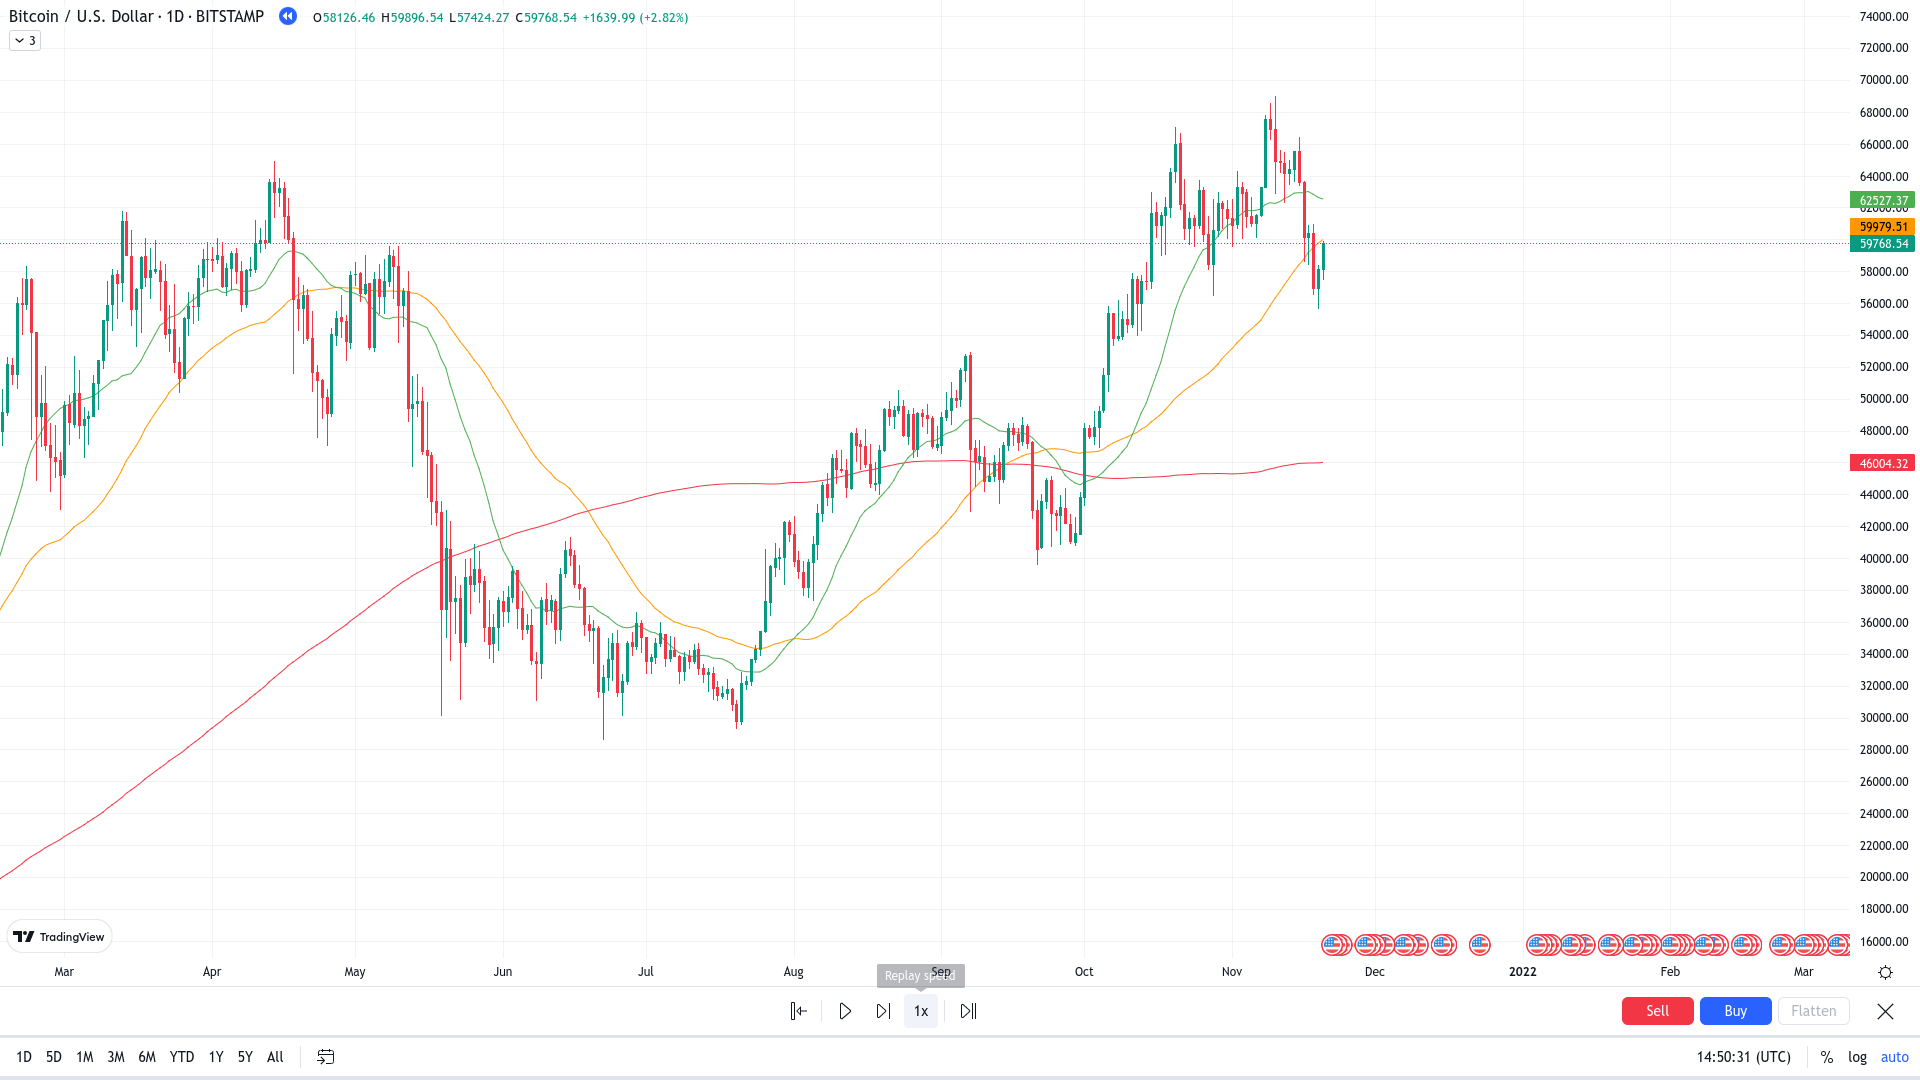
The green line is a ‘fast’ 21-period average, the amber a ‘medium’ 50-period and the red a ‘slow’ 200-period average. What do we notice? All three are pointing upwards. At least until the peak day on 10 Novmber 2021, when price touched exactly $69,000 – a price big money investors had decided was the absolute top price they would pay for a Bitcoin, and not a penny more.
Waking up on 9 November, opening a Bitcoin price chart and seeing that huge bullish candle with no down wick taking price up around $4,500 in a single day, and with all the indicators screaming BUY, no-one would have blamed you if you had thought: “Sell the house, car, pets, everything. I’m going to be RICH!”
And you would have seen price continue up that day to the magical $69,000 figure, and thought you were the Chosen One. Fast forward just one week, and everything has changed. The Bitcoin price is struggling to stay above $60,000, and every day it gets lower and lower, and has never come back.
Had you been that unlucky soul, you might have stared at that chart for hours, thinking to yourself: “What did I do wrong? What didn’t I see?”
The answer is nothing. Everything on the chart is on your side. The only thing missing was a previous high price to use as a target, because we were in uncharted territory, but Bitcoin is still a relatively new asset, and there was nothing to suggest that it would come to a screeching halt.
And so, once again, back to the theme of the article: Indicators work beautifully, until they don’t
That is because indicators do just what their name suggests: they indicate. They give a suggestion. Much like the indicators or turn signals on a car. If the vehicle in front of you is indicating left, it by no means guarantees it will turn left. So what do we do? Exercise caution. We wait and watch, and see what happens.
That’s all well and good, you might say, but it doesn’t help me. I want to use indicators to tell what to do BEFORE it happens, because during or after is often too late.
That’s true, but the unfortunate reality is that there isn’t anything that can do that for you. We can look to previous highs and lows on the chart and take an educated guess that price will move towards one or the other, as most likely there are large orders waiting to be filled at those points, but again, we don’t know for sure. How often have you seen an RSI maxed out to oversold or overbought, and price just keeps plodding along regardless.
So is it all pointless, you might ask. Is there no rhyme or reason to price action, and it’s just a spin of the wheel? Well no. There is far too much money invested in such assets for them to just fly up and down at will making the lucky rich and the unlucky poor. That would bring down our entire financial system.
What we can do is be patient, and observe price action. Indicators certainly have their value in this, helping us identify trends in the market, or potential to buy, but again, they offer no guarantees. The onus is on you and you alone to fully understand not only what you are investing in, but also the consequences if that which you hope happens does not come to pass.
- Sam Altman ChatGPT Predicts Explosive XRP Price by End of 2030
- You Will Not Like Where Google Gemini AI Predicts Bitcoin Price Going in 2026
- Perplexity AI Predicts Explosive Solana Price Prediction by End of 2026
- Lummis Links Bitcoin to $39.2T US Debt Crisis as CLARITY Act Nears Senate Floor
- Standard Chartered Crypto Prediction: $40K ETH, $500K BTC, and $100 UNI
2M+
250+
8
70


- Sam Altman ChatGPT Predicts Explosive XRP Price by End of 2030
- You Will Not Like Where Google Gemini AI Predicts Bitcoin Price Going in 2026
- Perplexity AI Predicts Explosive Solana Price Prediction by End of 2026
- Lummis Links Bitcoin to $39.2T US Debt Crisis as CLARITY Act Nears Senate Floor
- Standard Chartered Crypto Prediction: $40K ETH, $500K BTC, and $100 UNI
More Articles

