XRP Price Slides 2.9% as $1.50 Reclaim Becomes Critical





XRP lost its $1.50 price pivot today, sliding to $1.47 after a daily decline of about 3%. The break forces a binary question onto the chart: does the selling pressure showing up in spot-market volume resolve into a quick reclaim, or does it open the door to a deeper slide toward $1.40-$1.42?
The 200-day EMA is near $1.37, the level that would flip the medium-term structure from bullish to neutral. The token has been printing lower highs since a local peak near $1.63 on September 23, and a second attempt to clear $1.60 on September 25 failed as well. Since then, the decline has been slow and orderly: $1.55, then $1.52, then $1.50, and now $1.47.

There was no single dramatic session driving the move. Instead, the pattern reads as buyers simply not showing up, with every small bounce getting sold rather than extended. After the sharp rally in early September, that kind of cooling was overdue, but the open question is whether $1.50 was ever real support or just a round number the market is now testing.
Earn $50 and Enter $300K Prize Draw on EdgeXETF Accumulation Narrative or Technical Pullback?
The chart itself frames this as a cooling-off period following the rally that carried the XRP price up nearly 50% from its August low near $1.00. RSI sits at a neutral 54, with no overbought or oversold readings to lean on. Price levels, not oscillators, are setting the tone for this week.
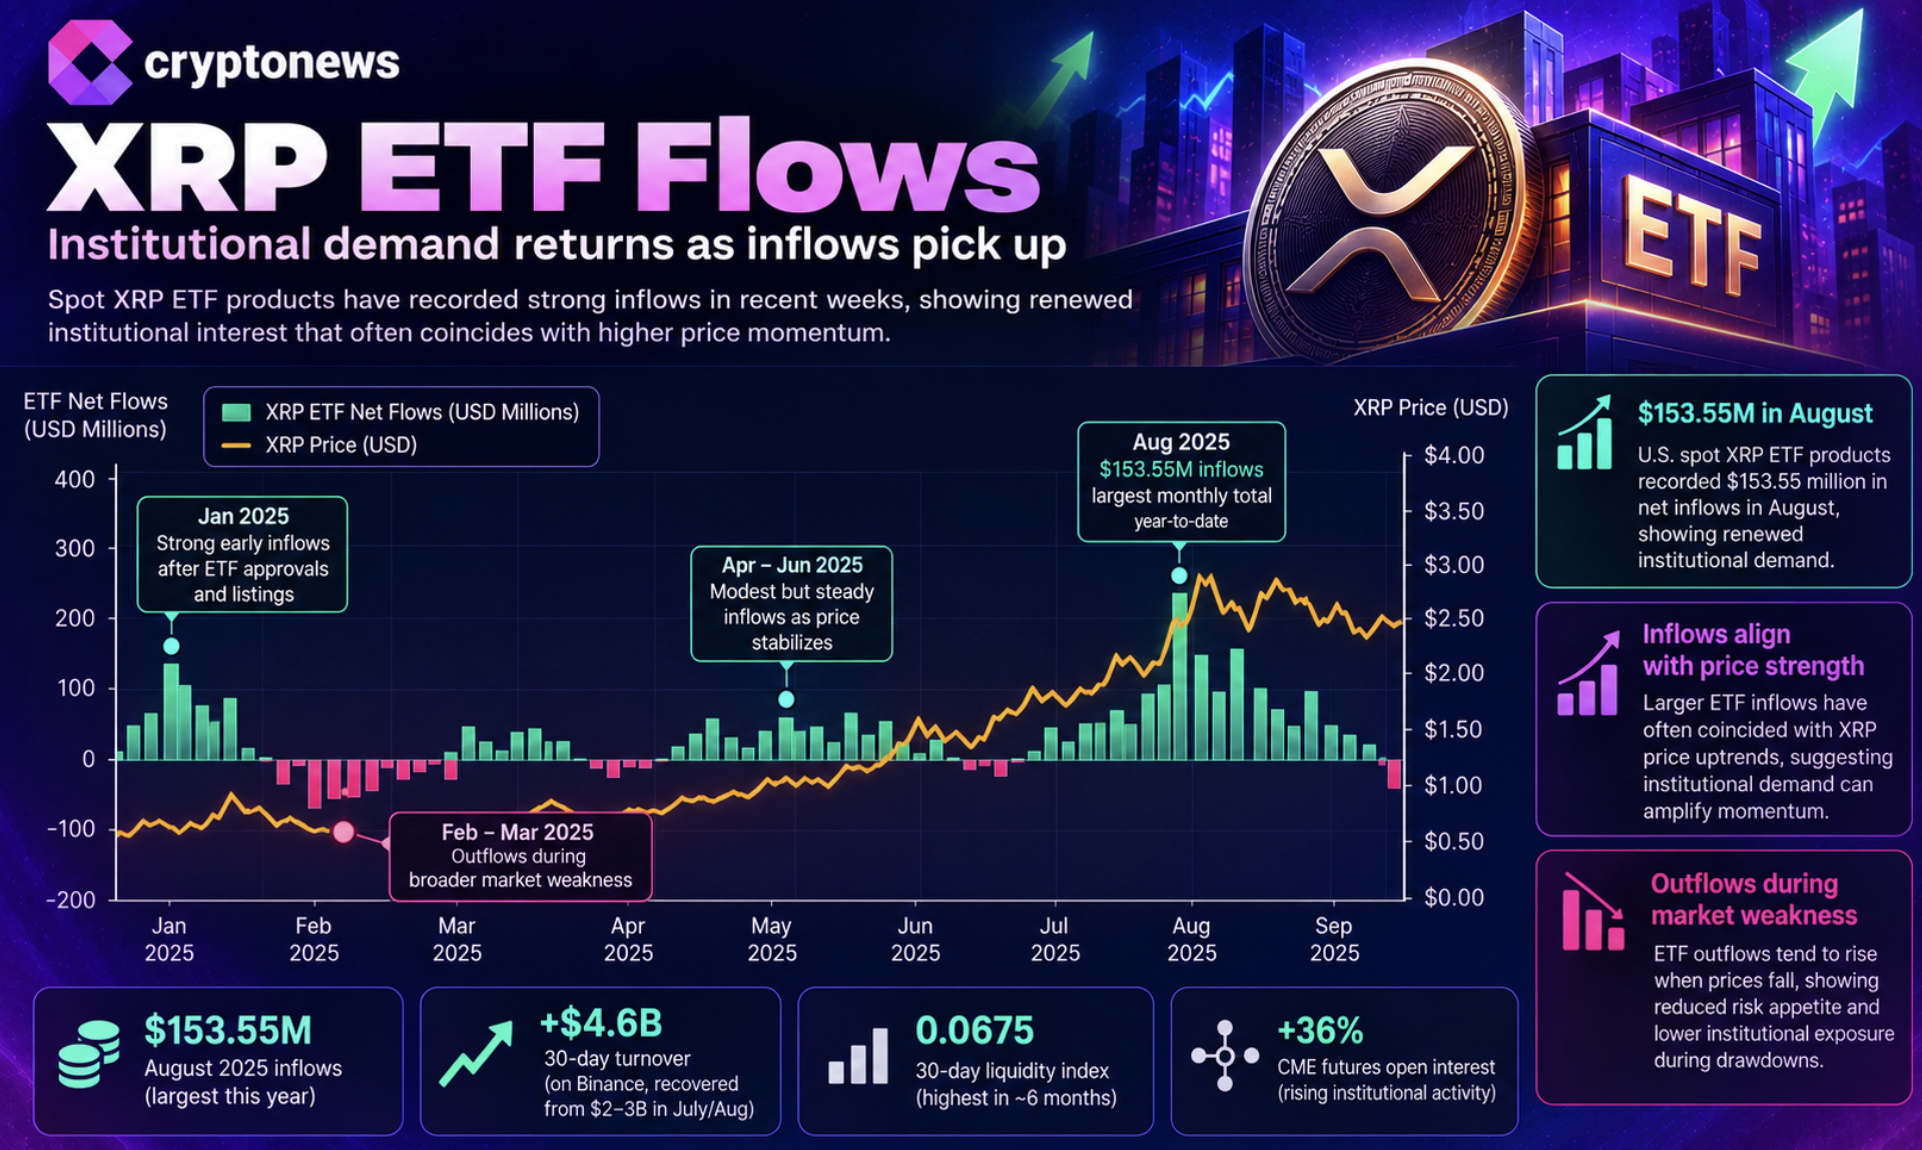
Separately, market data has pointed to sustained spot XRP ETF inflows running into the hundreds of millions of dollars over recent weeks, a trend some trackers frame as ongoing institutional accumulation beneath the price action. That flow data is useful context, but it is not confirmed as the driver of Monday’s drop, as the pullback below $1.50 traces cleanly to failed resistance tests and fading bid support.
| Direction | Level | Significance |
| Upside | $1.55 | Zone of last week’s consolidation; first sign of reclaimed strength |
| Upside | $1.60 – $1.63 | Last week’s twin highs break reopens the September 23 top |
| Upside | $1.67 – $1.70 | September/August highs; opens the road to $1.80-$2.00 |
| Downside | $1.40 – $1.42 | Mid-September consolidation base; first support to test |
| Downside | $1.37 | 200-day EMA; a daily close below flips the trend to neutral |
| Downside | $1.30 | Horizontal support that held twice in September |
The medium-term structure remains intact for now. XRP sits above its 200-day EMA at $1.37, which is curling upward for the first time since spring. This is a sign the longer trend has not broken, even as the shorter-term chart bleeds lower. A descending trendline from the late-August spike to $1.70 was cleared in mid-September, and that breakout is what fueled the run to $1.67 in the first place.
A second descending trendline, drawn from the September 23 high, is now the line bulls need to clear in October; left alone, it points toward $1.20 by mid-November. The levels on both sides of the current price are well defined.
Trade XRP on Bybit and Get a Chance to Win Our $1,000 USDT AirdropReclaim $1.50 or Risk $1.37: XRP Price Next Move
The first job for bulls is straightforward: close a daily candle back above $1.50. Do that, and Monday’s drop reads as a fakeout rather than a breakdown, with $1.55 as the next confirmation level and $1.60-$1.63 as the target that would put the September 23 high back in play.
Fail to reclaim $1.50 in the next day or two, and $1.40-$1.42 becomes the level to watch, with the 200-day EMA at $1.37 as the line that actually matters for the medium-term outlook. A close below it would shift Ripple’s native asset from a bullish structure to a neutral one, opening room toward $1.30 and, in a broader crypto market sell-off scenario, $1.20.
For this week, the range is $1.37 to $1.60, with $1.50 sitting as the pivot in between. On technical analysis grounds, the base case is a dip toward $1.40-$1.42 that gets bought, followed by another attempt at reclaiming $1.50. A pattern consistent with pullbacks inside an uptrend rather than the start of a new downtrend.
The $1.80-$2.00 zone remains the valid medium-term target as long as $1.37 holds; lose it, and that target moves out of reach for the immediate term.
Discover: The Best Token Presales
- XRP News: Ripple’s Multi-Asset Payments Model Predates Resurfaced XRP Remarks
- XRP News: Ripple Takes Aim at SWIFT, Pantera CEO Says
- Quant Crypto Blasts 3x in a Week Following Huge US Bank Deal
- Bitcoin Price Never Closed Below Expectation in 2026 Bear Market
- Elon Musk Grok AI Predicts The Price of XRP by The End of 2026
2M+
250+
8
70





- XRP News: Ripple’s Multi-Asset Payments Model Predates Resurfaced XRP Remarks
- XRP News: Ripple Takes Aim at SWIFT, Pantera CEO Says
- Quant Crypto Blasts 3x in a Week Following Huge US Bank Deal
- Bitcoin Price Never Closed Below Expectation in 2026 Bear Market
- Elon Musk Grok AI Predicts The Price of XRP by The End of 2026
More Articles

 in numbers