Best Crypto to Buy Now September 14 – Hedera, THORChain, Curve DAO


The market capitalization of cryptocurrencies is currently increasing by 1.24%, reaching $1.035 trillion on September 14, as per data from TradingView.
This rise can be attributed to the gains witnessed by top cryptocurrencies like Bitcoin, Ethereum, and Solana, in response to the latest inflation data and increased speculation that the Federal Reserve may suspend interest rate hikes in their forthcoming September meeting.
Given the current macroeconomic conditions, what are the best cryptos to buy now?
The rally comes after the Labor Department reported the Consumer Price Index jumped 0.6% in August compared to the previous month.
This was higher than expected. However, core inflation, which removes volatile food and energy categories, was only up 0.3% — evidence that price pressures may be easing overall.
Market participants are now pricing in a 97% probability that the Fed will keep rates unchanged at the upcoming September 20-21 policy meeting, according to CME FedWatch Tool.
Some analysts also pointed to reduced fears around contagion from the FTX bankruptcy as supportive of the cryptocurrency rebound.
On September 13, a federal judge approved the sale of remaining crypto assets from the failed exchange but excluded major coins like bitcoin and ether that account for 70% of holdings.
The excluded assets also have vesting schedules and limits on weekly sales volumes.
Still, some technicians cautioned that further upside may be limited until the crypto market capitalization can break back above its 50-day moving average, currently around $1.08 trillion.
Failing to overcome that technical threshold could result in a potential drop toward the $980-995 billion range.
For now, the outlook for Fed policy and limited spillover from FTX seem to be bolstering cryptocurrency prices. But sustaining gains may require additional evidence that core inflation continues moderating toward the central bank’s 2% goal.
The cryptocurrency market remains highly sensitive to interest rate expectations and macroeconomic uncertainties.
With Bitcoin and the broader cryptocurrency market rallying, other cryptos such as Hedera, Wall Street Memes, THORChain, Bitcoin BSC, and Curve DAO are also making gains.
Their solid fundamentals and/or encouraging technical analysis make them some of the best cryptos to buy now.
Hedera (HBAR) on the Verge of a Turnaround? Technical Indicators Suggest Potential for Upside
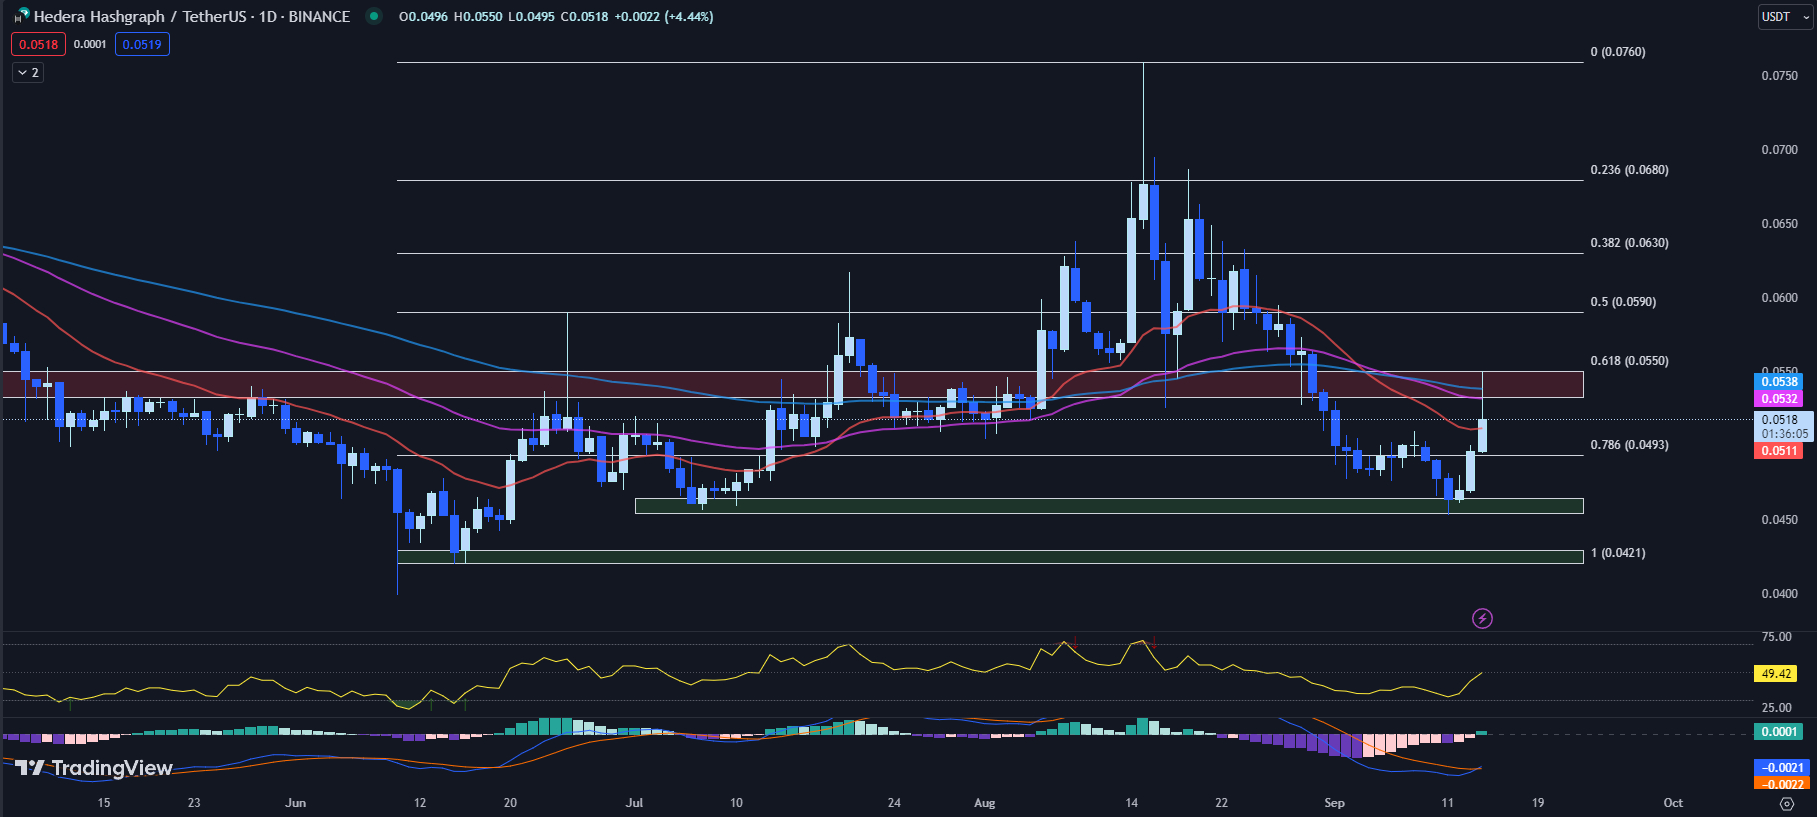
After pulling back from the $0.0533 to $0.0550 resistance area, Hedera (HBAR) has shown signs of bottoming with a 4.44% advance so far today to $0.0518.
This rise above the 20-day EMA at $0.0511 indicates potential for a trend reversal. Key indicators like the RSI and MACD histogram are turning bullish, suggesting HBAR could retest overhead resistance around the 50-day EMA of $0.0532 soon.
The 20-day EMA, currently at $0.0511, serves as an immediate support level. HBAR’s current price of $0.0518, which represents an increase of 4.44% so far today, is already testing this level.
The 50-day EMA and 100-day EMA, priced at $0.0532 and $0.0538 respectively, align closely with the resistance zone from $0.0533 to $0.0550, which coincides with the Fib 0.618 level of $0.0550. These confluence points suggest a strong and significant resistance area for HBAR.
The RSI has risen to 49.42 from yesterday’s 43.25. This attempt to retake the RSI 50 level suggests that bullish momentum is building.
A sustained move above 50 could signal a strengthening of bullish sentiment, which may result in an upward price movement in the near term.
Adding further to the bullish argument is the MACD histogram, which has moved to 0.0001 from yesterday’s -0.0002. This change indicates a potential bullish MACD crossover.
A positive MACD crossover often precedes a bullish price action, suggesting that the cryptocurrency could soon rally.
However, if HBAR fails to sustain above the 20-day EMA support, the next potential support level to watch would be the Fib 0.786 level at $0.0493.
The technical indicators suggest that Hedera (HBAR) may be on the brink of a trend reversal. Traders should watch the RSI and MACD closely, as these indicators could confirm the potential bullish development. However, a prudent approach would also involve monitoring support levels in case of a pullback.
Investing in Meme Coins? Discover Why WSM Is One of the Best Cryptos to Buy Now
The stratospheric rises of Dogecoin and Shiba Inu have proven that even joke cryptocurrencies can make investors money if fueled by hype.
Now Wall Street Memes ($WSM), a new meme coin themed around financial satire, is angling to join the coveted ranks of top-performing meme coins in the crypto market.
Unlike most overnight meme coin sensations, WSM has been steadily building its community base since 2019 across social media, amassing over 1 million engaged followers.
WSM is the cryptocurrency extension of the popular Wall Street Memes social media brand, which boasts over 1 million followers.
The Wall Street Memes Twitter account has been active since 2019, building an engaged audience through financial memes and satire.
WSM’s presale has already raised more than its targeted $25 million, highlighting robust demand leading up to the token’s public listing.
The presale concludes on September 25 before WSM gets listed on major crypto exchanges on September 27 per the launch schedule.
WSM rewards longtime Wall Street Memes community members for their loyalty and hopes to convert them into investors.
30% of WSM’s tokenomics are set aside to incentivize the community. This could help cement WSM as more than just a passing trend.
While some analysts speculate WSM could mimic Pepe’s meteoric price surge earlier this year, that kind of exponential growth remains uncertain.
The true test for WSM will come after the initial exchange listing hype dies down when enduring value and utility determine if this meme coin can court a wider audience beyond its core community.
THORChain (RUNE)
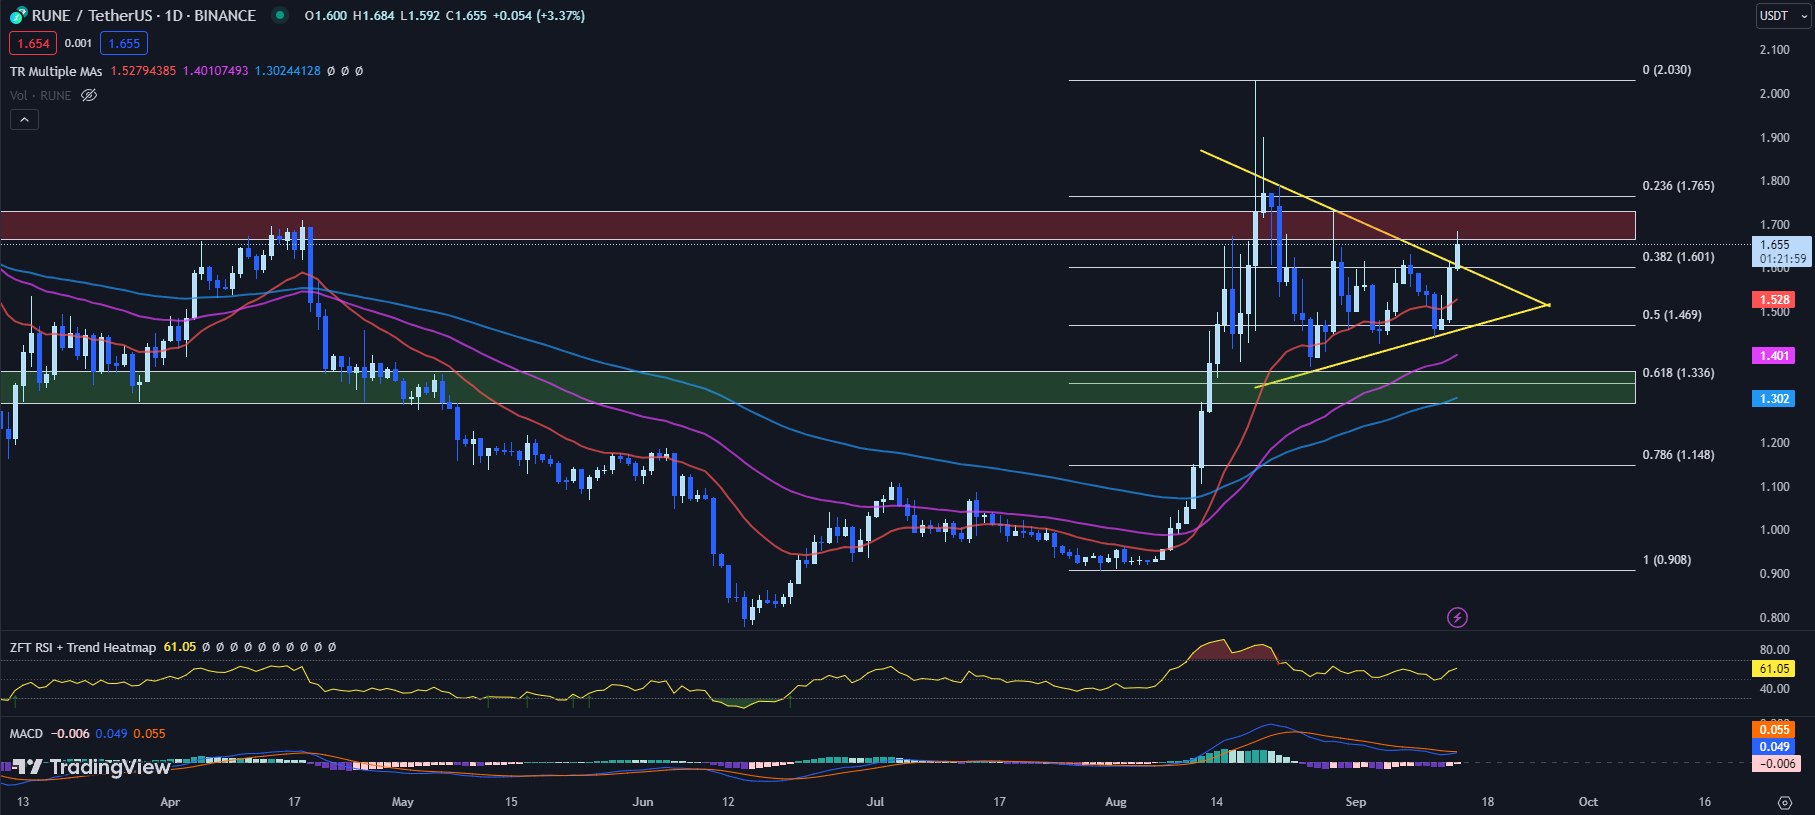
THORChain (RUNE) looks primed for a bull run as it breaks out of a month-long symmetrical triangle pattern. With RUNE up 3.37% so far today to $1.655, the technical landscape suggests substantial upside potential.
Key indicators like ascending EMAs, an RSI push into bullish territory, and a rising MACD histogram all support RUNE’s case for an immediate uptrend.
The alignment of key Exponential Moving Averages (EMAs) further substantiates this bullish outlook. The 20-day EMA stands at $1.528, the 50-day EMA at $1.401, and the 100-day EMA at $1.302.
The fact that these EMAs are aligned in ascending order is a positive sign, indicating that the short-term trend is stronger than the medium-term trend, which in turn is stronger than the long-term trend. This alignment typically signals a strong bullish momentum.
Adding to the bullish sentiment is the RSI, an indicator used to identify overbought or oversold conditions. The RSI currently sits at 61.05, up from yesterday’s 58.08. This movement into bullish territory suggests that the buying pressure for RUNE is increasing.
The MACD histogram has moved from -0.014 to -0.006. This shift towards the zero line is indicative of bullish momentum gaining traction.
RUNE is currently trading at a price of $1.655, marking a 3.37% rise so far today. The immediate resistance zone lies between $1.666 and $1.731, followed by the Fib 0.236 level at $1.765.
If the price manages to break these resistance levels, it would validate the bullish outlook and potentially open the way for further gains.
On the flip side, immediate support is found at the Fib 0.382 level of $1.601, coinciding with the descending upper trendline of the symmetrical triangle formation.
This level may serve as a potential retest and a viable buy point for traders, should a pullback occur.
The technical indicators for THORChain (RUNE) suggest a bullish future. Traders should keep a close eye on the aforementioned resistance and support levels, as their reaction to these price points will likely dictate the next phase of the cryptocurrency’s trajectory.
Earn Passive Income with BTCBSC: The Eco-Friendly Alternative to Bitcoin Mining
Bitcoin’s early days delivered life-changing wealth, with prices leaping from pocket change to over $1,000 in under three years.
Hoping to rewrite history, Bitcoin BSC (BTCBSC) seeks to provide a similar rocket ride by mimicking Bitcoin on the smooth and user-friendly Binance Smart Chain.
Recently launched on September 5, Bitcoin BSC features the same fixed supply of 21 million tokens as Bitcoin but runs on the Binance Smart Chain instead of Bitcoin’s blockchain. This allows BTCBSC to offer faster and cheaper transactions than Bitcoin.
The project is currently holding a presale where investors can buy BTCBSC for just $0.99 per token, the same price Bitcoin traded for in 2011 when its market cap was still under $100 million.
BTCBSC has already raised over $1.8 million in its presale so far. Once it reaches its soft cap of $3.9 million, BTCBSC will launch on major crypto exchanges.
Holders of BTCBSC can earn passive income through a staking system that currently offers 284% APY rewards. This staking reward percentage will decrease over time as more users stake their tokens.
BTCBSC intends to provide a simpler and more eco-friendly alternative to Bitcoin mining. Mining Bitcoin requires expensive, specialized equipment and consumes vast amounts of electricity.
Meanwhile, BTCBSC uses a Proof-of-Staked consensus that allows token holders to earn rewards just by holding their tokens in a cryptocurrency wallet. This requires no special equipment and minimal energy usage.
BTCBSC presents a chance to get in on the ground floor, much like early Bitcoin adopters once did. The future remains uncertain, but supporters see echoes of Bitcoin’s modest beginnings in BTCBSC’s principles and growth.
Their optimism fuels the belief that BTCBSC could capture even a fraction of Bitcoin’s meteoric rise and transform small investments into fortune-making stakes.
While the odds seem long, the potential rewards are historic for those willing to take the plunge in these early days.
Bearish Trend Reversal? Technical Indicators Point to Potential Recovery for Curve DAO (CRV)
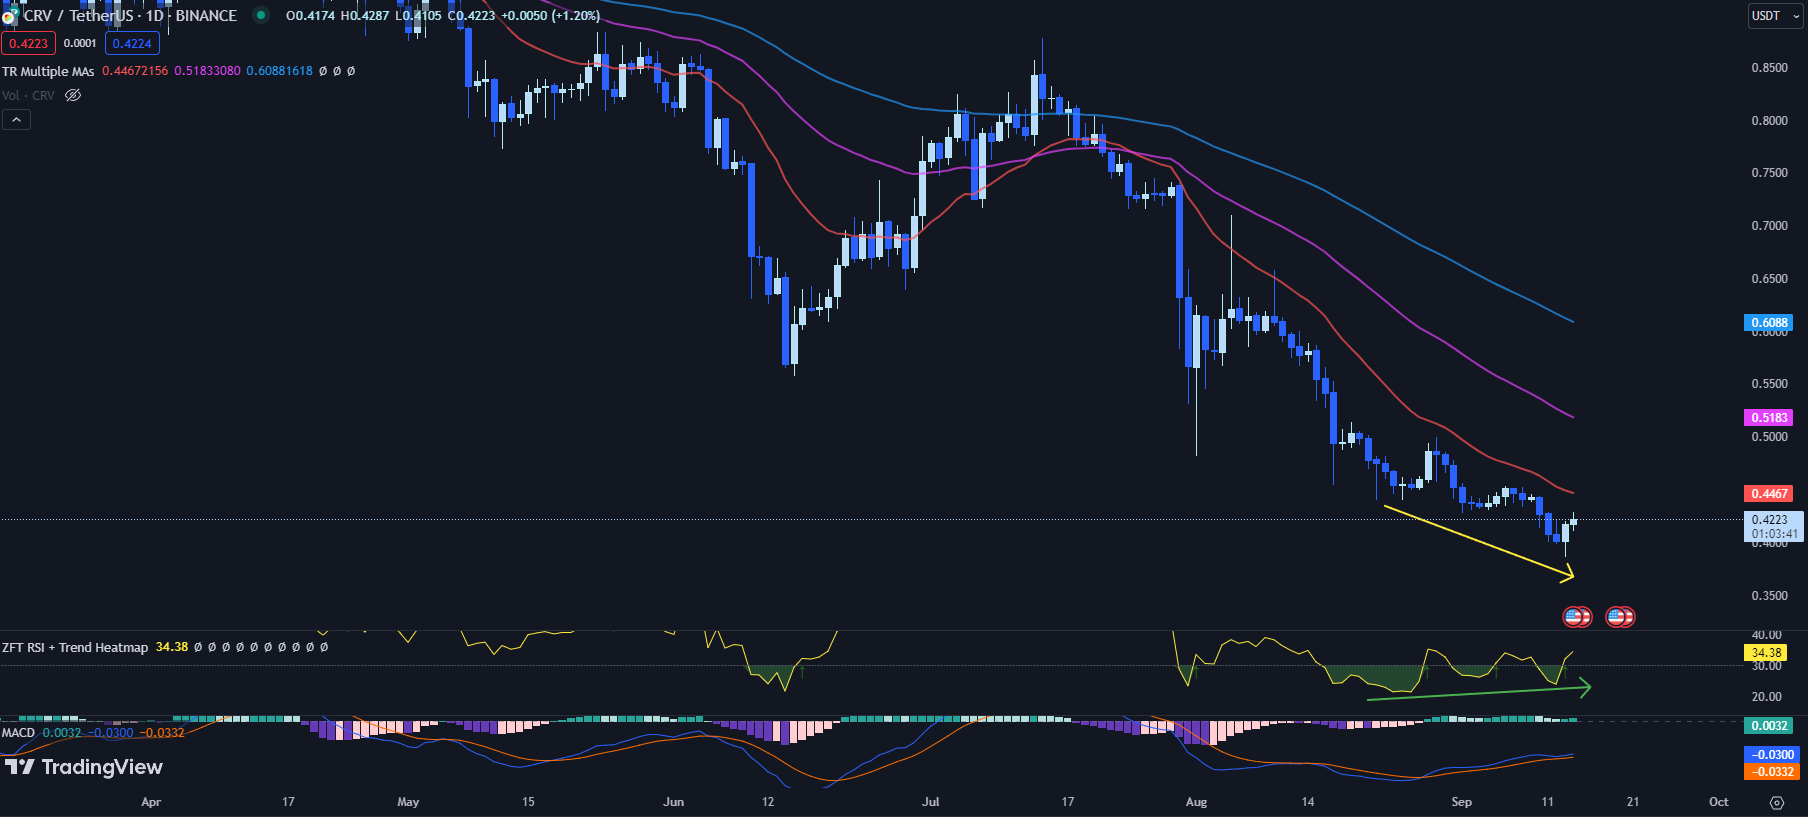
Despite heavy bearish momentum over the last two months, Curve DAO (CRV) is exhibiting early signs of a potential bullish reversal with momentum oscillators like the RSI and MACD histogram diverging positively from price.
The 20-day, 50-day, and 100-day EMA readings for CRV stand at $0.4467, $0.5183, and $0.6088 respectively. Their wide separation underscores the prevailing bearish trend.
However, the situation could soon take a turn. The current price of CRV, at $0.4223, is already displaying a subtle upward nudge of 1.20% so far today.
CRV’s RSI has moved up to 34.38 from yesterday’s 31.97. This is a notable development as it shows a bullish divergence, where the RSI is ascending while prices are still declining.
This is often a precursor to a possible price rebound, which, if materialized, could signify a much-anticipated recovery for CRV.
The MACD histogram has also seen a positive shift, moving up to 0.0032 from yesterday’s 0.0025. This uptick is another hint of increasing bullish momentum.
However, it’s not all smooth sailing ahead. The immediate resistance for CRV is the 20-day EMA of $0.4467. CRV will need to break past this resistance to validate the potential bullish reversal.
On the flip side, an immediate swing low support exists between $0.3865 to $0.4016. A break below this support level could disrupt any hopes of immediate recovery for CRV, pushing it back into bearish territory.
While the bearish trend has been the dominant narrative for CRV in recent times, current technical indicators suggest a potential recovery may be in the offing.
However, investors are urged to proceed with caution, keeping a keen eye on these key indicators and adjusting their strategies accordingly. Cryptocurrency trading is, after all, a game of strategy, patience, and resilience.
Disclaimer: Crypto is a high-risk asset class. This article is provided for informational purposes and does not constitute investment advice. You could lose all of your capital.