Bitcoin Bulls Brace For Breakout Towards $40,000 as This Bullish Technical Pattern Forms – Where Next for the BTC Price?


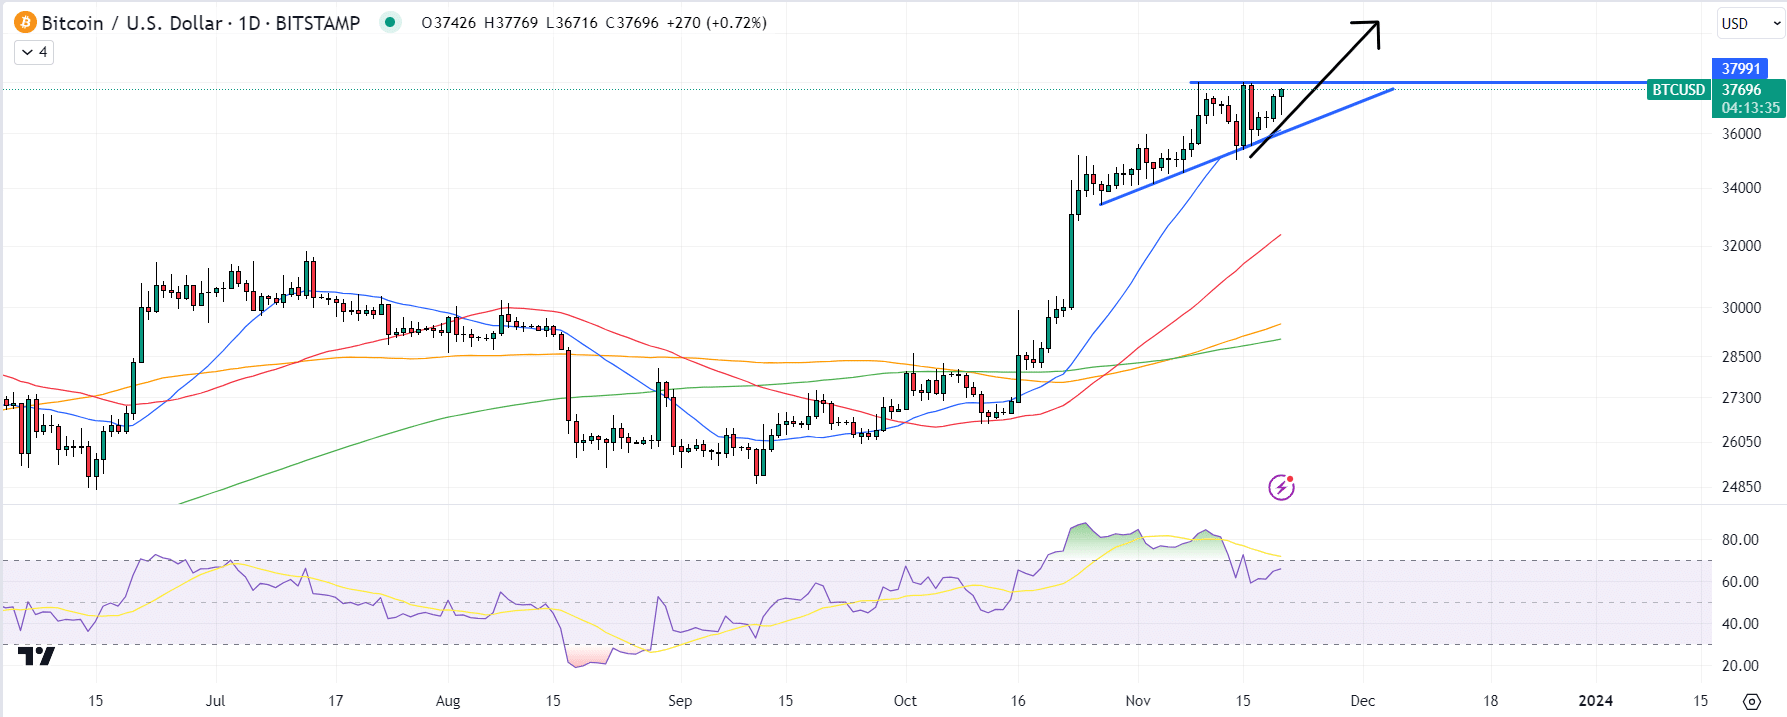
Bitcoin bulls are bracing for another leg higher in the market and a potential challenge of the psychologically important $40,000 level in light of the recent formation of a bullish short-term technical pattern called an ascending triangle.
The BTC price was last in the $37,600s, having experienced some intra-day chop on Monday on reports that the US Department of Justice and Binance are nearing a multi-billion-dollar settlement to end a criminal investigation into the crypto exchange.
But with the macro trading environment a clear tailwind for crypto right now – US stocks are rising again and US government bond yields and the US dollar are falling on bets the Fed will be cutting interest rates next year – and amid ongoing optimism about near-term spot Bitcoin ETF approvals, BTC price risks seems strongly tilted towards the upside in the coming days and weeks.
Bitcoin’s ascending triangle formation compliments this short-term bullish view.
The cryptocurrency has been supported by an uptrend going back to late October and found strong support at its 21DMA last week.
However, upside has so far been capped by resistance at the $38,000 level.
But multiple tests of this level mean the sellers (mostly investors taking profit in wake of recent gains) might finally be exhausted, setting the stage for another leg higher in the market.
Bitcoin’s 14-Day Relative Strength Index (RSI), which indicates how overbought or oversold the market has become, has recently fallen back into neutral territory after signaling overbought conditions for a few weeks.
That suggests there is room for buying pressure to build up once again, suggesting a break above $38,000 could have legs.
One potential on-chain signal that could push back against the bullish short-term narrative is that BTC token inflows to exchanges have picked up in recent weeks since Bitcoin pushed above $35,000, suggesting more profit-taking may lay ahead.
But those conditions were seen for much of February through to May and didn’t ultimately stop the BTC price from pushing higher.
Where Next for Bitcoin (BTC)?
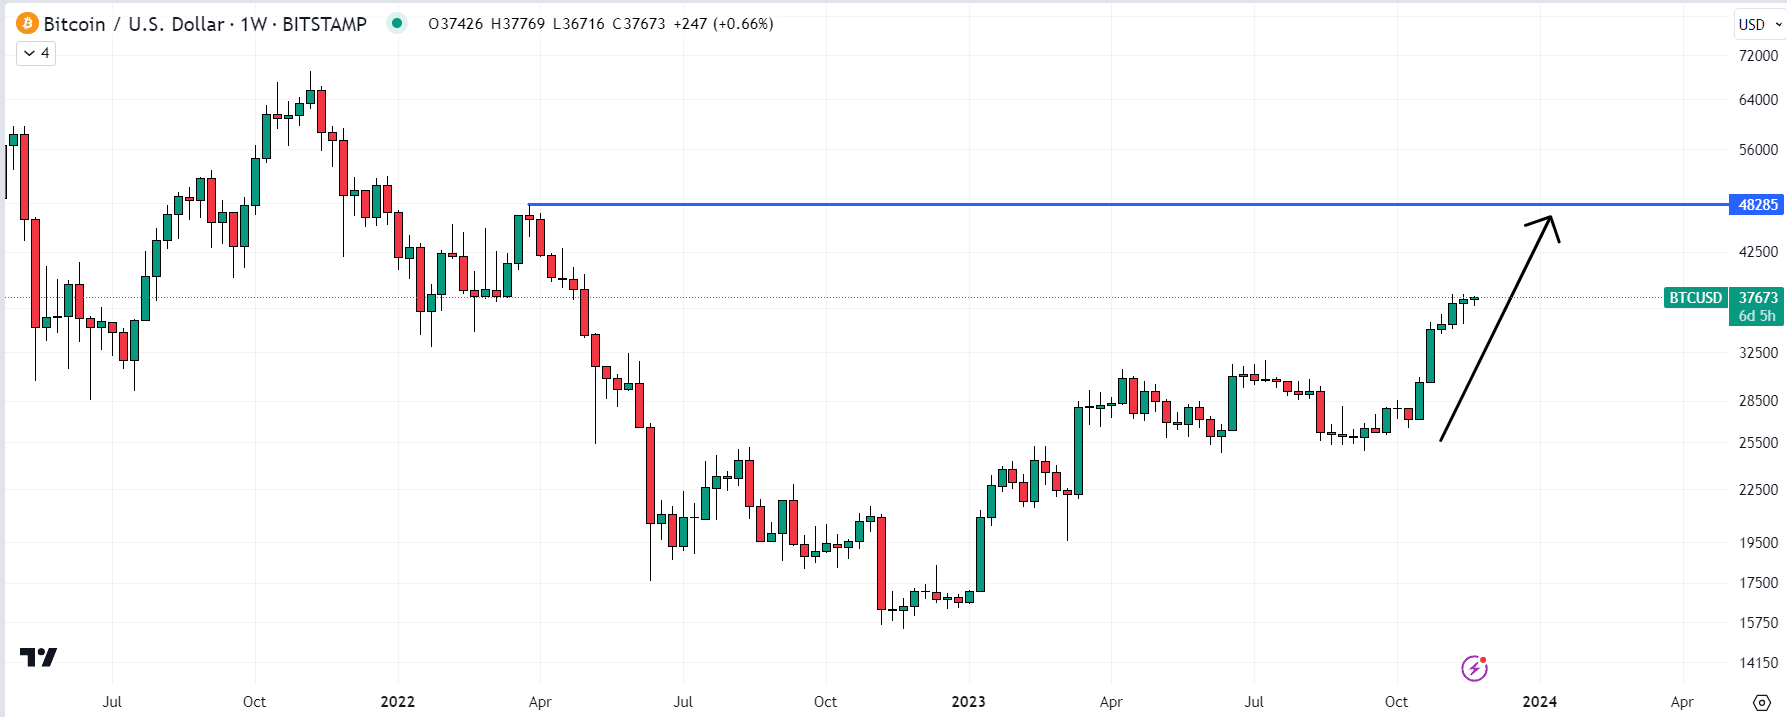
If Bitcoin is to break convincingly above $38,000, the next natural target is a quick test of $40,000 for the first time since April 2022.
Once that key psychological level is broken, there aren’t any major technical hurdles before the 2022 highs at $48,200.
With macro seemingly about to turn into a major tailwind for Bitcoin, assuming US economic data continues to signal economic cooling and the room for near-term rate cuts, with spot Bitcoin ETF approvals close and with the Bitcoin inflation rate about to halve in April 2024, there are plenty of bullish narratives to support further near-term upside in the crypto market.
Meanwhile, according to analysis by Matrixport, if Bitcoin is already up by over 100% at this stage of the year, there is a 71% chance that the cryptocurrency will finish the year at even higher levels, with year-end rallies averaging around 65%.
“Based on these statistics, bitcoin continues to offer upside potential, and a +65% year-end rally would lift prices back to $56,000,” Matrixport’s head of research Markus Thielen noted.
- Perplexity AI Predicts XRP Will Hit This XRP Price by End of 2026
- Microsoft Copilot AI Predicts Insane XRP Price by End Of 2026
- Sam Altman ChatGPT AI Predicts Insane SpaceX Stock Price by End of 2026
- Google Gemini AI Predicts Shocking Bitcoin Price by End of 2026
- XRP Price Prediction: Key Metrics Point to a Crash
2M+
250+
8
70


- Perplexity AI Predicts XRP Will Hit This XRP Price by End of 2026
- Microsoft Copilot AI Predicts Insane XRP Price by End Of 2026
- Sam Altman ChatGPT AI Predicts Insane SpaceX Stock Price by End of 2026
- Google Gemini AI Predicts Shocking Bitcoin Price by End of 2026
- XRP Price Prediction: Key Metrics Point to a Crash
More Articles

