Bitcoin and Ethereum Price Prediction as BTC Dips Below $40,000 and ETH Struggles to Hold $2,200
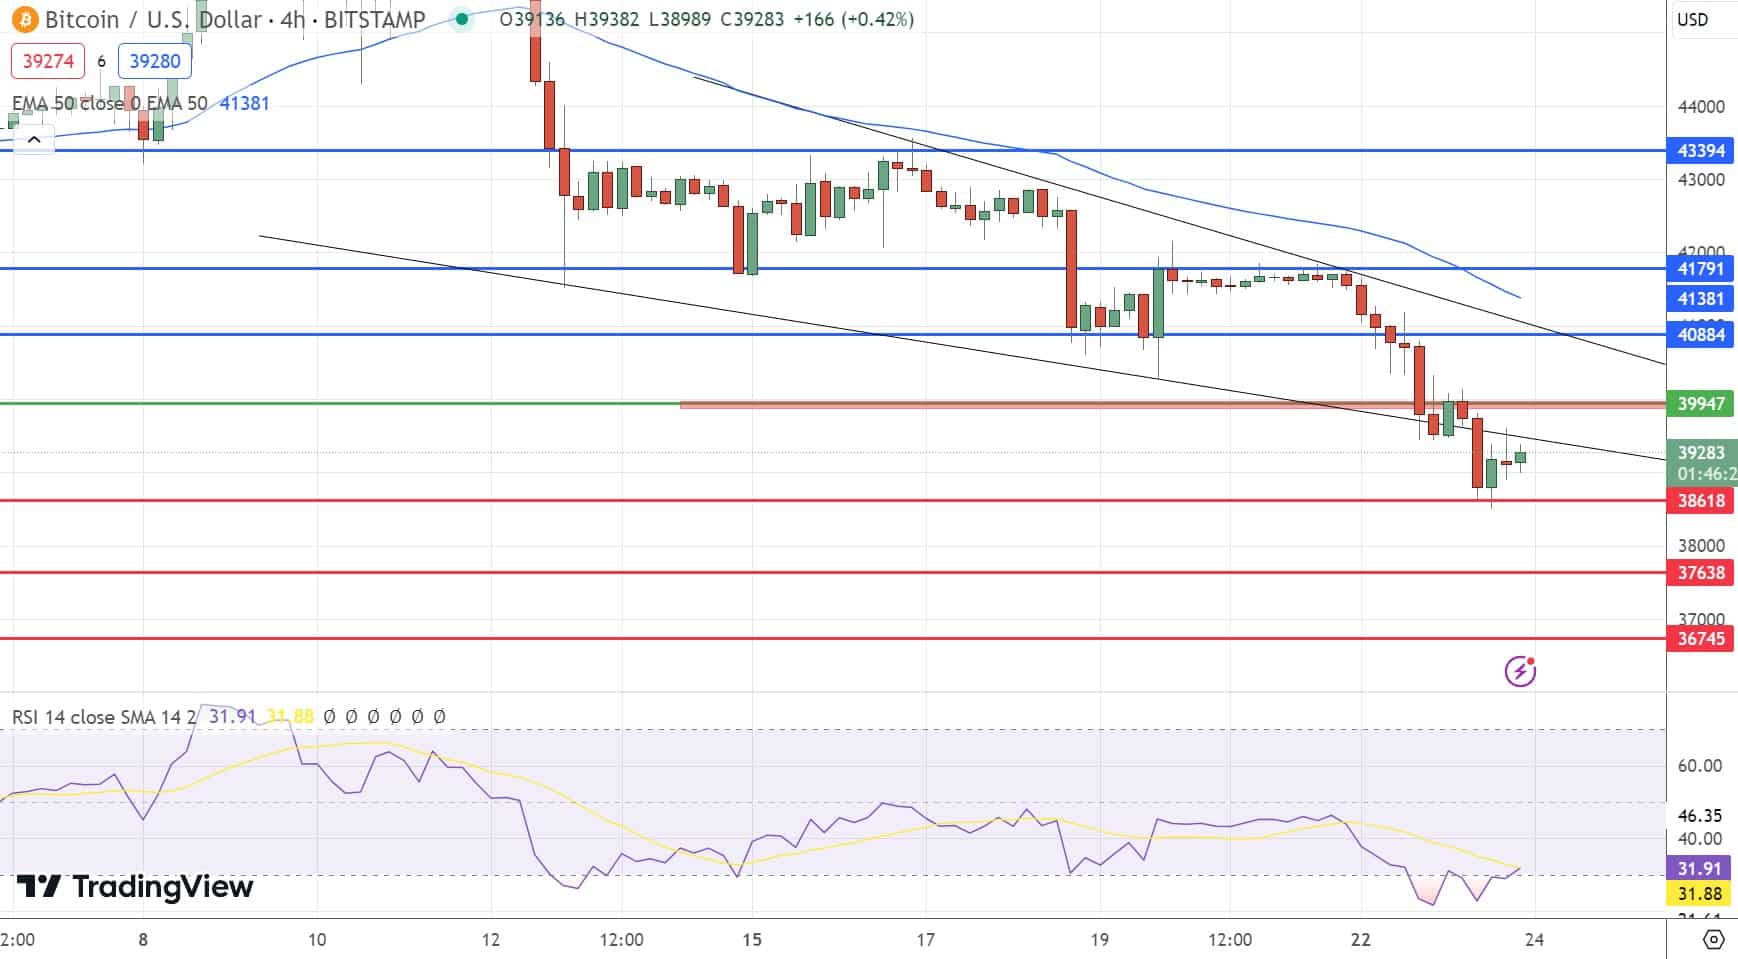
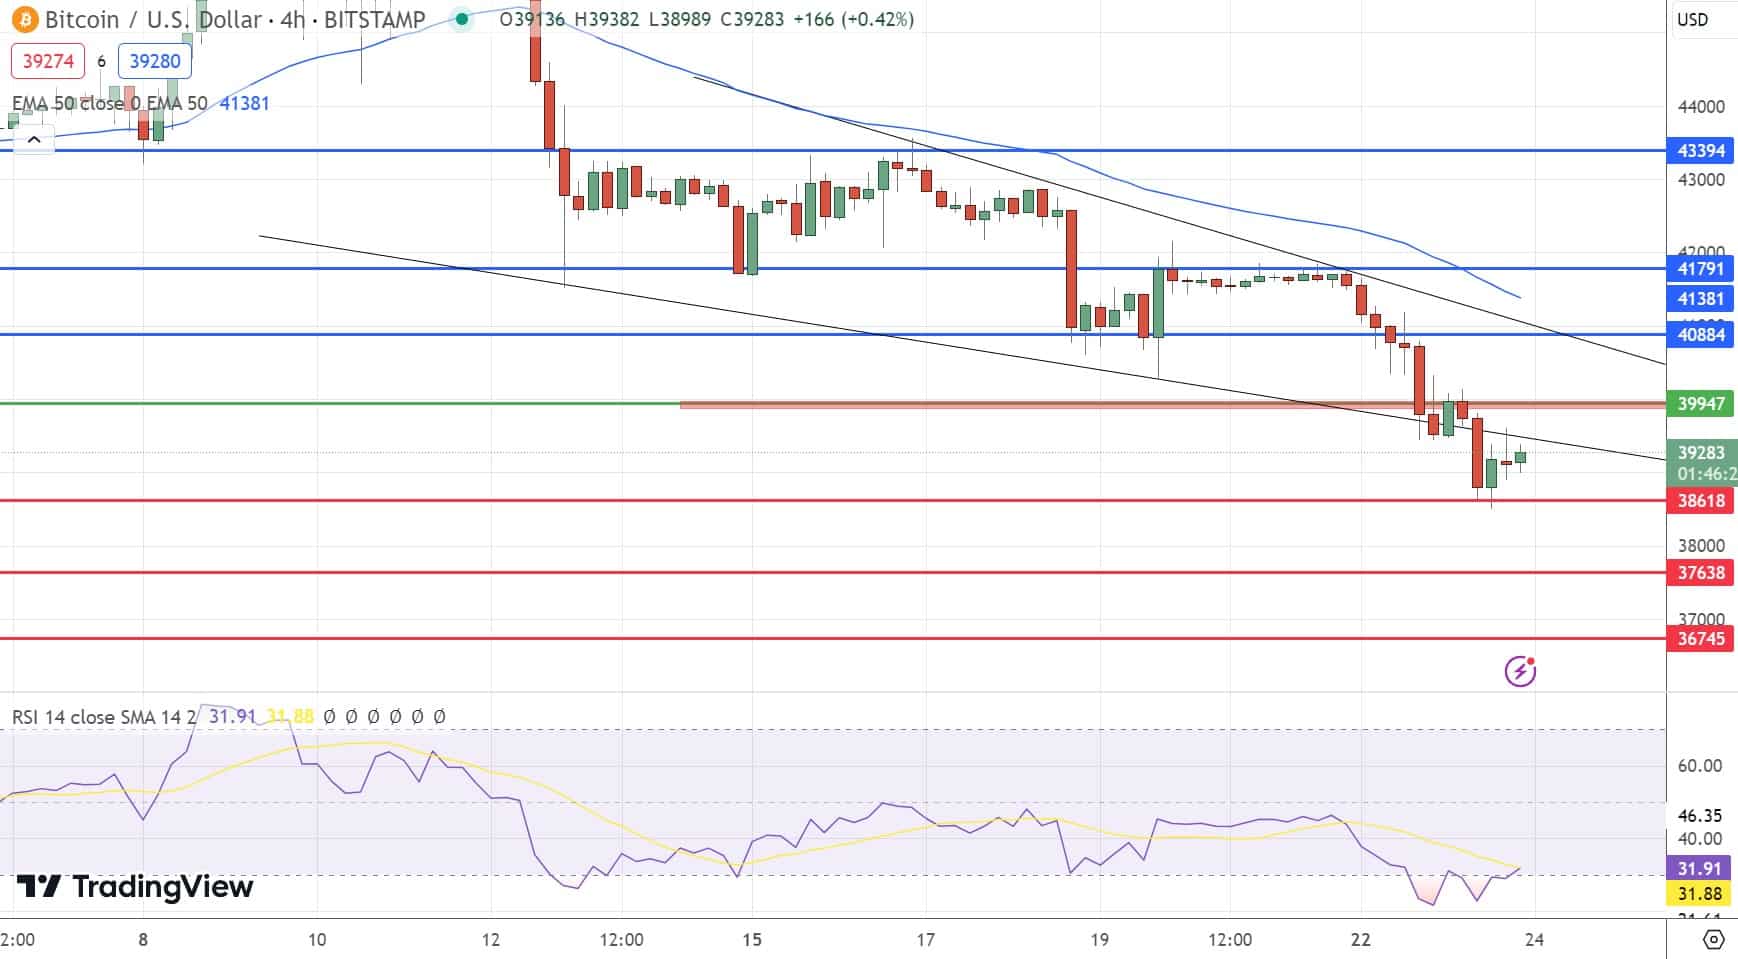
Bitcoin, the foremost digital currency, witnessed a notable dip below the critical $40,000 mark, briefly falling to around $39,500. This decline has been linked to substantial Bitcoin sales, notably influenced by the Grayscale GBTC Bitcoin ETF, fueling concerns about a possible further descent to the $38,000 level.
Bitcoin has fallen about 20% since the Jan. 11 launch of the first ETFs funds investing directly in the token https://t.co/3jGyNKrvfT
— Bloomberg Markets (@markets) January 23, 2024
Concurrently, Ethereum, another major player in the crypto arena, is grappling with its own bearish momentum, having fallen to $2,347, marking a significant 24-hour drop of nearly 3%.
These movements come amidst a broader market context where Bitcoin has seen over a 20% decline since the launch of the first exchange-traded funds (ETFs) by major firms like BlackRock and Fidelity.
#BTC looks ready for bounce imo👀
I’m expecting bounce from here cause most important liquidity levels got hit last night 💯
In most worst case we can see $37K-$38K, hope this will not happen.. Then pump imminent for me 👊
Just sharing my own thoughts with you guys.. it’s… pic.twitter.com/lkkQ6ell9L
— ᴡʜᴀʟᴇ ᴏғ ᴄɪᴛʏ 🐳 (@Whale_Of_City) January 23, 2024
This decline, from a high of $49,021 on the ETFs’ debut to a current standing of $38,975, reflects a complex interplay of factors including market sentiment, institutional actions, and broader macroeconomic conditions.
Bitcoin’s Price Decline: Miner Stress and Institutional Dynamics
Bitcoin (BTC) recently experienced a notable downturn, slipping below the $40,000 support and sparking market concerns. This correction not only rattled holders but also posed challenges for BTC miners.
Over the past 24 hours, miners faced financial struggles with transaction fees hitting their lowest since June 2022. The pressure on miners may lead to selling, adding downward momentum to Bitcoin’s price.
Bitcoin's average transaction fee hits $6.85, surging 35.5% from yesterday & a massive 448% YOY. Miners face a challenge as fees climb. #BitcoinFee #CryptoMining #MarketTrends pic.twitter.com/TVGRA4z5qg
— Arslan Ali (@forex_arslan) January 23, 2024
In the brighter side, institutional players are strategically accumulating BTC, reflecting confidence in its long-term value. However, this could impact short-term market dynamics and potentially concentrate BTC ownership.
Changes in address numbers and the long/short ratio hint at evolving market sentiment, while increased network activity offers stability.
Consequently, this news of Bitcoin’s dip below $40,000 pressures miners with low transaction fees, potentially deepening the price decline amid institutional accumulation.
Google Bard’s Forecast: Bitcoin’s Potential Slide to $35,000 in Current Market
Insights from Google’s AI, Google Bard, suggest Bitcoin could further decline to $35,000, influenced by inflation, interest rates, and regulatory factors.
However, potential uplifts from block reward halving, rising demand, institutional adoption, and positive developments may facilitate recovery.
#Bitcoin: Google Bard forecasts a critical juncture for Bitcoin: Regulatory headwinds and macro pressures could push prices below $38K, while the April halving and institutional adoption may reignite the climb. #BitcoinPrediction #GoogleBardForecast #CryptoEconomy #BitcoinHalving pic.twitter.com/33WpZ4VDJk
— Arslan Ali (@forex_arslan) January 23, 2024
With Bitcoin’s current position just under $39,000, Google Bard indicates a possible stagnation with prices oscillating between $35,000 and $45,000 as market forces collide.
Amidst these fluctuations, investors are advised to proceed with caution.
Bitcoin Price Prediction
Top 15 Cryptocurrencies to Watch in 2023
Stay up-to-date with the world of digital assets by exploring our handpicked collection of the best 15 alternative cryptocurrencies and ICO projects to keep an eye on in 2023. Our list has been curated by professionals from Industry Talk and Cryptonews, ensuring expert advice and critical insights for your cryptocurrency investments.
Take advantage of this opportunity to discover the potential of these digital assets and keep yourself informed.
Disclaimer: Cryptocurrency projects endorsed in this article are not the financial advice of the publishing author or publication – cryptocurrencies are highly volatile investments with considerable risk, always do your own research.


