


Best Crypto to Buy Now September 22 – ApeCoin, Stellar, Litecoin


Binance is pushing back on a lawsuit filed against it by the Securities and Exchange Commission (SEC) in its own legal filing made on September 21.
In the legal filing, Binance and its founder Changpeng Zhao allege the SEC has overstepped its authority and failed to provide regulatory clarity for the crypto industry before taking action against the company.
Considering these recent developments with Binance, what is the best crypto to buy now?
The 60-page petition accused the SEC of attempting to retroactively impose its control over the crypto market by distorting securities laws.
It stated that the SEC is unlawfully seeking to extend its jurisdiction globally to transactions on foreign cryptocurrency platforms.
Binance Holdings and Zhao contend that the SEC lacks the authority to impose liability for crypto asset sales dating back to July 2017, before the agency offered public guidance on digital assets.
They argue the SEC has no legitimate power over cryptocurrency exchanges and have asked for the claims to be dismissed entirely.
The SEC filed suit against Binance, its affiliates, and Zhao in June, alleging the unlawful offer and sale of unregistered securities.
The complaint also claimed that billions in customer funds were comingled into an account controlled by Zhao.
Since then, the SEC has increased pressure on Binance, citing a lack of transparency. A stipulation of a recent deal prevented Zhao from accessing U.S. customer funds.
The regulatory scrutiny has substantially decreased trading activity on the Binance U.S. exchange.
Volumes have dropped over 98% since September, and a third of Binance.US staff were laid off this month, including its CEO.
The outcome of the dismissal motion remains uncertain as the legal battle between the SEC and Binance continues.
Both sides await the court’s ruling on the complex issues surrounding cryptocurrency regulations.
Following rejection at the 100-day EMA and a slide over the last two days, Bitcoin looks to have established a floor above the 20-day exponential moving average as it currently trades at $26,629, up by 0.22% so far today.
The total cryptocurrency market capitalization is also in the green, up 0.27% to $1.035 trillion.
While Bitcoin shows signs of stabilization after recent declines, other cryptocurrencies like Apecoin, Wall Street Memes, Stellar, Bitcoin BSC, and Litecoin are making their case as the best crypto to buy now thanks to their robust fundamentals and/or upbeat technical analyses.
ApeCoin (APE) Price Consolidates: Will Support Hold or Further Drop?
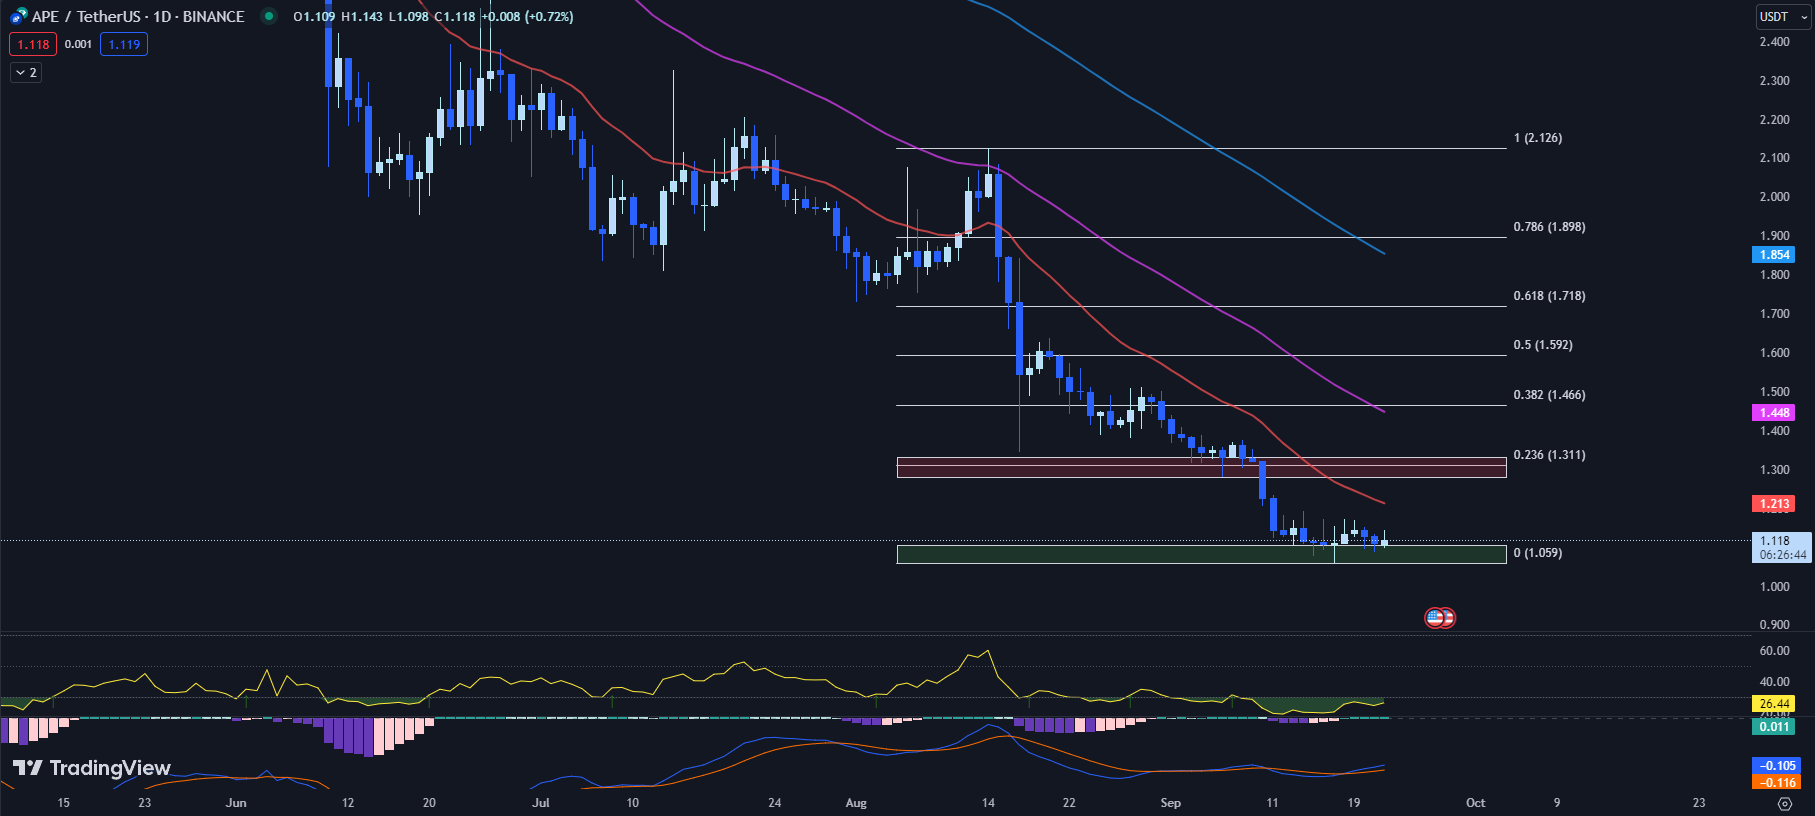
The APE price continues its consolidation above the immediate support level, showing some stability after setting a new all-time low of $1.059 on September 17. ApeCoin (APE) has remained in oversold territory for the past two weeks.
Despite this, there is keen interest in whether the support level will maintain and trigger a potential bounce for the APE price, or if a further drop is on the horizon.
The APE price’s technical indicators paint a comprehensive picture. The 20, 50, and 100-day EMAs of ApeCoin stand at $1.213, $1.448, and $1.854 respectively.
These figures indicate a downward trend in the medium to long term, suggesting that the APE price has been under persistent selling pressure.
APE’s RSI has been below 30 for two weeks now, indicating that ApeCoin is oversold. Yesterday’s RSI of 24.47 has slightly increased to 26.44 today. Historically, an RSI below 30 often signals a potential price reversal, as it suggests that the asset is being undervalued.
The MACD histogram for APE is currently at 0.011, a slight increase from yesterday’s 0.009. While the MACD is in positive territory, indicating a slightly bullish sentiment, this bullish signal should be viewed with caution.
The MACD line is not yet firmly established in positive territory and could easily cross into negative territory with further downward price movement. Other technical indicators are also painting a bearish picture for APE.
A consolidation of the MACD line above zero and improvement in other indicators would be needed to give stronger confidence in a potential bullish trend reversal.
In terms of volume and market cap, ApeCoin’s market cap has increased by 0.72% to $412.1 million, while the 24-hour trading volume has declined by 24.01% to $35.5 million.
This decrease in trading volume could mean fewer traders are willing to sell at current prices, possibly indicating a slowdown in selling pressure.
The APE price is currently at $1.118, up by 0.72% so far today. Though it’s facing immediate resistance at the 20-day EMA of $1.213, a more significant resistance zone lies between $1.280 and $1.333, converging with the reverse Fib 0.236 level of $1.311.
ApeCoin is currently testing support in the $1.059 to $1.107 zone. This area represents a critical technical level, as a breakdown below could trigger increased selling momentum.
If ApeCoin is unable to find buying interest in this zone, it risks entering price discovery mode to the downside with no clear support levels underneath.
On the flip side, if ApeCoin can hold support here and stage a rebound, it would be a positive technical signal and could spark an upside price reversal.
Bulls will want to see strong buying volume come in to defend this area and prevent a breakdown.
The ability of ApeCoin to hold above $1.059-$1.107 in the sessions ahead will give important clues as to whether the recent downtrend will continue or if the bears may be losing control.
Meme Kombat: The Tokenized Arena Game That Combines Memecoin Nostalgia and P2E Gaming
The best crypto to buy now often combines multiple popular concepts into one.
That’s the case with the newly launched presale for Meme Kombat – a new meme coin that merges play-to-earn gaming, staking rewards, and meme coin nostalgia all in one decentralized application.
Meme Kombat’s token presale for $MK quickly grabbed the attention of key players in the crypto industry, including the large Crypto Whale Pumps group on Telegram.
Meme Kombat seeks to differentiate itself from other meme coins that spike and crash by building a tokenized gaming platform with long-term appeal.
Players can battle characters modeled after popular meme coins and wager $MK tokens on match outcomes.
Beyond betting, users can stake $MK to earn yields of up to 112% APY paid in additional tokens. The more a user engages on the platform, the higher their staking rewards. Of the 12 million $MK supply, 30% is allocated to staking payouts.
The project is led by Matt Whiteman, Chief Operations Officer of NFT analytics platform North Technologies. The team plans to reveal itself fully over time and has passed a smart contract audit by Coinsult.
Meme Kombat’s roadmap includes launching its full platform in Q4 2022 after the presale concludes, then introducing leaderboards, new battles, and rewards over seasons 1 and 2 in 2023.
With meme coins maintaining strength even amidst crypto winter, Meme Kombat offers a new twist by merging P2E gaming with meme coin nostalgia.
For those looking for the best crypto to buy now, Meme Kombat checks a lot of boxes.
Bearish Bias for Stellar (XLM) Price as it Breaks EMA Levels
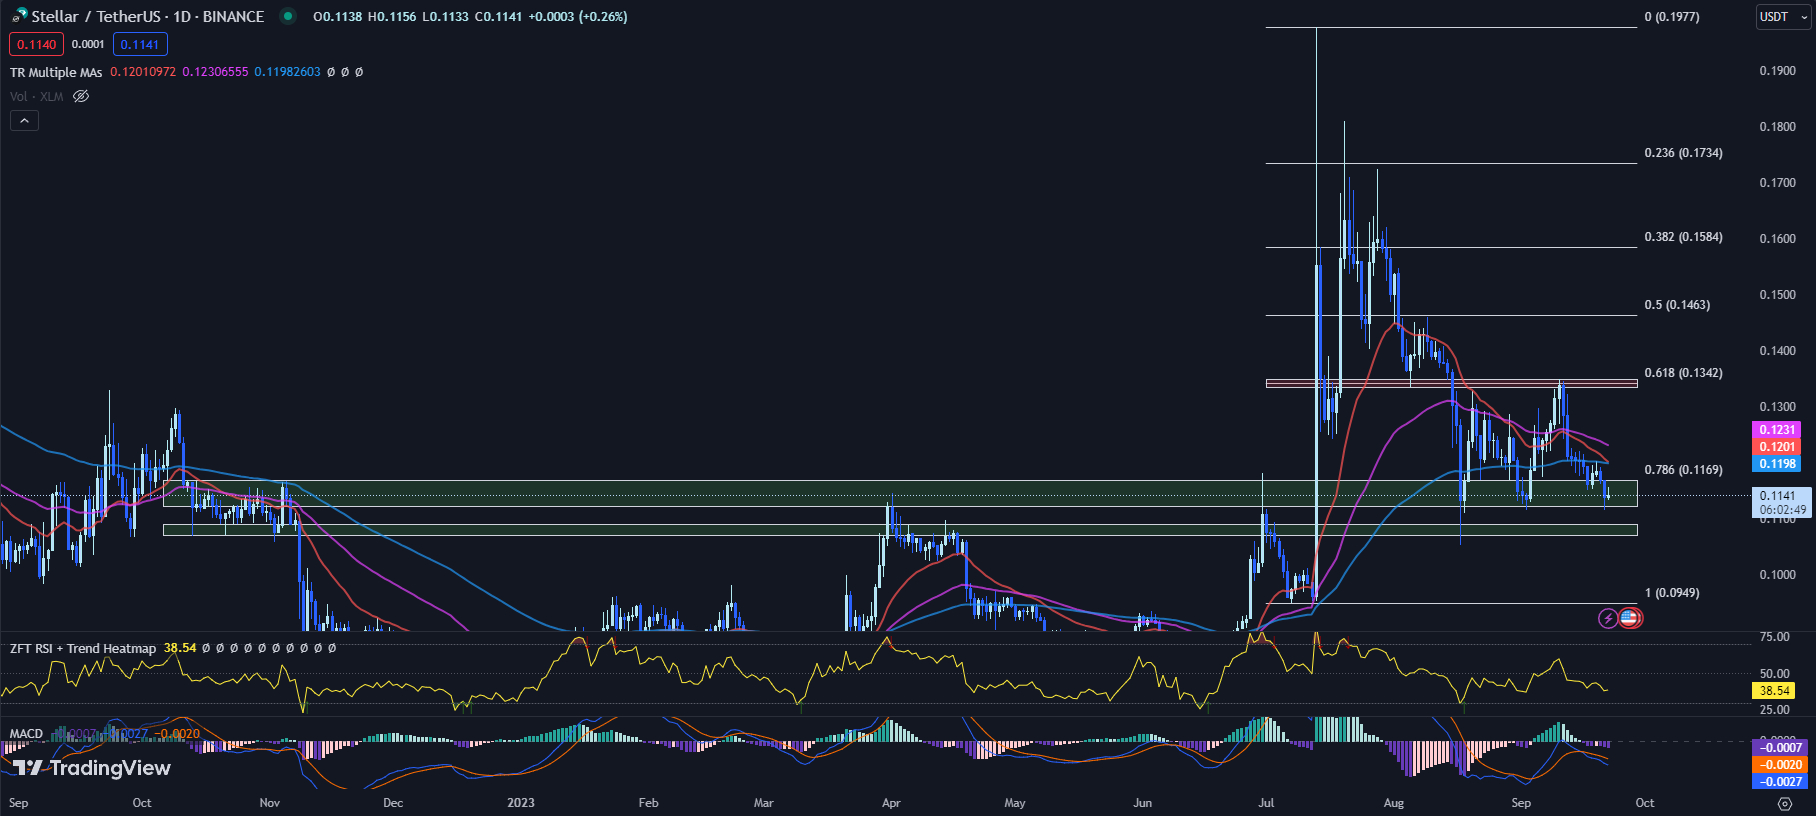
Stellar (XLM) has been on a prevailing downward trajectory after facing rejection from the Fib 0.618 level of $0.1342 on September 11.
The XLM price has broken down from key Exponential Moving Average (EMA) levels and is currently trading at a previously significant support zone.
This zone is in confluence with the Fib 0.786 level of $0.1169, creating a potential pivot point for the XLM price.
The XLM price’s technical indicators provide a deeper insight into the market conditions.
The 20, 50, and 100-day EMA for Stellar stand at $0.1201, $0.1231, and $0.1198, respectively. The XLM price is currently below these EMA levels, indicating a bearish bias in the medium term.
The RSI for the Stellar price is currently at 38.54, slightly up from yesterday’s 37.99. The RSI is currently in the neutral zone, though it is leaning towards the oversold territory.
A further decrease in RSI may indicate increased selling pressure, while a rebound could signal a potential recovery in the XLM price.
The MACD histogram remains unchanged from yesterday at -0.0007. The MACD is currently in negative territory, also signaling a prevailing bearish momentum.
Stellar’s market cap has increased slightly by 0.21% to $3.15 billion, while the 24-hour trading volume has significantly decreased by 52.40% to $49 million.
This decrease in trading volume suggests a slowdown in selling pressure and could potentially indicate a consolidation phase for the XLM price.
The current XLM price is $0.1141, showing a slight uplift of 0.26% so far today. The immediate resistance for Stellar is the 100-day EMA of $0.1198, closely followed by the 20-day EMA of $0.1201.
If the XLM price can break above these levels, it could potentially trigger a bullish reversal.
Stellar finds its immediate support at the horizontal zone of $0.1122 to $0.1168, which is also in confluence with the Fib 0.786 level of $0.1169.
If this support level fails to hold, the next potential support lies in the range of $0.1069 to $0.1089.
While the XLM price is currently showing signs of bearish momentum, the technical indicators suggest a potential for a bounce at the Fib 0.786 level.
Traders should closely monitor these levels and indicators to anticipate the next potential move for Stellar’s price.
Bitcoin BSC Presale Raises Over $4 Million; Best Crypto to Buy Now
As the cryptocurrency market remains in flux, Bitcoin BSC has carved out its own narrative.
The presale for this new BNB Smart Chain-linked cryptocurrency swelled to $4.44 million, inching closer to its soft cap of $6.063 million.
Bitcoin BSC seeks to bring the strengths of Bitcoin, including its brand recognition and scarcity, to the faster and less expensive Binance Smart Chain.
It utilizes a proof-of-stake model that rewards token holders for staking their coins, rather than Bitcoin’s energy-intensive proof-of-work mining.
Crypto analysts have taken notice of Bitcoin BSC’s rapid presale success. The pace has been described as “electrifying,” with over $300,000 added in just 10 hours on September 20.
Investors seem eager to get in early before the public listing, hoping for significant returns post-launch.
Beyond potential profits, Bitcoin BSC’s staking rewards are also attracting long-term investors. Token holders can earn annual yields as high as 117% by staking their coins.
The presale price of $0.99 mirrors Bitcoin’s price back in 2011, leading some to speculate whether Bitcoin BSC can emulate even a fraction of Bitcoin’s historic growth.
Of course, as with any cryptocurrency investment, rewards come with risks. However, Bitcoin BSC’s staking model and strategic launch on the Binance Smart Chain may provide advantages over other cryptocurrencies.
As the crypto market heads toward the 2024 halving and with positive forecasts for Bitcoin, analysts predict renewed mainstream interest in Bitcoin and related cryptocurrencies like Bitcoin BSC.
Resistance Zone Ahead: Can Litecoin Break Through?
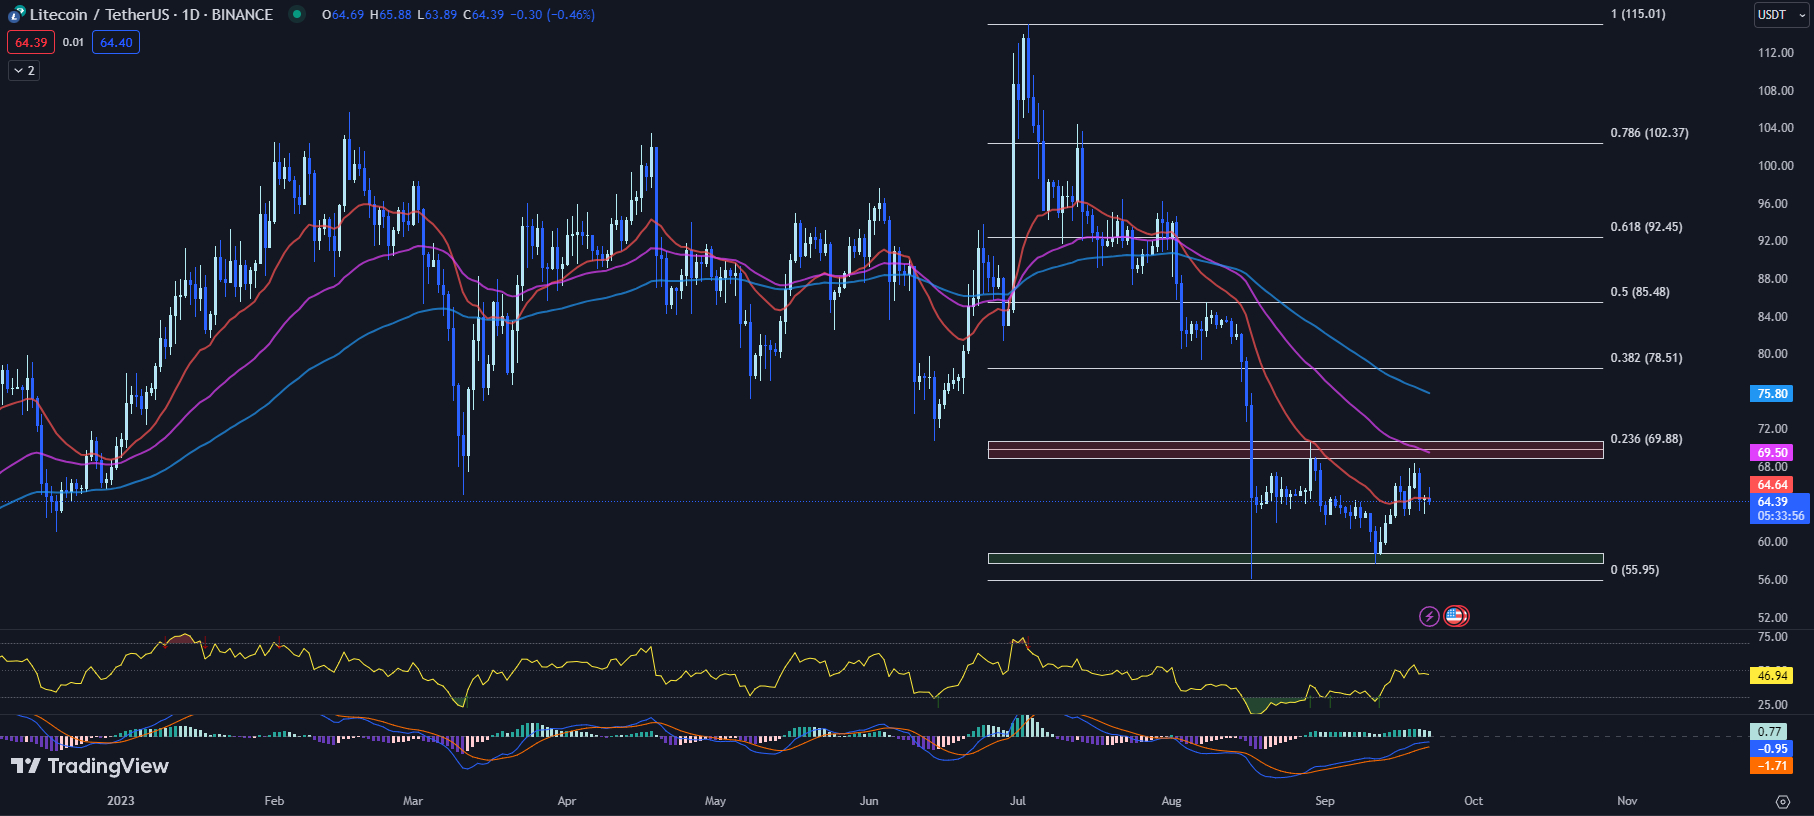
Litecoin (LTC) has been in a period of consolidation for the past 35 days. The LTC price is currently testing the 20-day EMA for support.
A close below this level could potentially trigger a retest of its range low support between $57.74 to $58.83.
The 20, 50, and 100-day EMAs for Litecoin currently stand at $64.39, $69.50, and $75.80, respectively.
The LTC price is currently at the same level as the 20-day EMA, indicating a critical point for the cryptocurrency.
If the LTC price manages to hold above this dynamic support zone, it could indicate a possible bullish reversal. However, a close below this level might suggest a continuation of the downtrend.
LTC’s RSI is currently at 46.94, slightly down from yesterday’s 47.68. This suggests that the selling pressure and buying pressure are almost balanced, and the LTC price is in a state of consolidation.
The MACD histogram is currently at 0.77, down from yesterday’s 0.88. This suggests a decrease in bullish momentum for the LTC price.
Traders should watch this indicator closely because a further decline might signal an increase in bearish momentum.
Currently, the LTC price stands at $64.39, down by 0.46% so far today. The LTC price faces immediate resistance in the horizontal zone of $68.88 to $70.70.
This resistance zone is also in confluence with the Fib 0.236 level of $69.88 and the 50-day EMA of $69.50.
A break above this resistance zone might indicate bullish momentum for the LTC price.
On the downside, the immediate support for the LTC price is the 20-day EMA at $64.39, where it is currently trading.
If the LTC price closes below this level, it could potentially retest the next support zone of $57.74 to $58.83.
The LTC price is at a pivotal point, and the outcome of the 20-day EMA will likely play a role in determining the future direction of the LTC price.
Traders should keep a close eye on these levels and the technical indicators to anticipate the next potential move for Litecoin.
Disclaimer: Crypto is a high-risk asset class. This article is provided for informational purposes and does not constitute investment advice. You could lose all of your capital.


