Best Crypto to Buy Now 31 July – Optimism, Compound, Bitcoin Cash


Bitcoin’s price plunged under the psychologically significant support level of $30,000 over the past week, reaching a close of $28,874 today.
The Federal Reserve’s decision to increase the rate by 25 bps on July 26 seems to have been largely shrugged off by Bitcoin, however.
As Bitcoin continues to consolidate, what are the best cryptos to buy now?
Additionally, the crypto market experienced a dull weekend, as it digested the disappointing figures released from the US Personal Consumption Expenditures (PCE) Index.
The Index fell short of the market’s forecasted figures, maintaining the subdued mood of crypto enthusiasts.
Bitcoin is exchanging hands at around $29,250, recording a daily trade volume of approximately $11.8 billion – a spike of 56.08% so far today.
Bitcoin has been showcasing a consolidated performance above the Fib 0.382 level at $29,137 over the past week. This level seems to be currently acting as immediate support.
Meanwhile, it is struggling against the 50-day Exponential Moving Average (EMA) which has stubbornly acted as a ceiling to the Bitcoin price, marking a current resistance point at $29,357.
Bitcoin’s RSI is hovering at 43.53, within the negative territory. An RSI under 50 suggests that sellers may be exerting more influence in the market.
However, as it is not drastically below 30 – which is often interpreted as an oversold condition – it also indicates that the market isn’t severely bearish.
Despite a mild 0.14% downturn so far today, Bitcoin maintains its hold above the immediate support level at $29,137.
However, given the resistance imposed by the 50-day EMA, coupled with the unfavorable RSI and the positioning of the 20-day EMA, there could be increasing downward pressure in the immediate future.
Investors should consider closely monitoring Bitcoin’s price performance against the 50-day EMA resistance.
If the resistance at the 50-day EMA remains unbreached, the possibility of Bitcoin revisiting the support at the Fibonacci 0.382 level, or even potentially falling toward the 100-day EMA, cannot be ruled out.
In contrast, a convincing breach of the 50-day EMA might signal a potential bullish reversal, possibly pushing the price toward the 20-day EMA.
Bitcoin is currently experiencing an exceptional period of stability, with its volatility at an all-time low.
Many believe that this is a clear indication of the highly-anticipated Bitcoin halving event that is expected to shake up the cryptocurrency market.
With their solid fundamentals and optimistic technical indicators, Optimism, Wall Street Memes, Compound, IOTA20, and Bitcoin Cash are some of the best cryptos to buy now.
Optimism (OP) Reaches 2-Month High: Is It Time to Invest?
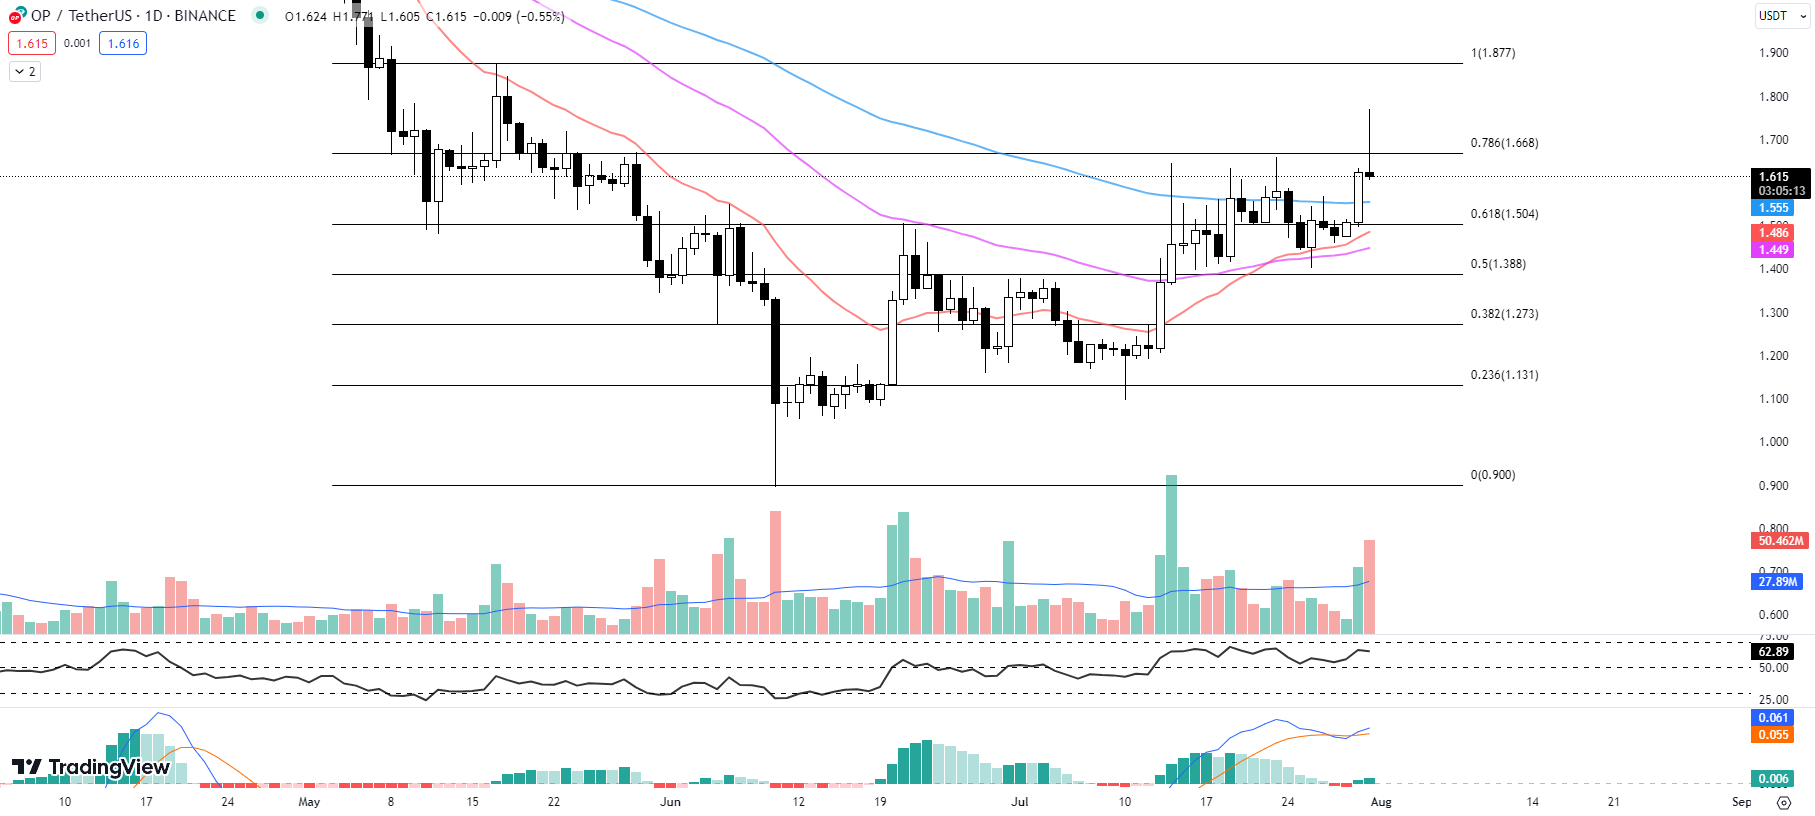
Observers of the market are captivated by the latest price action of Optimism (OP), which has taken an upward trajectory to reach a 2-month high of $1.771.
This bullish sentiment stems from the strong bounce of OP from the Fib 0.618 level at $1.504.
However, the momentum appears to have slowed down as OP faces resistance and undergoes a minor 0.55% price adjustment so far today to its current value of $1.615.
Taking a look at the technical indicators, the EMAs over 20, 50, and 100 days are currently $1.486, $1.449, and $1.555 respectively.
These figures suggest an overall bullish momentum, particularly with the current price sitting above all three EMAs.
The RSI currently sits at 62.89, slightly decreased from yesterday’s 63.78. This suggests a marginal cooling off from the recent bullish activity, yet it still signals moderate buying pressure.
The MACD histogram, another valuable tool for understanding price momentum, has also risen to 0.006 from yesterday’s 0.003, further corroborating the current bullish sentiment.
Despite this overall optimistic picture, it’s worth noting that the immediate resistance for OP lies at the Fib 0.786 level at $1.668.
While a breakthrough at this point would certainly signal a stronger bullish trend, investors should exercise caution given the recent selling pressure that pulled the price from its two-month high.
Meanwhile, the immediate support for OP lies at the 100-day EMA at $1.555, followed by the Fibonacci 0.618 level at $1.504.
These points serve as the safety nets in the event of a price drop and could be where OP may find some steadiness, should the selling pressure continue.
While Optimism (OP) has demonstrated substantial resilience and growth potential, the current technical indicators suggest that it may need to consolidate at the 100-day EMA before moving further.
FOMO No More: Wall Street Memes Presale Could Be the Best Crypto to Buy Now
Since its announcement on May 26, 2023, the Wall Street Memes presale has been the talk of the town for meme coin aficionados, and the turnout has lived up to the hype.
The $WSM token is quickly becoming a favorite among investors, with its price of $0.0325 per token in stage 26 of its presale.
The meme-based coin has already raised a considerable $18.87 million, attesting to its growing popularity in the crypto market.
Beyond the financial appeal, Wall Street Memes token holds a symbolic value in the crypto community.
This meme coin, which originated from the Reddit subculture that emerged after the unforgettable GameStop debacle in 2021, is designed to serve as both a speculative asset and a reward token for its committed community.
Meme coins may not have the same level of functionality as other cryptos, but they have proven themselves to be some of the most profitable assets during bull runs.
The rise of tokens like Dogecoin, Shiba Inu, and Pepe demonstrates how even small investments can lead to significant returns.
The WSM community is now setting its sights on replicating this success and capitalizing on the current crypto market recovery.
Wall Street Memes token is more than just a whimsical asset, it represents a move to “tokenize the movement.”
Wall Street Memes is not just another meme coin. With a large and dedicated community of over a million followers across different social media platforms, it has established a robust foundation that sets it apart from its competitors.
The Wall Street Memes presale is a great opportunity for those looking to get involved in the dynamic cryptocurrency market and potentially earn a profit.
COMP’s Short-Term Bearish Trend: Is It Here to Stay?
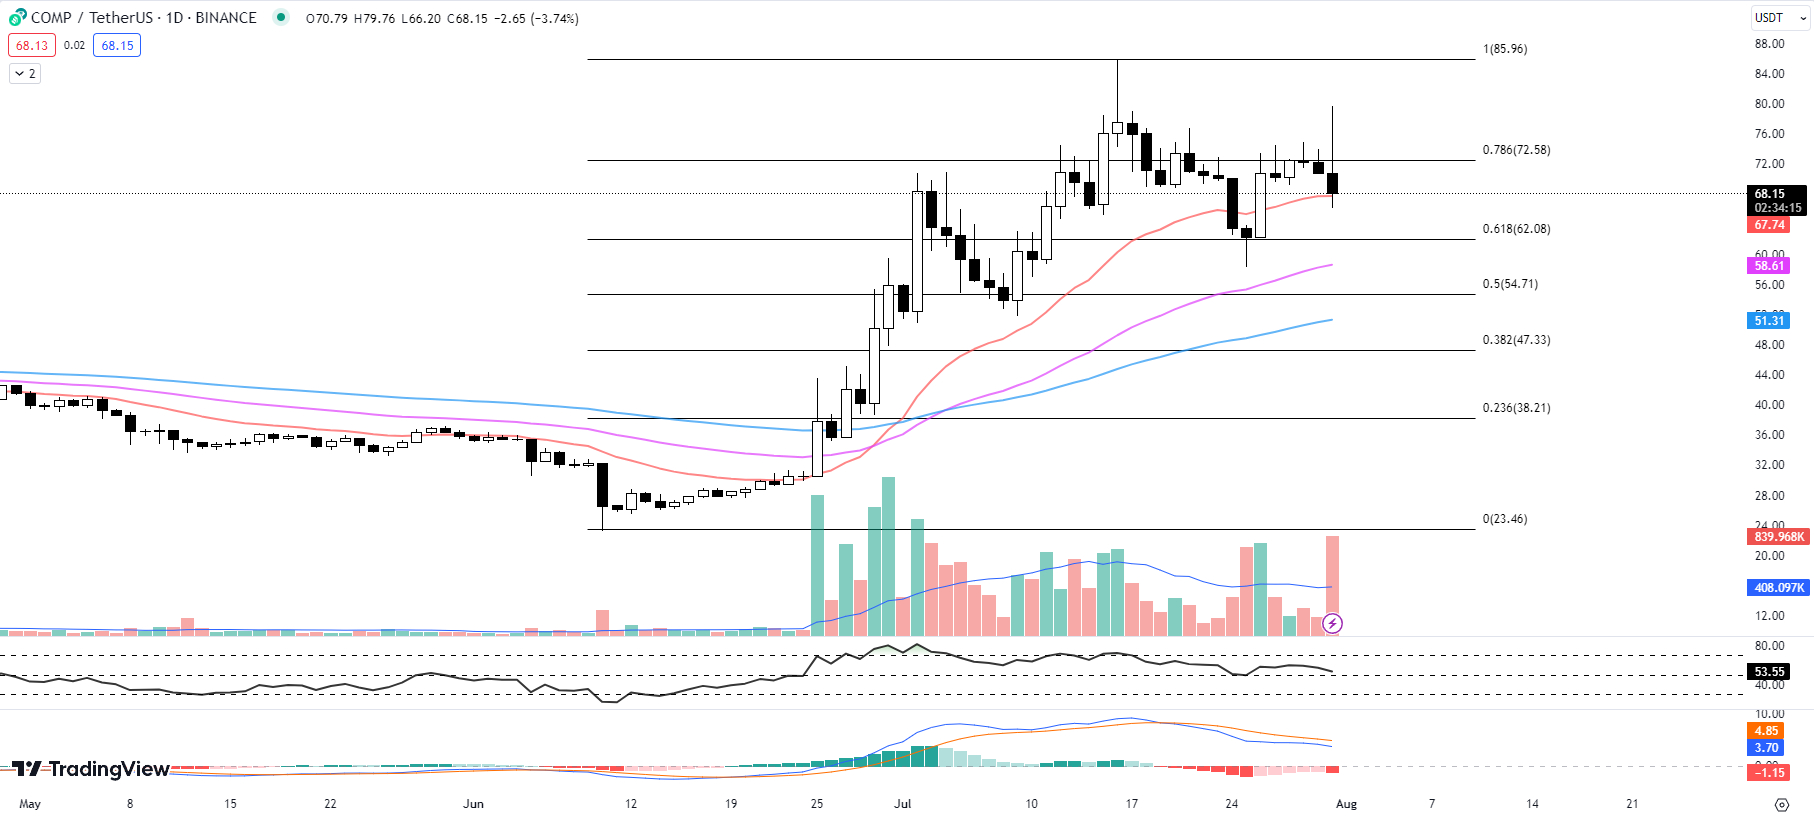
Despite achieving an intraday high of $79.76, COMP’s repeated rejections from the Fib 0.786 level at $72.58 for the past 10 days signal a strong resistance that traders need to consider.
The 20-day EMA for COMP currently sits at $67.74, above the current price of $68.15.
This may suggest a short-term bearish trend, as the price is currently below this key moving average.
However, the 50-day and 100-day EMA at $58.61 and $51.31, respectively, are well below the current price, which generally hints at an overall bullish trend in the medium to long term.
Further insights from the Relative Strength Index (RSI), which stands at 53.55 down from yesterday’s 57.31, point to a mild decline in buying pressure.
Although the RSI is not indicating oversold or overbought conditions, the decrease is a sign that buyers may be losing some momentum.
The MACD histogram, which is currently at -1.15, is down from yesterday’s -1, signaling an increase in downward momentum. This is a bearish signal that could indicate a further decline in COMP’s price in the immediate future.
The market cap is down to $520 million, a decrease of 6.63%, indicating that the market valuation of COMP is shrinking.
However, the trading volume is up to $231 million, an increase of 246.02%, which signifies that there has been a significant uptick in trading activity.
Increased trading volume, especially during a price decline, can sometimes hint at a possible trend reversal in the offing.
COMP currently has immediate support at the Fib 0.618 level at $62.08.
Should the price break this level, it could potentially lead to a more pronounced bearish trend.
However, if COMP manages to sustain above this level, there is a chance that the bearish trend may be short-lived, leading to a potential bounce back.
On the other hand, COMP’s inability to break past the resistance at the Fib 0.786 level at $72.58 paints a potentially bearish picture in the short term.
Traders should keep a close eye on how COMP interacts with this level. A successful break and close above this resistance could trigger a new bullish run.
Traders need to monitor the mentioned support and resistance levels, and the key technical indicators such as EMA, RSI, and MACD.
Despite the bearish short-term signs, the higher trading volume and price above the 50 and 100-day EMA could indicate potential medium to long-term bullish sentiment.
As always, traders should consider these insights while also incorporating their risk tolerance and trading strategies.
IOTA20: A Fresh Twist on a Classic, and Perhaps the Best Crypto to Buy Now
Cryptocurrency enthusiasts have a reason to be excited with the IOTA20 ($IOTA20) token presale now underway.
The token is available for purchase at $0.00145, a marked-down price compared to the current value of the original IOTA token ($0.17).
https://www.youtube.com/watch?v=7V-YEVRL0ZYMany are optimistic about the potential for IOTA20 to follow in the footsteps of IOTA’s success.
Early investors have an opportunity to benefit from the high growth potential of this promising project, with token prices currently more than 100 times lower than IOTA.
Half of the total token supply, equaling 1,389,530,282 $IOTA20, is up for grabs during the presale, opening a window for early investors to acquire a significant stake in the project.
The remaining 50% is allocated for staking rewards and Uniswap liquidity.
IOTA20 also introduces a simple staking mechanism, which will allow users of all experience levels to stake their tokens, secure the network, and earn recurring rewards.
Over 1.1 billion $IOTA20 tokens are set aside for these rewards, emphasizing the team’s focus on long-term holding.
IOTA20 strives to build upon the original IOTA framework and tackle its obstacles head-on.
By streamlining its complexities and addressing security vulnerabilities, the token is set to exceed its predecessor’s vision.
This, coupled with the developers’ commitment to transparency and community engagement, make IOTA20 one of the best cryptos to buy now.
Bitcoin Cash: A Breakthrough and a Re-test of 20-day EMA
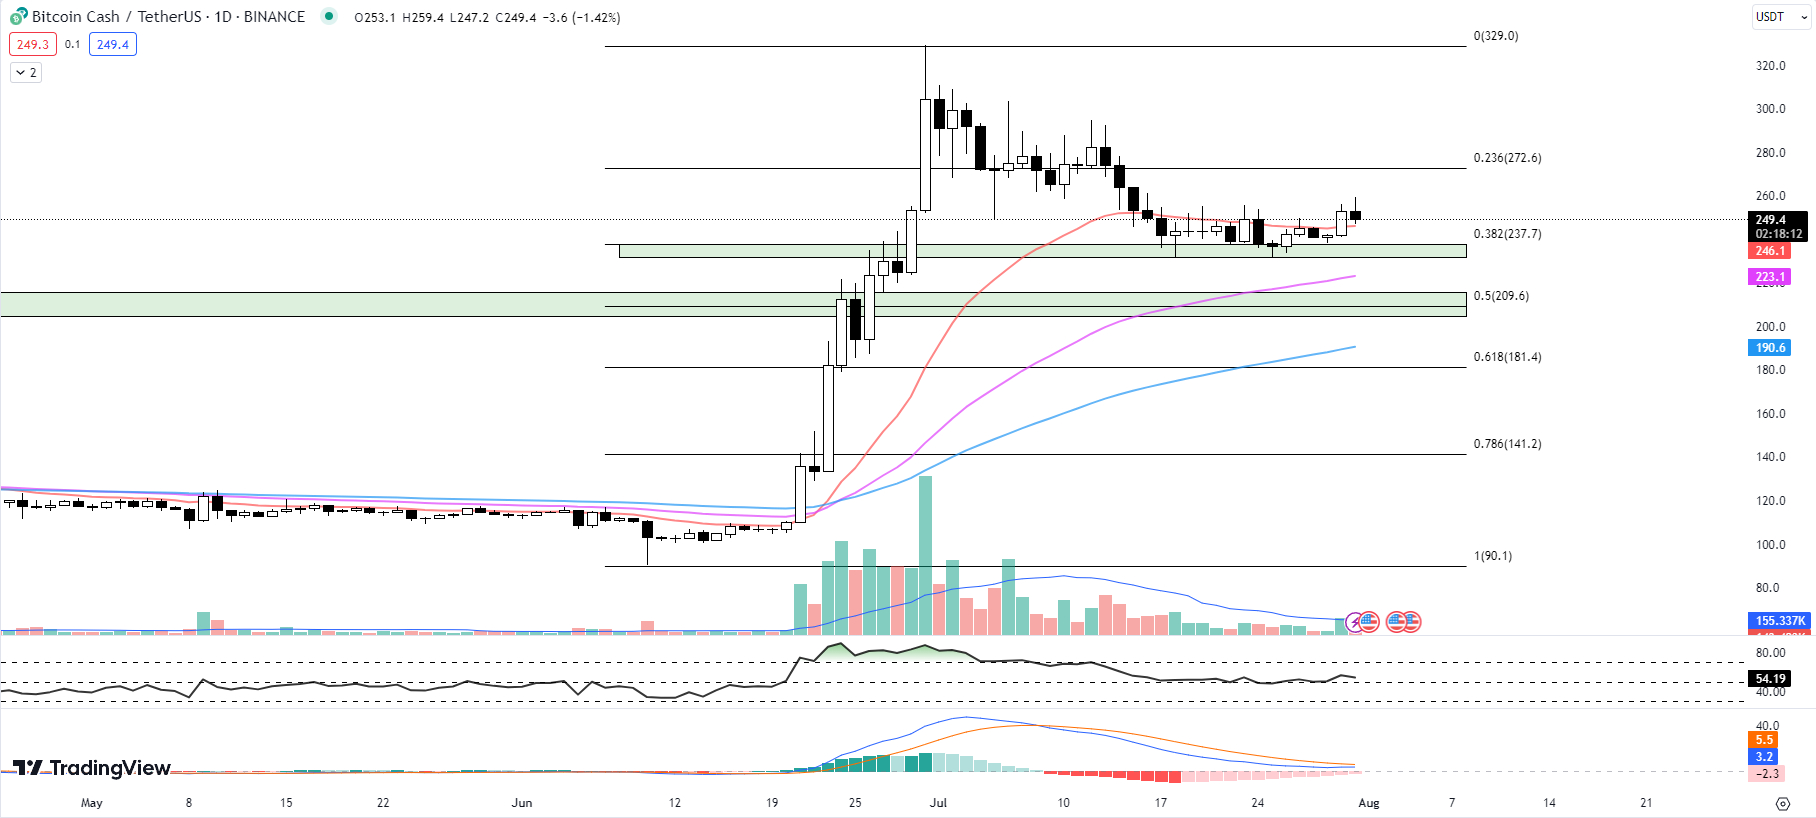
Following 13 days of attempting to penetrate the 20-day EMA, BCH eventually made a breakthrough yesterday with a notable 4.63% surge to the upside.
In today’s trading session, it seems BCH is making a retest of the 20-day EMA as potential support as it currently trades at $249.4 down by 1.42% so far today.
The 20-day EMA, currently at $246.1, is now being tested as support. The retest of this key level is indicative of a potentially new bullish sentiment among investors.
Considering that the current price is $249.4, BCH is still holding above this key indicator, which is a positive sign.
The 50-day and 100-day EMAs at $223.1 and $190.6 respectively are well below the current price, further reinforcing the bullish outlook.
The increasing separation of these EMAs from the current price could be perceived as a strong bullish trend in the longer term.
Additionally, the RSI shows a slight decrease to 54.19 from yesterday’s 56.52. This indicates a minor loss of bullish momentum, but it’s worth noting that the RSI is still positioned above the midline (50), suggesting a prevailing bullish trend.
The MACD histogram’s movement from -2.9 to -2.3 may indicate a lessening in bearish momentum.
A future cross above the zero line would be a definitive bullish signal, but for now, traders should keep a close eye on this indicator.
Considering the immediate resistance, BCH faces a significant hurdle at the Fib 0.236 level at $272.6. Overcoming this barrier could pave the way for further upward movement.
However, if BCH fails to hold above the 20-day EMA, it may seek support within the range of $231.9 to $237.8. This zone aligns with the Fib 0.382 level, providing a considerable safety net for any potential downtrends.
The technical indicators reveal a predominantly bullish outlook for Bitcoin Cash. The key for traders now is to closely watch these indicators and react swiftly to any significant changes.
Should the bullish signals persist, traders might consider initiating long positions while preparing to adjust their strategies if support levels are breached.
Disclaimer: Crypto is a high-risk asset class. This article is provided for informational purposes and does not constitute investment advice. You could lose all of your capital.