10 Best Technical Indicators for Crypto Trading in 2024

Technical indicators help crypto investors make smart trading decisions. Suitable for both short and long-term trading, there are more than 100 crypto trading indicators — each providing specific insights.
This includes everything from volume and volatility to price averages and momentum. This guide reveals the 10 best crypto indicators to use in 2024. Read on to learn about Simple Moving Averages, RSI, MACD, and other must-have indicators.
List of The Best Indicators for Crypto Trading
The 10 best crypto indicators are summarized below:
- Simple Moving Averages (SMA) – Best for discovering trend directions based on historical averages
- Relative Strength Index (RSI) – Best for assessing whether a crypto pair is overbought or oversold
- Fibonacci Retracement – Best for evaluating key support and resistance levels for any crypto market
- Moving Average Convergence Divergence (MACD) – Best for understanding the relationship between two moving averages
- Volume Indicator – Best for gaining insights into the strength of a pricing trend based on volume
- Stochastic Oscillator – Best for generating bullish and bearish signals based on buying and selling pressures
- Bollinger Bands – Best for analyzing volatility via relative high and low prices
- Parabolic SAR – Best for finding potential entry and exit points for an impending reversal
- Average Directional Index (ADX) – Best for calculating the strength of an existing market trend
- On-Balance Volume (OBV) – Best for predicting crypto price changes via volume flows
The Best Technical Crypto Indicators for Trading Reviewed
Let’s examine the best indicators for crypto trading. Learn what each indicator looks for and how to trade its respective reading.
1. Simple Moving Averages (SMA) – Best for Discovering Trend Directions Based on Historical Averages
One of the best crypto trading indicators for beginners is Simple Moving Averages (SMA). In a nutshell, the SMA evaluates the average price of a cryptocurrency over a certain time frame. Short-term traders usually focus on the 5- or 10-day average, while swing traders prefer the 20- or 50-day averages.
While long-term investors typically focus on the 100 or 200-day average. Either way, the SMA helps investors determine whether the price direction is bullish or bearish. For example, suppose you’re a swing trader using the 50-day SMA. The indicator shows that over the prior 50 days, the average price of Bitcoin was $62,500.
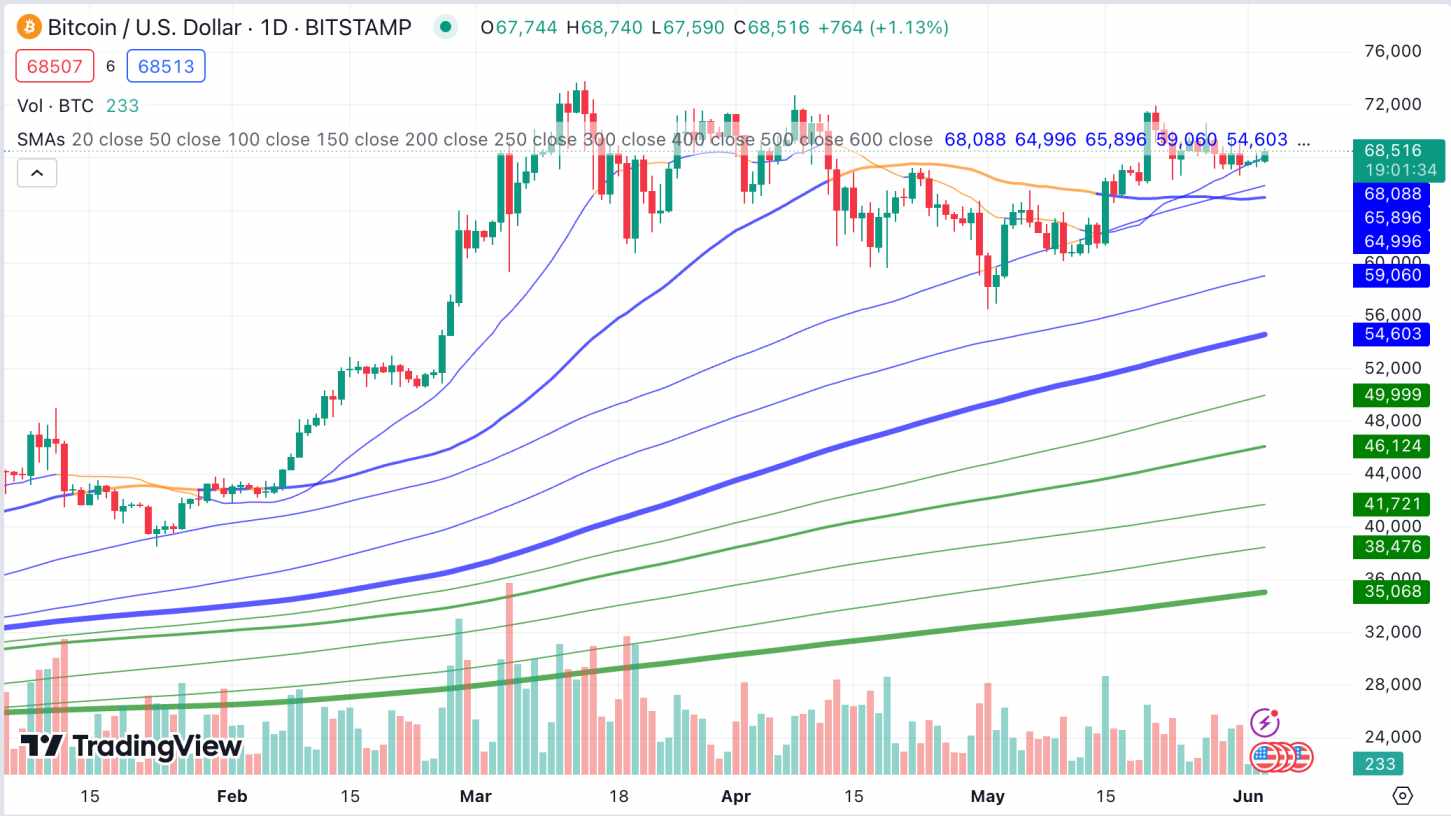
Today, Bitcoin is trading at $65,000. The current price is above the 50-day average, meaning a bullish trend could be imminent. Conversely, suppose Bitcoin is currently trading at $58,000. This is below the 50-day SMA, so the reading could be a bearish flag. Like many technical readings, it’s best to use the SMA with other indicators. This can increase the indicator’s validity.
Why Should You Use Simple Moving Averages?
- Discover price trends by evaluating historical averages
- Suitable for short and long-term trading strategies
- Ideal for beginners who are new to analysis
2. Relative Strength Index (RSI) – Best for Assessing Whether a Crypto Pair is Overbought or Oversold
The Relative Strength Index (RSI) is also one of the best crypto indicators for beginners. It’s a momentum oscillator that analyzes the speed and velocity of specific price movements. The objective is to evaluate whether a crypto pair is overbought or oversold. In doing so, crypto traders can enter a risk-averse position before the expected trend reversal begins.
Fortunately for first-timers, it’s just a case of assessing the RSI reading — which runs from 0 to 100. The general rule of thumb is that the crypto pair is overbought if the RSI is above 70. This means that the pair has witnessed enhanced bullishness in recent times and could be about to enter a market correction.
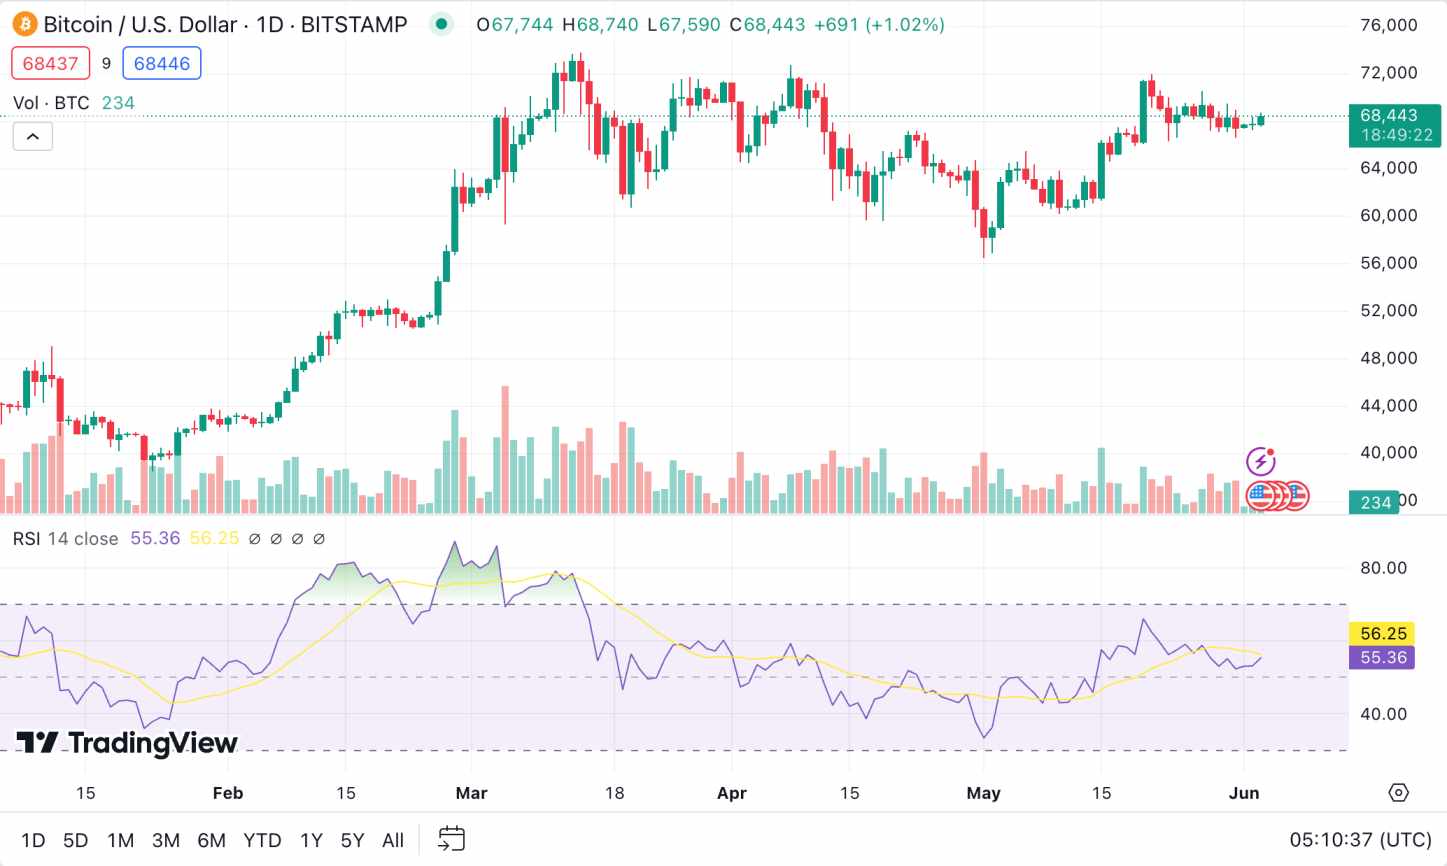
This means the crypto pair will temporarily decline in price. On the other hand, if the RSI is below 30, then the crypto pair could be oversold. This means a price increase could be imminent while existing holders cash in their profits. Although the RSI comes with multiple time frames, the most commonly used is 14 days. This ensures that RSI readings are based on recent performance.
Why Should You Use the Relative Strength Index?
- The leading momentum indicator for assessing the speed and velocity of price movements
- Determine whether a crypto pair is overbought or oversold
- Allows traders to proactively enter risk-averse positions
3. Fibonacci Retracement – Best for Evaluating Key Support and Resistance Levels for any Crypto Market
The next crypto indicator to explore is the Fibonacci Retracement. Not only is this one of the most commonly used indicators for crypto, but also stocks, gold, and other traditional markets. Put simply, the Fibonacci Retracement helps traders identify key support and resistance levels for the respective crypto pair.
Support levels are pricing points that have historically attracted support — meaning prices rarely fall below this price. For example, suppose the Fibonacci Retracement shows that Bitcoin has strong support at $58,000. This means that historically, whenever Bitcoin is in a declining trend, prices recover just above the $58,000 level.
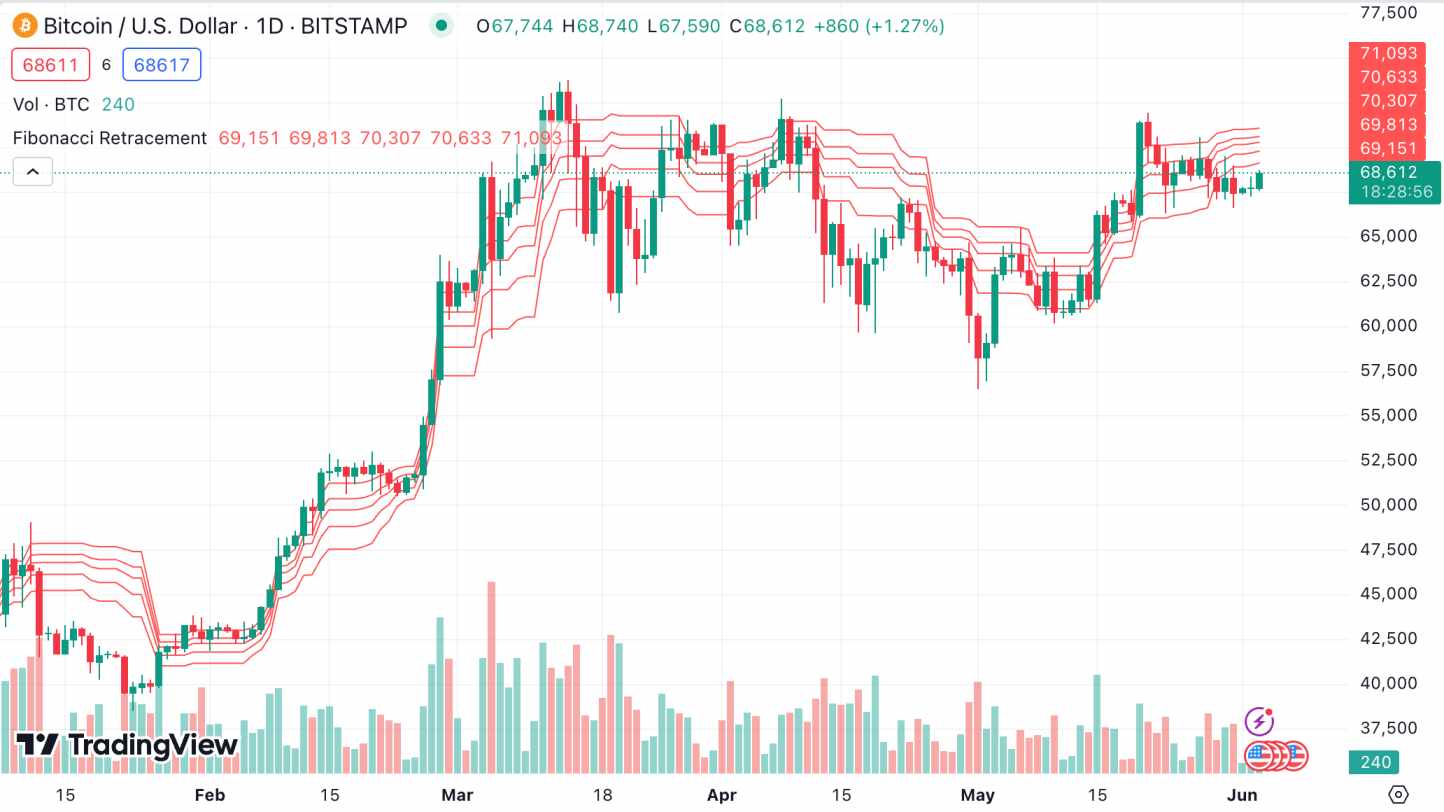
Resistance levels work similarly but in reverse. For instance, suppose the Fibonacci Retracement identifies $70,000 as a key resistance point for Bitcoin. This means that whenever Bitcoin is in a rising trend, its price often struggles to surpass $70,000. The Fibonacci Retracement comes with several levels, which are identified by percentages. The most common is the 61.8% level.
Why Should You Use the Fibonacci Retracement?
- A tried and tested indicator for identifying key support and resistance levels
- Discover potential market reversals early
- Comes with multiple reversal levels — ranging from 28.6% to 78.6%
4. Moving Average Convergence Divergence (MACD) – Best for Understanding the Relationship Between Two Moving Averages
The Moving Average Convergence Divergence (MACD) is also one of the most popular indicators for crypto traders. Whether you’re a short or long-term trader, this indicator is ideal for discovering momentum trends. The MACD monitors and evaluates the relationship between two specific price points.
It subtracts the 26-day exponential moving average (EMA) from the 12-day EMA. In addition to the Moving Average Convergence Divergence line, the indicator deploys a histogram and signal line. Collectively, not only do these metrics analyze the duration of a trend but also its direction, momentum, and strength. For example, let’s say you’re using the MACD on Ethereum.
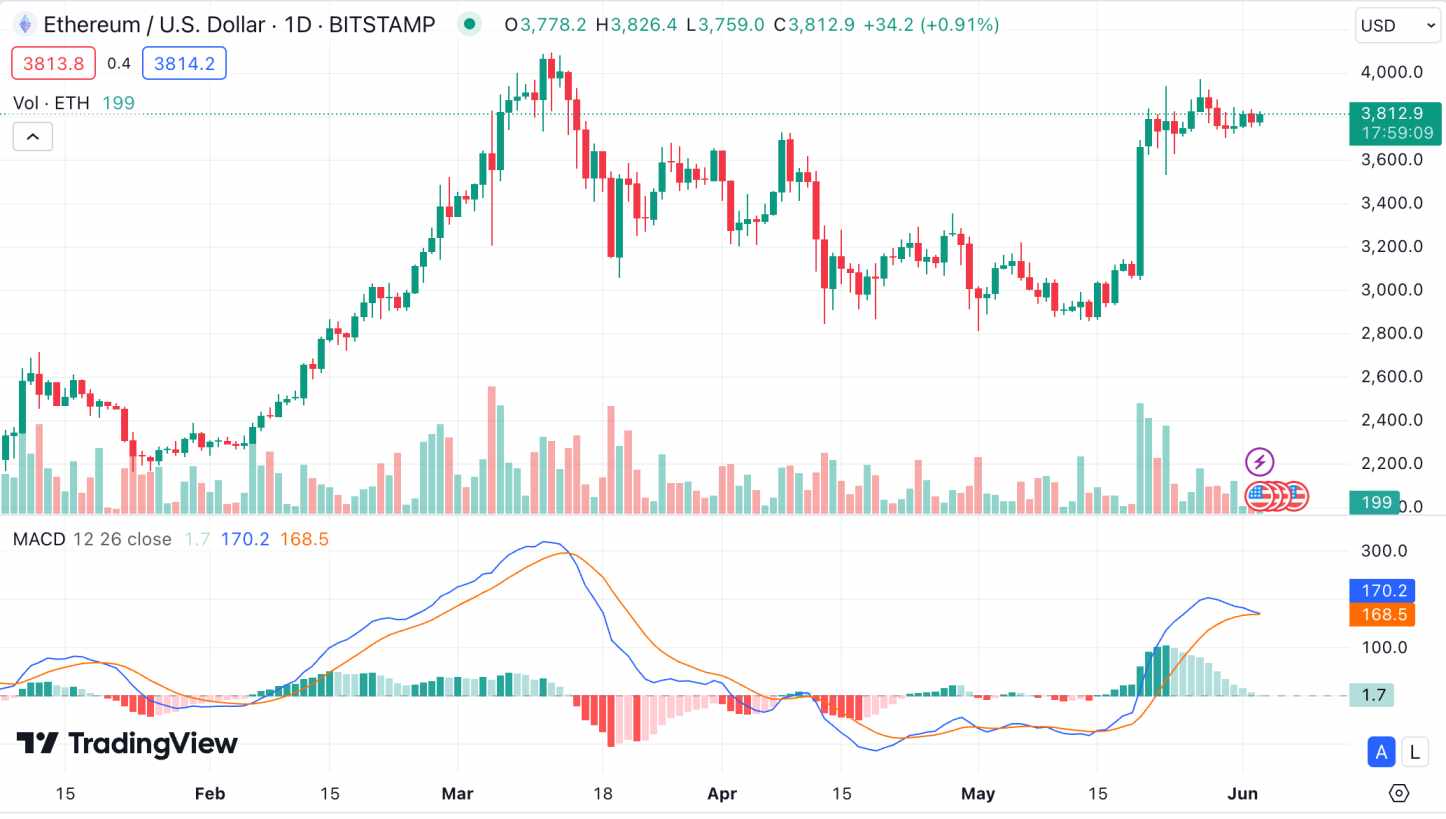
The 12-day and 26-day EMAs are $3,500 and $3,000, respectively, so that’s a MACD line of $500. The signal line, which takes the 9-day EMA from the MACD line, is $400. The histogram is the MACD line less the signal line, so that’s $100. As the MACD line is above the signal line and the histogram is positive, this is a bullish reading. And vice versa if the readings were negative.
Why Should You Use the Moving Average Convergence Divergence?
- Great for analyzing the relationship between two different pricing levels
- Discover insights into momentum and trend direction
- Can be used on any time frame and crypto pair
5. Volume Indicator – Best for Gaining Insights Into the Strength of a Pricing Trend Based on Volume
Another important technical tool when day trading crypto is the Volume Indicator. As the name suggests, this indicator largely focuses on daily trading volumes. It’s best used on established and large-cap crypto assets, such as Bitcoin, Ethereum, XRP, or Dogecoin. This is because the indicator explores the relationship between volume and trend strength.
Put otherwise, Volume Indicator readings have increased validity when it has sufficient data to work from. For example, let’s say you’re using the Volume Indicator to analyze the XRP price. You’re a swing trader, so the indicator analyzes trading volumes over the prior 10 days. You exclude weekend trading as volumes decline substantially.
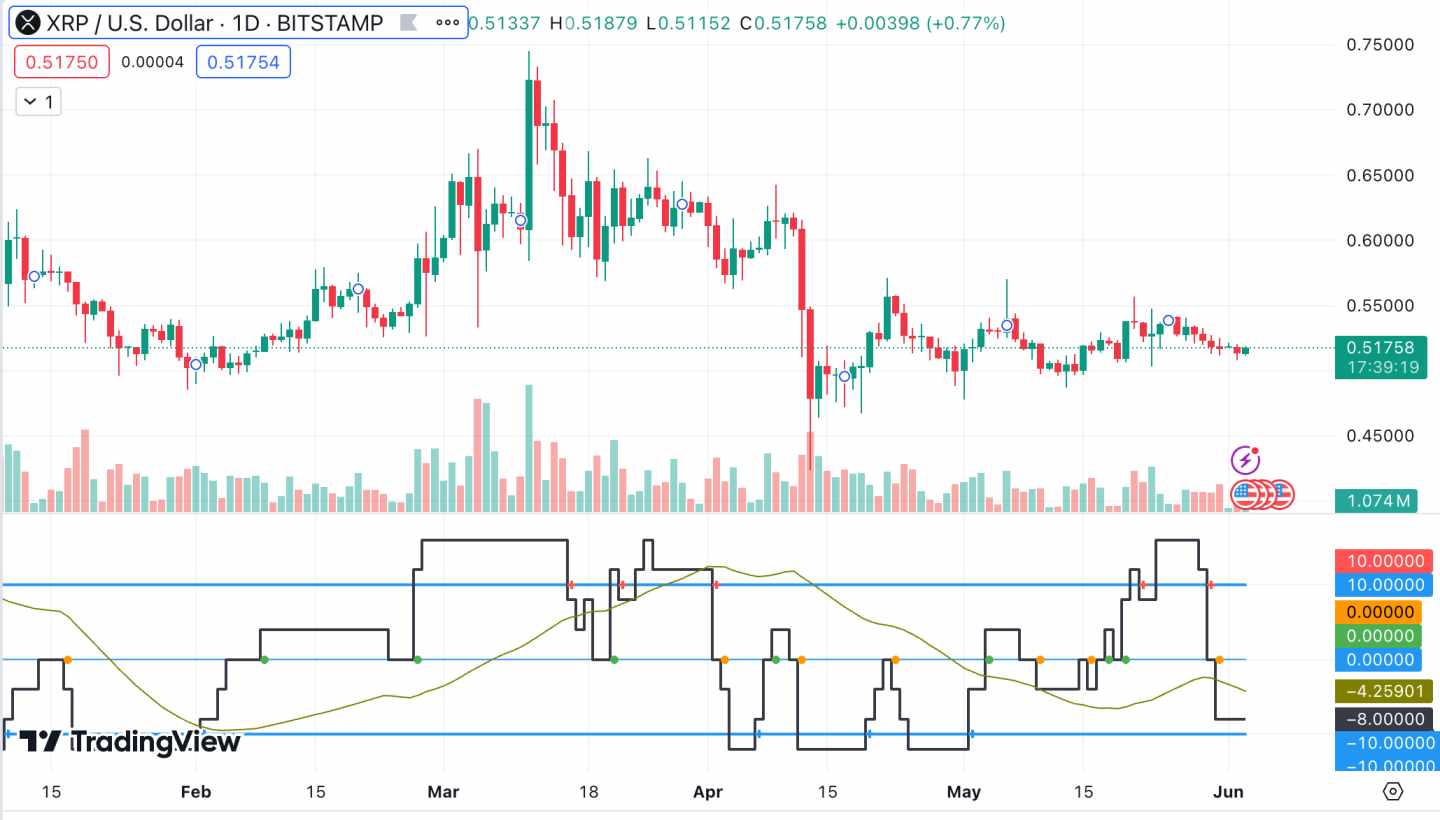
The indicator shows that on day 3, XRP increased by 10% when trading volumes were over $1.5 billion. And on day 7, XRP declined by 5% when trading volumes were around $750 million. This shows that selling pressure was weak when XRP had a red day. And that buying pressure was strong when it finished in the green. This highlights that the overall XRP trend is bullish.
Why Should You Use the Volume Indicator?
- Allows traders to evaluate the relationship between volume and price momentum
- Volume readings often provide early insights before the markets react
- Especially useful when combined with crypto day trading strategies
6. Stochastic Oscillator – Best for Generating Buy and Sell Signals Based on Buying and Selling Pressures
The Stochastic Oscillator is also one of the best crypto indicators for assessing momentum. Similar to the RSI, it provides real-time insights into buying and selling pressures, allowing traders to assess whether a crypto pair is overbought or undersold. However, unlike the RSI, the Stochastic Oscillator doesn’t focus on the speed and velocity of price movements.
Instead, it compares the closing price with a high-low range. This determines the momentum strength of existing trends and helps traders discover potential reversal zones. In terms of generating readings, the Stochastic Oscillator typically analyzes data over a 14-day period. That said, other periods can also be used depending on the trading strategy.
Nonetheless, Stochastic Oscillator readings range from 0 to 100. Crypto pairs with a reading of 80 or more are considered overbought. This means the pair could be about to witness a market correction. If the Stochastic Oscillator reading is below 20, the pair could be oversold — meaning a temporary price increase is possible.
Why Should You Use the Stochastic Oscillator?
- One of the top crypto indicators for discovering impending market reversals
- A reading above 80 or below 20 indicates the crypto is overbought or oversold, respectively
- Ideal for discovering new insights and protecting existing investments
7. Bollinger Bands – Best Indicator for Analyzing Volatility via Relative High and Low Prices
The most successful crypto traders use the Bollinger Bands indicator to assess volatility. Similar to other indicators, this is another way to evaluate whether a crypto pair is overbought or oversold. The Bollinger Bands indicator can be used on many time frames, but the default period is 20 days.
If you’re a long-term trader, then increasing the period to at least 50 days is advised. And under 10 days if you’re a day trader. Either way, Bollinger Bands have a middle band and then two outer bands — the upper and lower. This is based on the standard deviation from the middle band, which can be adjusted to suit the respective strategy.
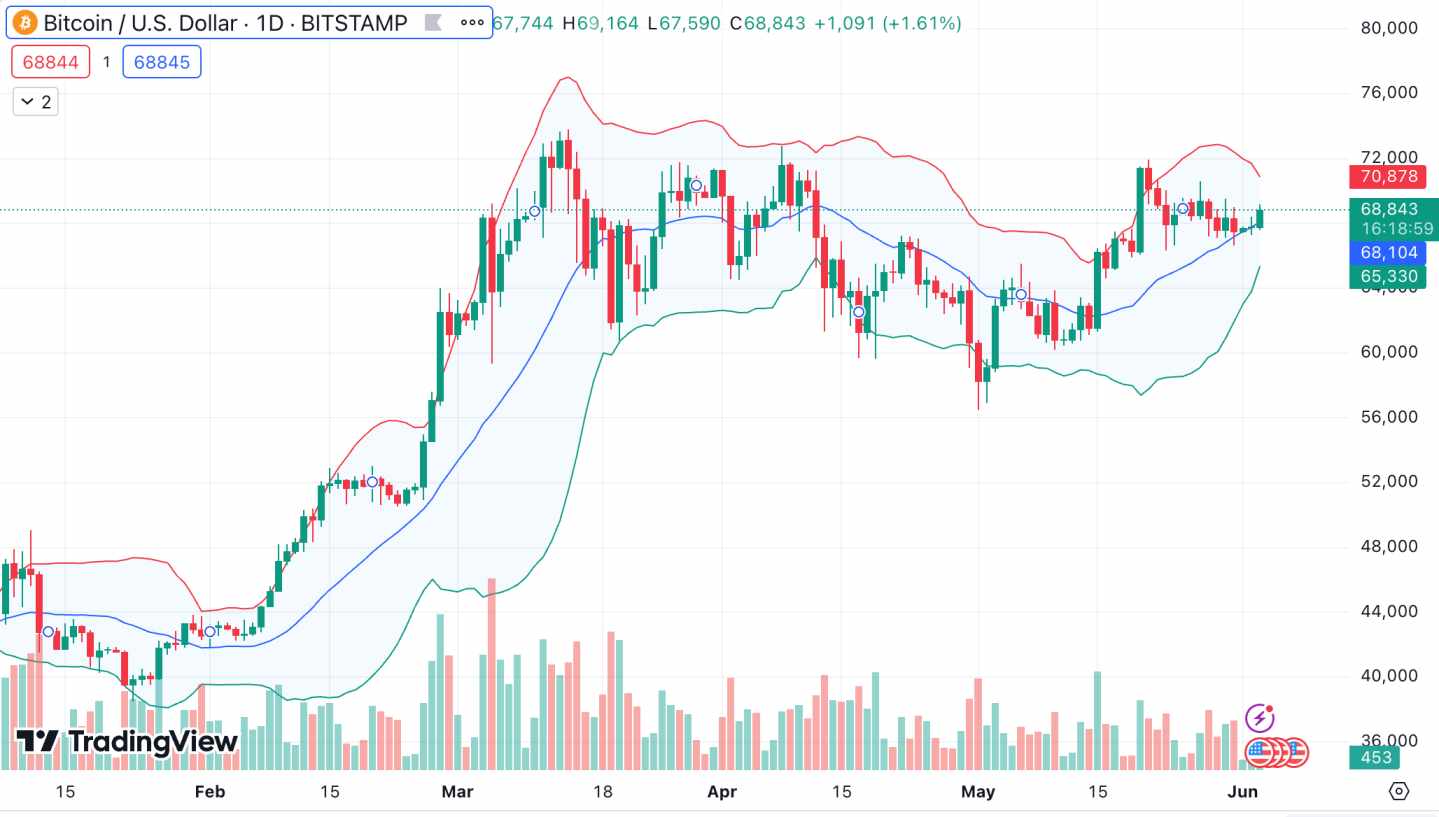
Crucially, if the current market price touches the upper band, this indicates that the crypto pair is overbought. This means a sell order is the correct move. Conversely, if the price touches the lower band, this is bullish. As such, traders should execute a buy order. Stop-loss orders should be placed just below the lower band (long) or above the upper band (short).
Why Should You Use the Bollinger Bands?
- Make crypto trading decisions based on volatility
- Another top-rated indicator for exploring buying and selling pressure
- Can be customized to any time frame
8. Parabolic SAR – Best for Finding Potential Entry and Exit Points for an Impending Reversal
The Parabolic SAR is a simple technical indicator suitable for all skill sets and strategies. In basic terms, it helps traders assess whether a crypto pair is a buy or a sell by placing dots on the pricing chart. Dots typically show when the existing trend could change direction.
As such, traders can enter buy or sell positions accordingly, based on the position of each dot. For example, let’s say you’re using the Parabolic SAR to trade Dogecoin. Over the last 3 days, Dogecoin has traded between $0.12 and $0.16. There are dots just above these prices. When you check the Parabolic SAR tomorrow, Dogecoin has increased to $0.17.
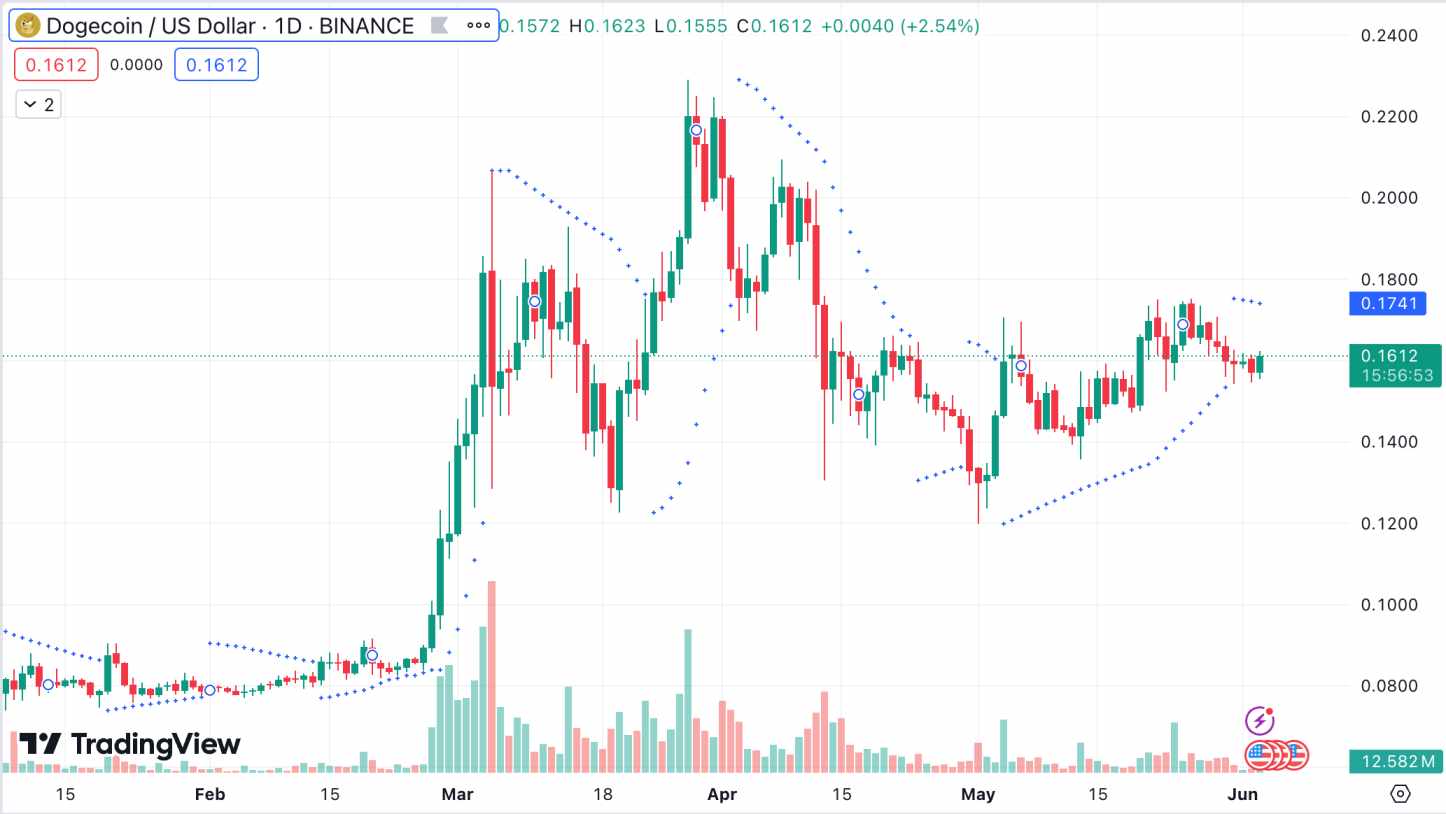
However, the dot is still above the market price. One more day passes and Dogecoin is now trading at $0.18. Crucially, the dot is now below the current price — meaning a bullish signal. The Parabolic SAR suggests that price increases could continue, meaning a buy order is recommended. The buy order value would mirror the dot position.
Why Should You Use the Bollinger Bands?
- Generates straightforward crypto signals highlighting potential trend reversals
- Suggests where the respective buy or sell order should go
- No limitations on strategies or pairs
9. Average Directional Index (ADX) – Best for Calculating the Strength of an Existing Market Trend
Next on this list of crypto indicators is the Average Directional Index (ADX). This indicator is crucial for determining how strong an existing trend is. For example, suppose Ethereum is up 9% this week. Before placing a buy order, you’d want to know whether or not this strong price momentum is here to stay or if it’s short-lived.
This is where the ADX can help. It offers a reading score from 0 to 100. If the reading is below 20, this usually means the identified trend is weak. In this scenario, you might want to avoid buying Ethereum, as the ADX indicates a potential price reversal. However, if the reading is above 50, this usually means the trend is strong.
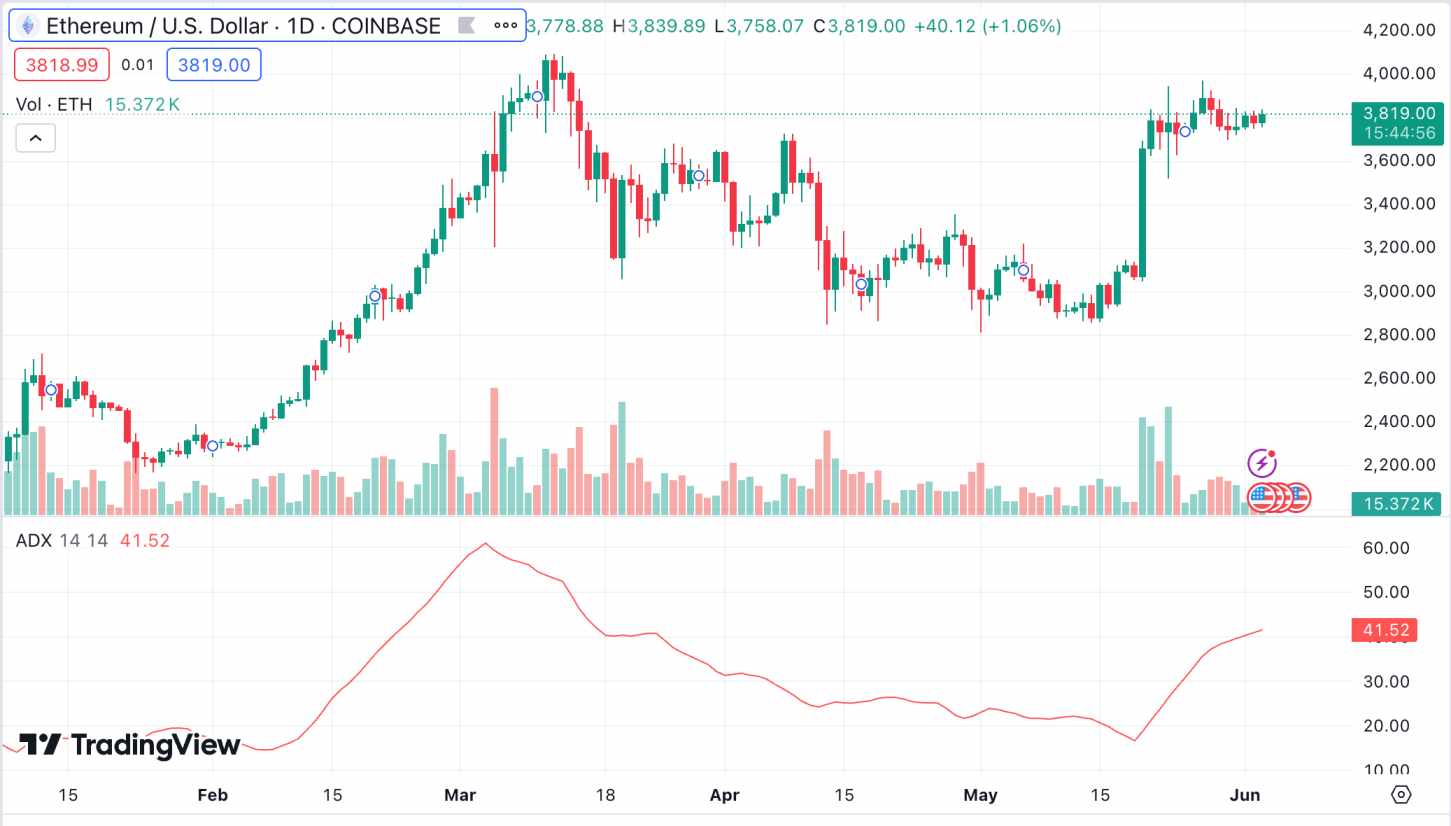
As such, the suggested move would be to buy Ethereum. Naturally, you’d want to reassess the ADX reading frequently, ensuring you’re aware of a change in market sentiment. Regular monitoring can also help strengthen an existing position. For example, if the reading has risen to 70 since you opened the trade, you could increase your exposure further.
Why Should You Use the Average Directional Index?
- One of the most reliable ways to assess the strength of an identified trend
- Readings above 50 highlight the trend is strong and likely to continue
- The trend could be short-lived if the reading is below 20
10. On-Balance Volume (OBV) – Best for Predicting Crypto Price Changes via Volume Flows
No list of crypto indicators would be complete without the On-Balance Volume (OBV). While we discussed the Volume Indicator earlier, the OBV takes readings to the next level. This is because it can identify potential crypto price changes based on volume inflows, while the Volume Indicator purely looks at trading volumes.
So, the OBV initially measures buying and selling pressures for the chosen pair. It automatically adds volume totals on days when the asset closed in the green. It then subtracts the total volumes on days when the asset price declined. This generates a trend, with the OBV either rising or falling.
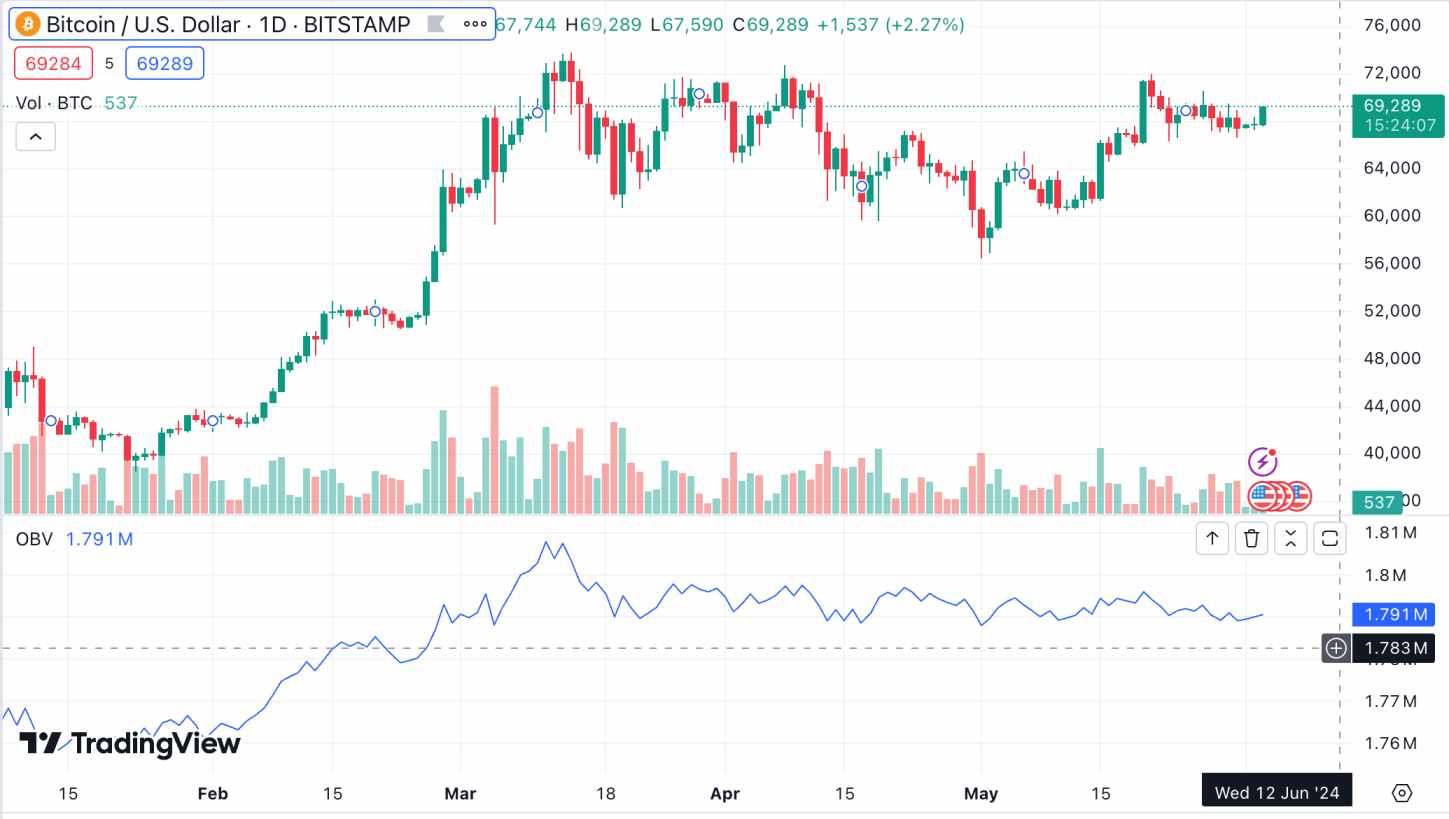
If the trend is rising, it predicts increased buying pressure, meaning a bullish period is possible. While a falling trend means the asset price could decline. We should also note that the OBV is a highly versatile indicator. The selected time frame can cover several days, weeks, or months — meaning both short and long-term strategies will find it useful.
Why Should You Use the On-Balance Volume?
- Make trading decisions based on volume flows
- Automatically predicts whether upcoming trends are bullish or bearish
- A must-have for both short and long-term trading strategies
What is a Crypto Indicator?
Crypto indicators are used when performing technical analysis. This means analyzing historical and existing prices, looking for trends, and making informed decisions on the future direction of a crypto pair. There are more than 100 crypto indicators, each specializing in a specific type of data.
For example, Simple Moving Averages (SMA) help traders discover trends based on previous averages. While the Fibonacci Retracement focuses on support and resistance levels. And then there’s the Relative Strength Index (RSI) — which explores whether a crypto pair is overbought or oversold.
Crucially, the most successful traders use multiple crypto indicators before making a trading decision. This increases the validity of the identified reading.
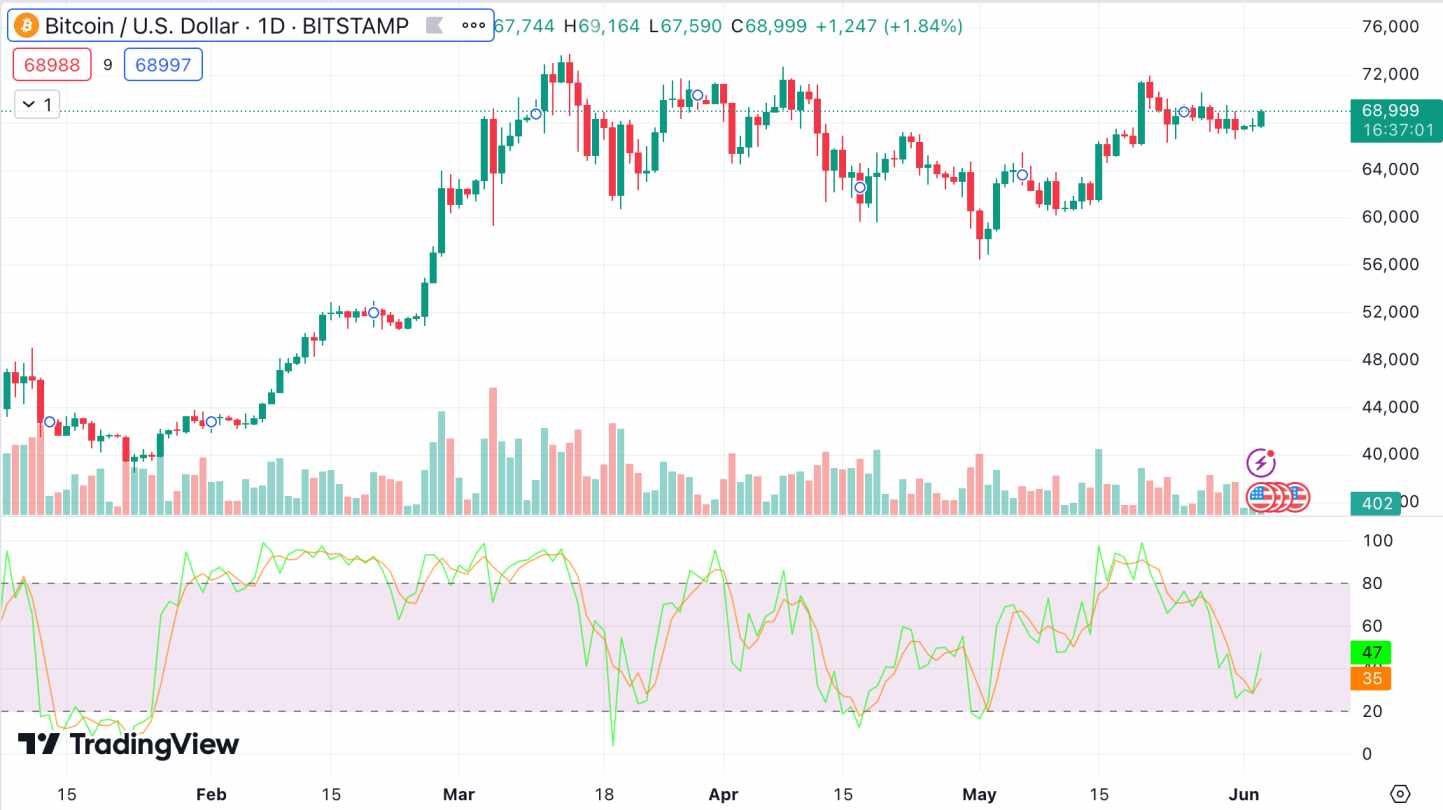
- For example, let’s say you’re analyzing the Bitcoin price, which is currently at $65,000.
- You use the MACD indicator to check the current trend and momentum. The MACD line is above the signal line, indicating that Bitcoin’s price could keep rising.
- However, to be sure before buying, you also use the Bollinger Bands indicator. This measures market volatility, helping you assess whether Bitcoin could be overbought or oversold.
- The Bollinger Bands reading shows that Bitcoin touches the lower band at $65,000 — so it could be oversold. As such, at least a temporary upward trend is expected.
- Now that you have confirmation, you decide to enter a long position on Bitcoin.
Not only do crypto indicators help traders discover new opportunities, but they’re also required for effective risk management. After all, indicators can alert traders to potential trend reversals. In this instance, the trader might consider closing an existing position to protect their capital.
[/su_note]
Methodology: How We Ranked The Top Crypto Indicators
We ranked the 10 best crypto indicators from over 100 options. Our research methodology is discussed in the following sections. This will help you understand why we selected each indicator.
Complexity – 25%
25% of our methodology was weighted based on the complexity of each indicator. For instance, we made sure to include simple technical indicators that would be suited for beginners. The RSI is a good example.
- The RSI generates a reading of between 0 and 100.
- Readings under 30 indicate that the crypto asset is oversold, so a reversal to the upside could be imminent.
- While an RSI reading of over 70 means that a market correction is possible. This means the asset is overbought and prices could decline.
We also included crypto indicators suitable for intermediate-to-advanced traders. This includes the MACD, which requires a solid understanding of three metrics: the MACD line, the signal line, and the histogram. Traders must know how each metric interacts with one another to interpret the data and make an informed decision.
Accuracy and Reliability – 25%
Our research methodology also analyzed the accuracy and reliability of each crypto indicator. Crucially, it will come as no surprise to learn that each indicator is established in the traditional financial markets. This means each indicator is used to trade stocks, gold, oil, and other established assets.
For example, the RSI has been deployed by traders since 1978. Launched a year earlier, the MACD is also a long-standing indicator with a solid reputation. While new indicators are frequently being created, we didn’t consider them for this guide — as they haven’t been tried and tested over many years.
Relevance to Market Conditions – 25%
Another research angle taken was the relevance of each crypto indicator to specific market conditions. We split this into five core categories.
- First, we included indicators that identify trends — such as the MACD and Simple Moving Averages.
- Momentum indicators were also covered, like the Stochastic Oscillator and RSI.
- To measure volatility, we included the Bollinger Bands.
- Both the On-Balance Volume and Volume Indicator will help traders analyze volume-based metrics.
- Finally, for trend strength analysis, we included the ADX and Parabolic SAR.
Customization and Flexibility – 25%
We also gave extra weight to crypto indicators that can be customized. This ensures that traders can deploy indicators for their preferred trading strategy, whether that’s scalping, day trading, or long-term investing. For example, Simple Moving Averages offer complete flexibility, as traders can choose their required time frame.
Day traders will prefer the 5 or 10-day average. While long-term investors can opt for the 100 or 200-day period. Swing traders might sit somewhere in between, such as the 50-day average. Similarly, while Bollinger Bands are typically set at 20 days by default, traders can increase or decrease the analysis time frame.
How Effective is Technical Analysis for Crypto?
Just like the traditional financial markets, technical analysis can be highly effective when trading cryptocurrencies. After all, the crypto markets trade 24 hours per day, 7 days per week. This means a lot of pricing data and historical trends have appeared over time. However, there are some limitations.
For a start, fundamental news can supersede technical readings — especially if it’s a major development. For example, consider the announcement in January 2024 that Bitcoin ETFs would finally be approved by the SEC. Irrespective of the MACD, RSI, OBV, and other indicators — the news was a major milestone for Bitcoin.
As such, the Bitcoin price entered a prolonged bull run in response. Similarly, when fundamental news is overly negative, this can also make technical analysis redundant. No matter how bullish pricing and volume signals are, the news could result in a prolonged downward trend.
Another drawback is that technical analysis loses validity in some circumstances. For instance, Bitcoin, Dogecoin, and XRP have over a decade’s worth of trading data, which is crucial for indicator findings. However, the likes of Solana, Uniswap, and Shiba Inu were launched as recently as 2020. While these cryptocurrencies are large-caps, they have a limited track record.
Crypto indicators can also be redundant when trading smaller-cap markets. For instance, analyzing pricing and volatility trends on an ERC-20 token valued at $1.5 million will provide little insight. There are simply not enough capital inflows or outflows, so the data is completely skewed.
What’s more, while technical analysis has a place when trading established, large-cap coins, indicators shouldn’t be used on their own. For example, just because the RSI reading is above 70 — this doesn’t necessarily mean that the coin is overbought. Instead, you’d want to deploy other technical analysis tools for confirmation.
Lagging vs Leading Indicators
The best crypto indicators are either ‘lagging’ or ‘leading.’
Understanding how each works is important, so let’s take a closer look.
What is a Lagging Indicator?
Lagging indicators ‘lag’ behind existing trends — meaning they don’t make predictions about future prices. On the contrary, lagging indicators are used for confirmation.
- For example, let’s say the Bitcoin price is up over 15% this week.
- The trader uses the MACD to assess whether this is a short-term trend or if Bitcoin is set for a prolonged upward trajectory.
- Crucially, the MACD line is above the signal line.
- This confirms the existing trend is strong, so the trader enters a buy position.
What is a Leading Indicator?
Leading indicators help traders discover potential trends before they happen. As such, they’re best used when making trading predictions. This can be based on various metrics, such as volume, price averages, and support and resistance levels.
- For instance, let’s say Ethereum is down 20% over the prior month.
- The trader is assessing whether or not to enter a short position.
- They use the RSI indicator, which shows a reading of 27.
- This means Ethereum could be oversold and due for a rebound.
- As such, the trader instead enters a buy position in anticipation of a reversal.
Conclusion
Technical indicators play an integral role when trading crypto assets — especially when deploying short-term strategies. Not only do indicators help traders predict future trends, but they also validate existing price movements.
Just remember that knowledge of multiple crypto indicators is crucial. Using a standalone indicator won’t yield successful results as readings will come with limited validity.
FAQs
What is the most successful crypto indicator?
The most successful crypto indicators include the RSI, MACD, Bollinger Bands, and Fibonacci Retracement. These indicators cover various metrics, including volatility, buying/selling pressure, and support/resistance levels.
What is the best indicator for volume?
The best indicator for volume is the On-Balance Volume (OBV). The OBV analyzes volume inflows to predict potential changes in crypto prices.
Which indicator has the highest accuracy?
The RSI has a solid track record for accuracy – especially when analyzing whether a crypto pair is overbought or oversold. That said, further confirmation should be sought with other indicators rather than just relying on RSI readings.
Is MACD or RSI better?
While both the MACD and RSI measure momentum, they both serve different purposes. The RSI is best for evaluating overbought or oversold conditions, while the MACD is ideal for confirming the trend direction and strength.
Does technical analysis work for crypto
Yes, technical analysis does work for crypto – but there are some limitations. Ultimately, technical analysis is best used on established cryptocurrencies with a large market capitalization.
References
- Relative Strength Index (RSI) (Fidelity)
- MACD Indicator Explained (Binance)
- Technical Analysis and Crypto (Gemini)
- Statement on the Approval of Spot Bitcoin Exchange-Traded Products (SEC)
About the Author
About Cryptonews
At Cryptonews, we aim to provide a comprehensive and objective perspective on the cryptocurrency market, empowering our readers to make informed decisions in this ever-evolving landscape.
Our editorial team, comprised of more than 20 professionals in the crypto space, works diligently to uphold the highest standards of journalism and ethics. We follow strict editorial guidelines to ensure the integrity and credibility of our content.
Whether you’re seeking breaking news, expert opinions, educational resources, or market insights, Cryptonews.com is your go-to destination for all things crypto since 2017.

 Eric Huffman

 Nick Pappas