Blame Short-term Bitcoin Holders For the Price Crash Again


Sometimes, the history indeed repeats itself. In the Cryptoverse, it’s the short-term traders who have been driving the most recent sell-off. Again.

As reported in October 2019, crypto market analysis firm Coin Metrics found that the bitcoin (BTC) selling pressure at the time originated from short-term traders that got this coin at prices between USD 10,000 and USD 12,000.
Today, in their latest report, following the most recent market crash on March 13, Coin Metrics says that “recent price movements were likely mostly driven by shorter-term and relatively new holders,” according to on-chain data. They support this claim with four arguments.
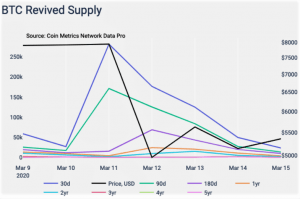
1. Thirty-day revived supply
Based on the gathered data, the analysts concluded that:
- some BTC 281,000 (USD 1.5 billion) that haven’t been touched for thirty days, were revived on March 11 – meaning, they returned into circulation;
- this day saw the fourth largest spike in BTC thirty-day revived supply over the last eight years;
- in contrast, only BTC 4,131 (USD 21 million) that haven’t been touched for at least a year were revived on the same day;
- long term holders appear unfazed in spite of the severe market downturn.
“This signals that a vast majority of the activity on March 11th and March 12th involved BTC that had been held for less than a year,” writes Coin Metrics.
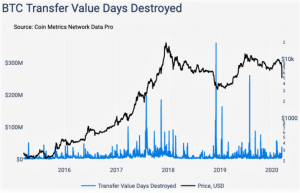
2. Transfer value days destroyed
The firm adds that this finding is further confirmed by transfer value days destroyed, which multiplies transfer value by the amount of days that the coins being transferred last moved on-chain, giving a much higher weight to older coins.
“There was not a significant spike in BTC transfer value days destroyed on March 11th or March 12th,” they write. “This signals that there was not a relatively high amount of long-held coins moved prior to the recent price action.”
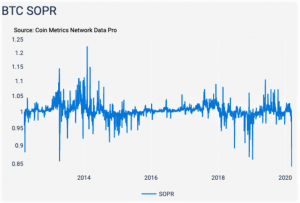
3. BTC SOPR
BTC SOPR (spent output profit ratio) dropped to 0.843 on March 12, which Coin Metrics says it’s the lowest value in eight years – since February 2012. Since SOPR is a network-wide indicator of profit/loss, a SOPR below 1.0 means that investors are selling at a loss, the report explains.
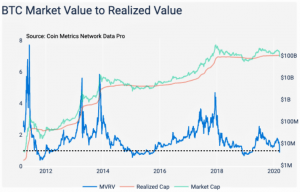
4. BTC MVRV
BTC MVRV (market value to realized value) dropped below 1.0 – for only the fourth time in its entire history. An MVRV below 1.0 may mean that holders have a higher market valuation than current speculators.
Meanwhile, the markets are still volatile and the firm can’t say what’s to come, but all is not lost. The report concludes that this initial date they found in the aftermath of the market crash is actually “somewhat reassuring,” given that “longer-term holders seem to be holding strong, at least for now.”
Additional conclusions the report reached include:
- BTC price seems to have reacted to several key events in the past weeks, such as the announcements of a 30-day travel ban between the U.S. and Europe and the Federal Reserve cutting interest rates to 0.00%-0.25%;
- the market capitalization for most stablecoins increased;
- over BTC 160,000 flowed into the exchanges on March 13, the largest one-day inflow since November 13, 2017;
- over BTC 171,000 flowed out of exchanges on the same day, the largest daily total since November 2017.
___
Learn more: 10 Crypto Minds Weigh in On Post-Crash Bitcoin and Its Future
- Mark Zuckerberg’s Meta AI Predicts Unbelievable Bitcoin Price by the End of 2026
- Google Gemini AI Predicts Crazy Solana Price by the End of 2026
- XRP Price Prediction: MVRV Data Points Bullish
- Elon Musk Grok AI Predicts Incredible XRP Price and Bitcoin Price by End of 2026
- Leading Claude AI Fable 5 Predicts Stunning XRP Price by The End of 2026
2M+
250+
8
70


- Mark Zuckerberg’s Meta AI Predicts Unbelievable Bitcoin Price by the End of 2026
- Google Gemini AI Predicts Crazy Solana Price by the End of 2026
- XRP Price Prediction: MVRV Data Points Bullish
- Elon Musk Grok AI Predicts Incredible XRP Price and Bitcoin Price by End of 2026
- Leading Claude AI Fable 5 Predicts Stunning XRP Price by The End of 2026
More Articles


