Is the Bitcoin Rally Running Out of Steam? Analysts Worry That This Key Metric Isn’t Improving


As the Bitcoin (BTC) price continues to go sideways just below the $25,000 level, traders are trying to assess whether the world’s largest cryptocurrency by market capitalization has enough oomph to muster another breakout above key resistance. For the last five days, sell pressure ahead of the August 2022 highs in the low $25,000s has kept a lid on prices.
Technicians think that a break above this level and the May 2022 lows around $25,400 would open the door to a swift move higher to the next major resistance area around $28,000. But some traders are becoming concerned that this year’s Bitcoin rally (BTC is up close to 50%) may soon run out of steam. Indeed, an analyst at respected crypto analytics firm CryptoQuant recently expressed concern about one key on-chain that isn’t improving sufficiently to imply further BTC price upside.
Active Bitcoin Addresses Not Rising as Fast as Past Bull Markets
According to Yonsei_dent, a contributor to CryptoQuant’s Quicktake blog, the number of active Bitcoin addresses are not increasing that much, unlike during past Bitcoin bull market cycles. “Active Addresses is a metric that includes all addresses sending and receiving BTC, providing a look at how active market demand is,” noted Yonsei-dent, explaining that this essentially means that market demand for Bitcoin hasn’t increased that much.
According to data presented by crypto-analytics firm Glassnode, the most recent 30-day moving average of Bitcoin active addresses was around 954,000, only up around 50,000 since the start of the year, and still well within the 875,000-980,000ish range of the last 14 or so months.
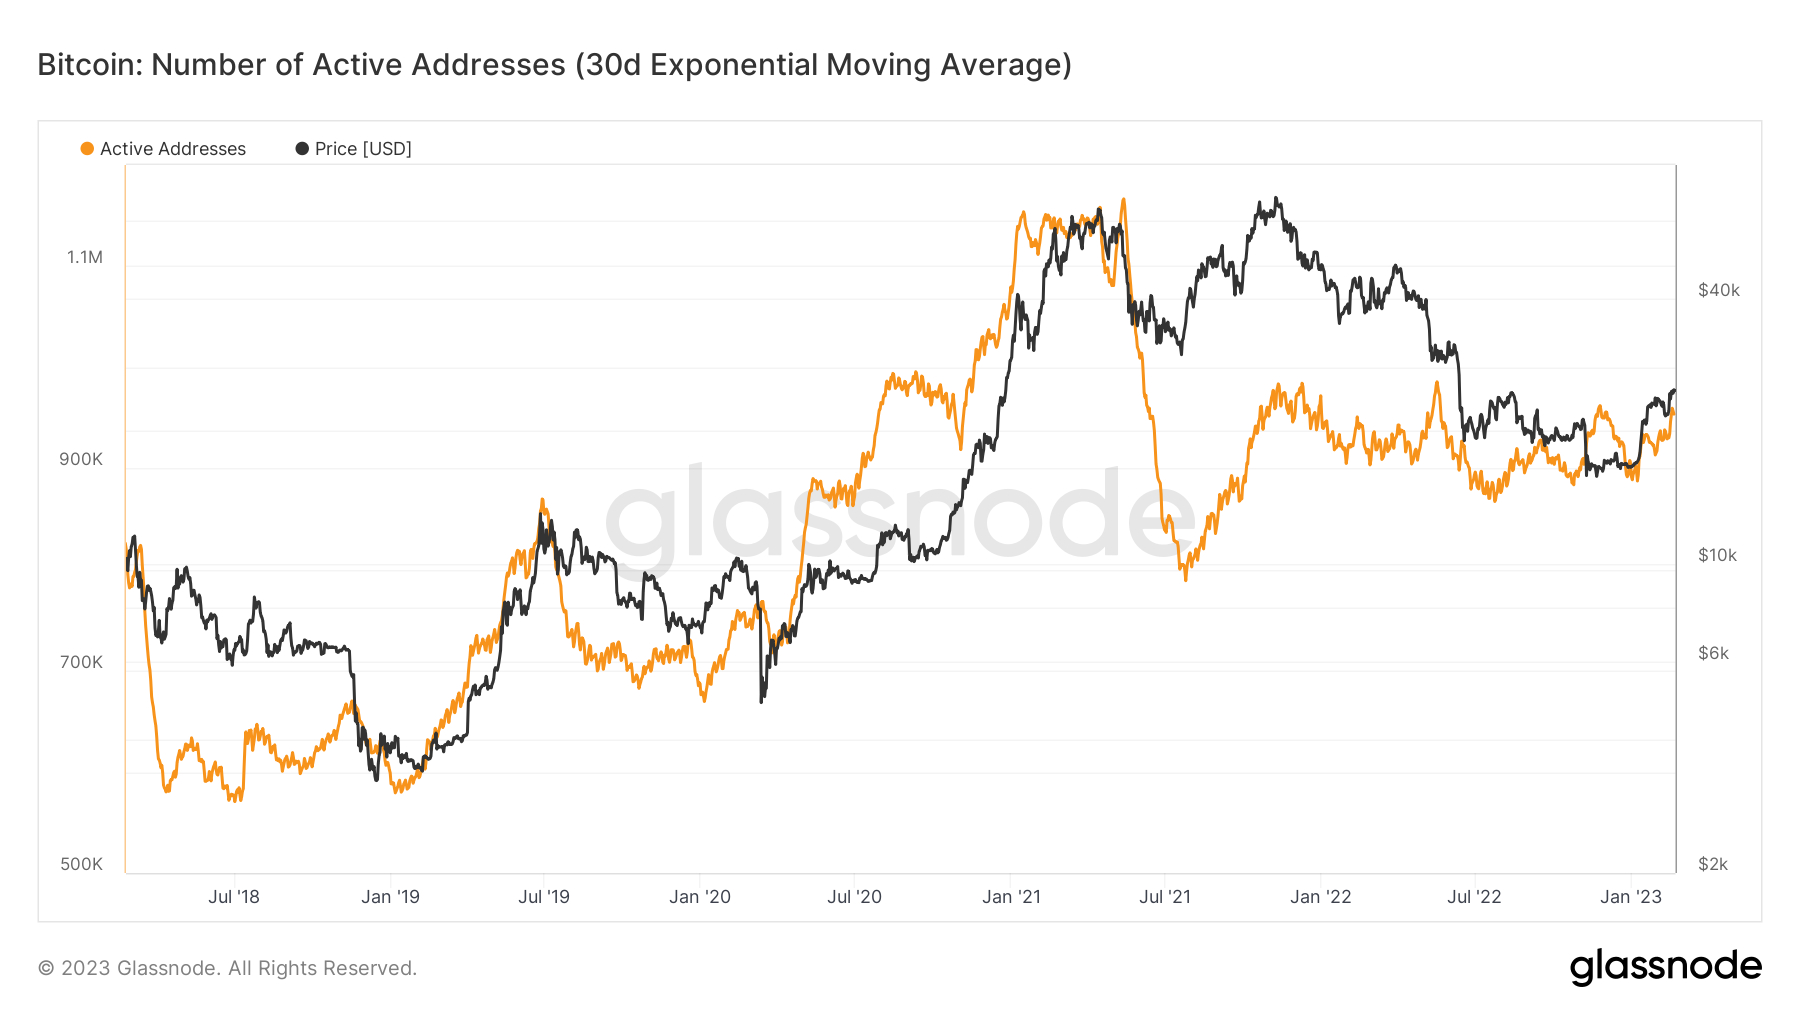
Historically, sharp rallies in the Bitcoin price have coincided with sharp rises in the number of active addresses. Yongsei_dent points out the H1 2019 and post-pandemic 2020 to early 2021 rallies as examples of this.
Other On-chain Network Activity Metrics Paint a Better Picture
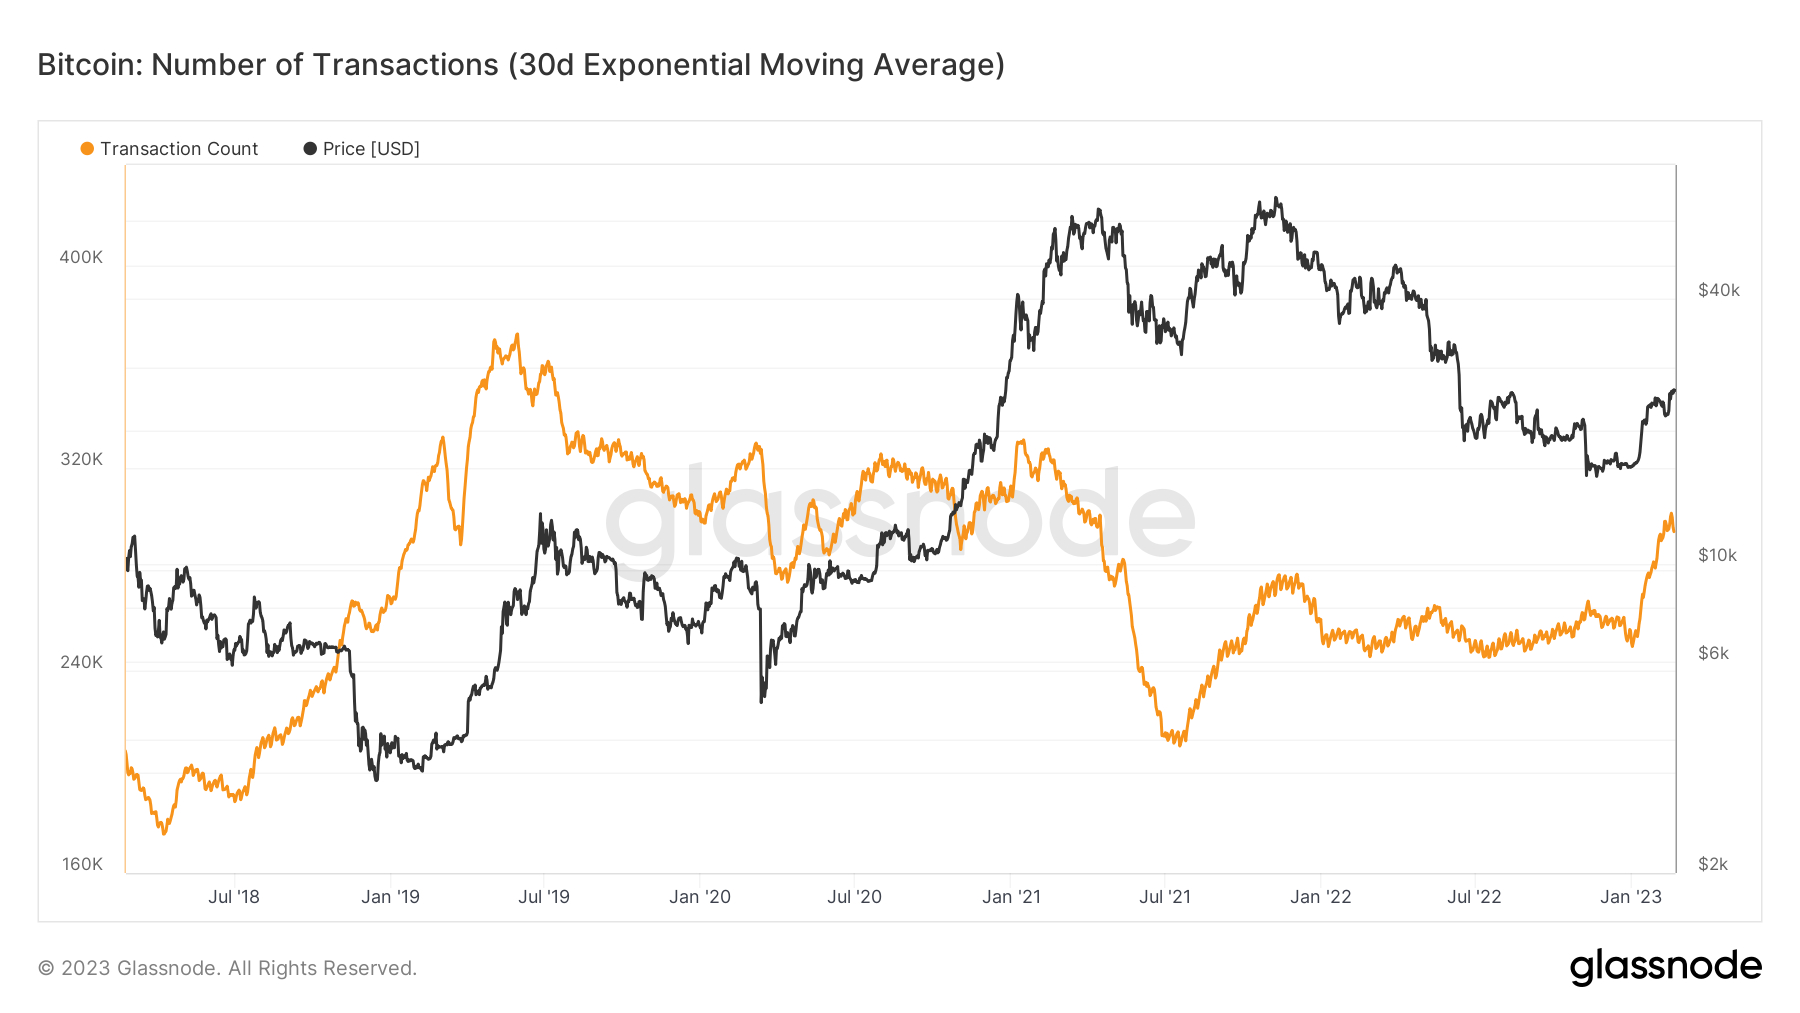
The Bitcoin bulls will be relieved to know that plenty of other on-chain metrics that shed light on Bitcoin network activity paint a better picture. For starters, the 30-day moving average number of daily network transactions recently rose above 300,000 for the first time since April 2021, when Bitcoin’s price was around $60,000. This metric doesn’t have the best track record of correlating with Bitcoin price rallies, but it certainly isn’t a negative for BTC if transactions are rising.
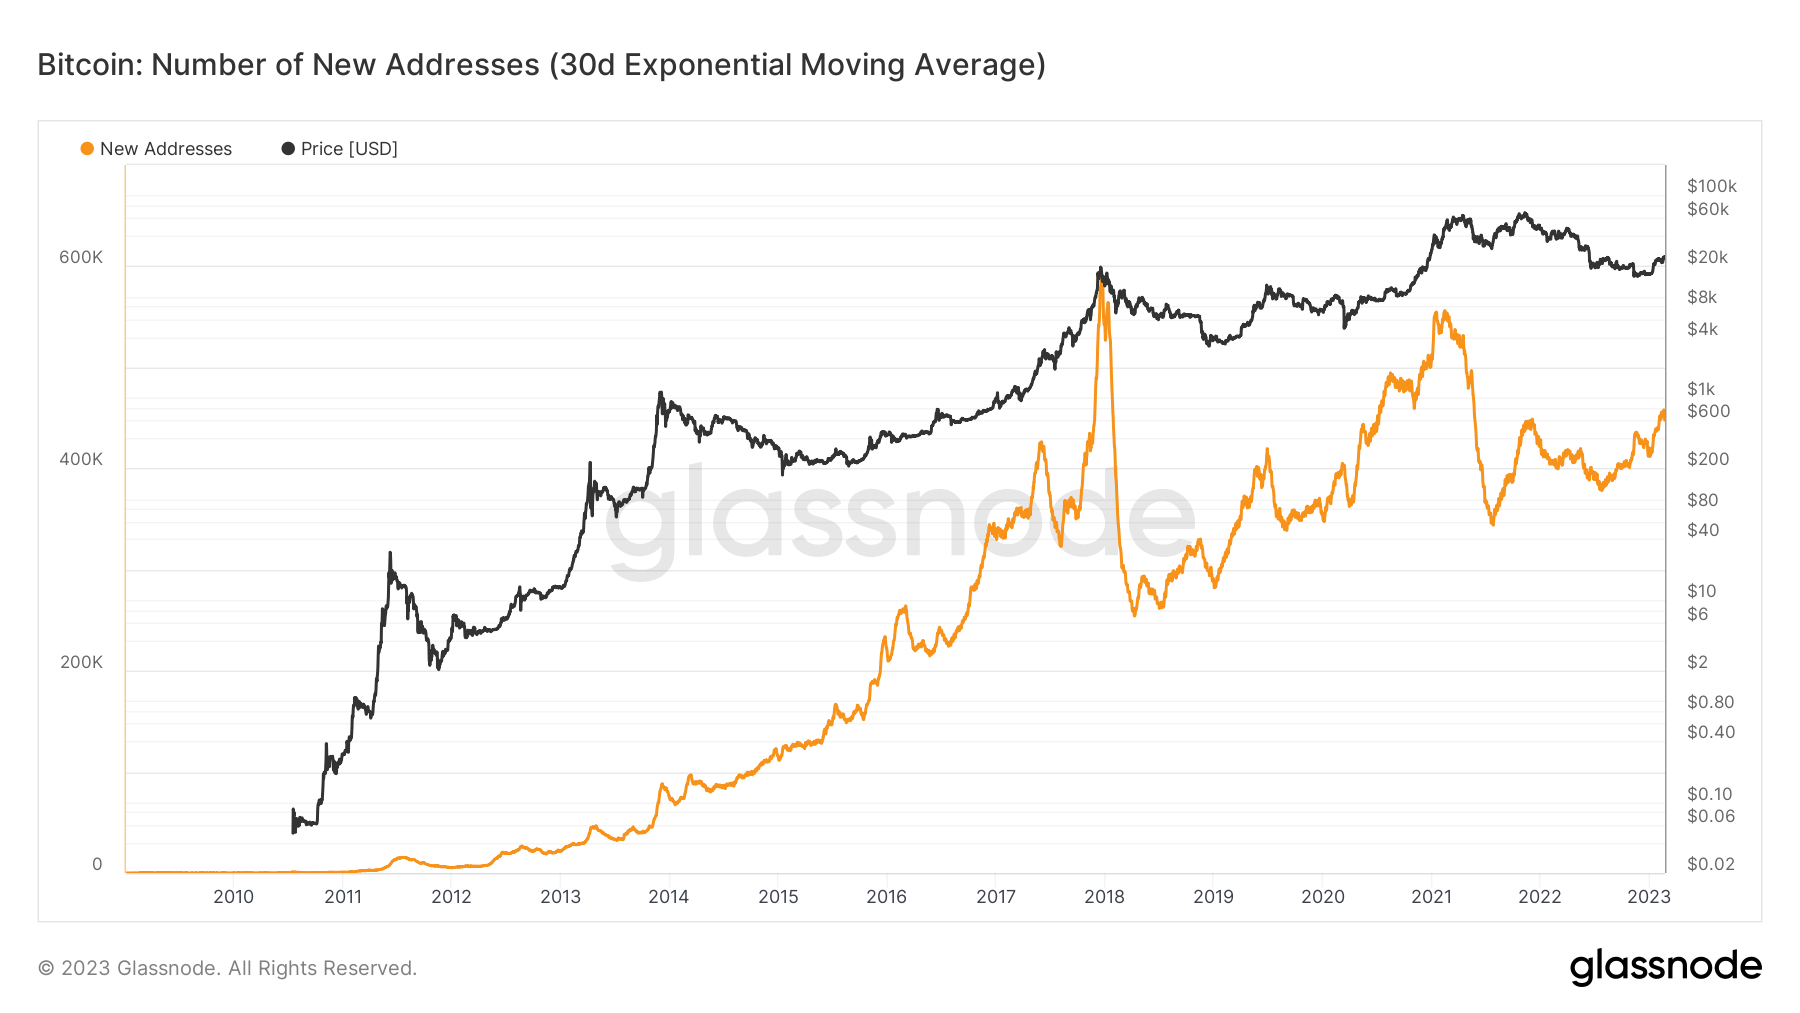
Elsewhere, the rate at which new Bitcoin wallet addresses interacting with the network for the first time is also accelerating. The 30-day exponential moving average recently surpassed 450,000 for the first time since May 2021. This metric has a much better history of correlating with increases in the Bitcoin price.
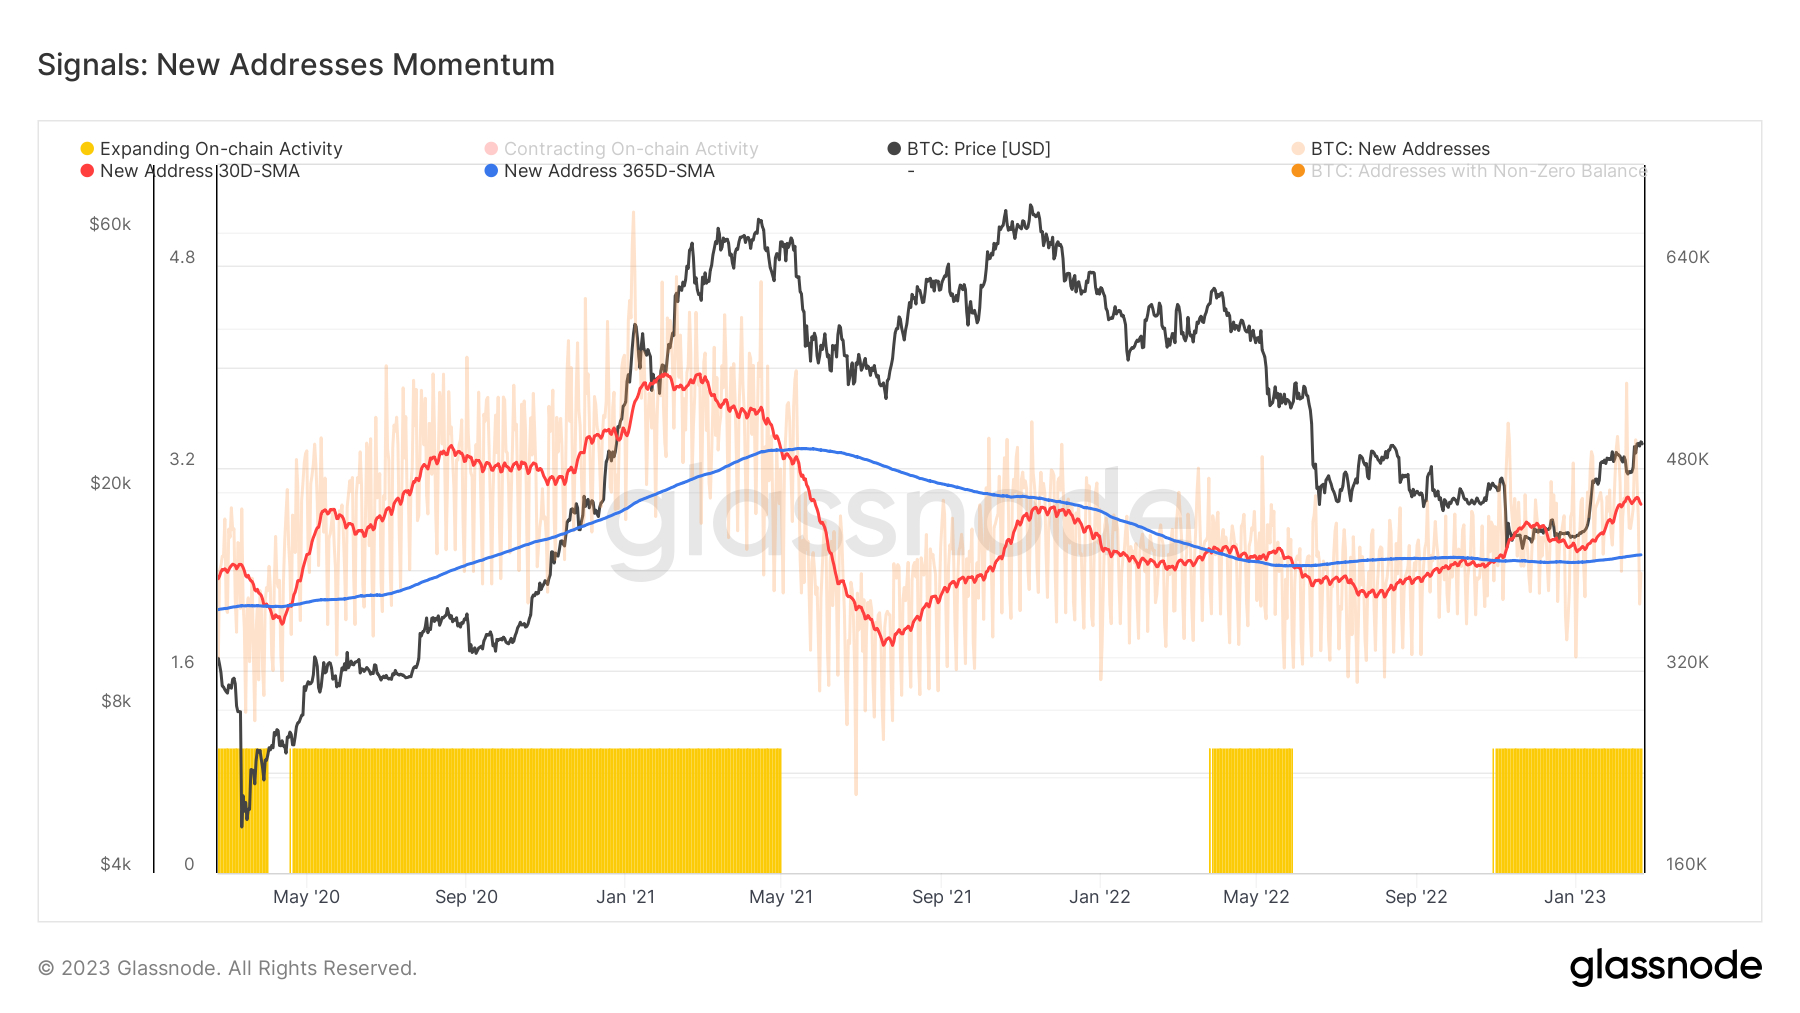
In their “Recovering from a Bitcoin Bear” dashboard of eight on-chain and technical indicators, Glassnode monitors shifts in new wallet address momentum. The crypto analytics firm interprets when the 30-day simple moving average (SMA) of new addresses rises above the 365-day SMA as a bullish signal. “Sustained periods of this condition (30-day SMA above the 365-day SMA) are typical of improving network fundamentals, and growing utilization”, they explain.
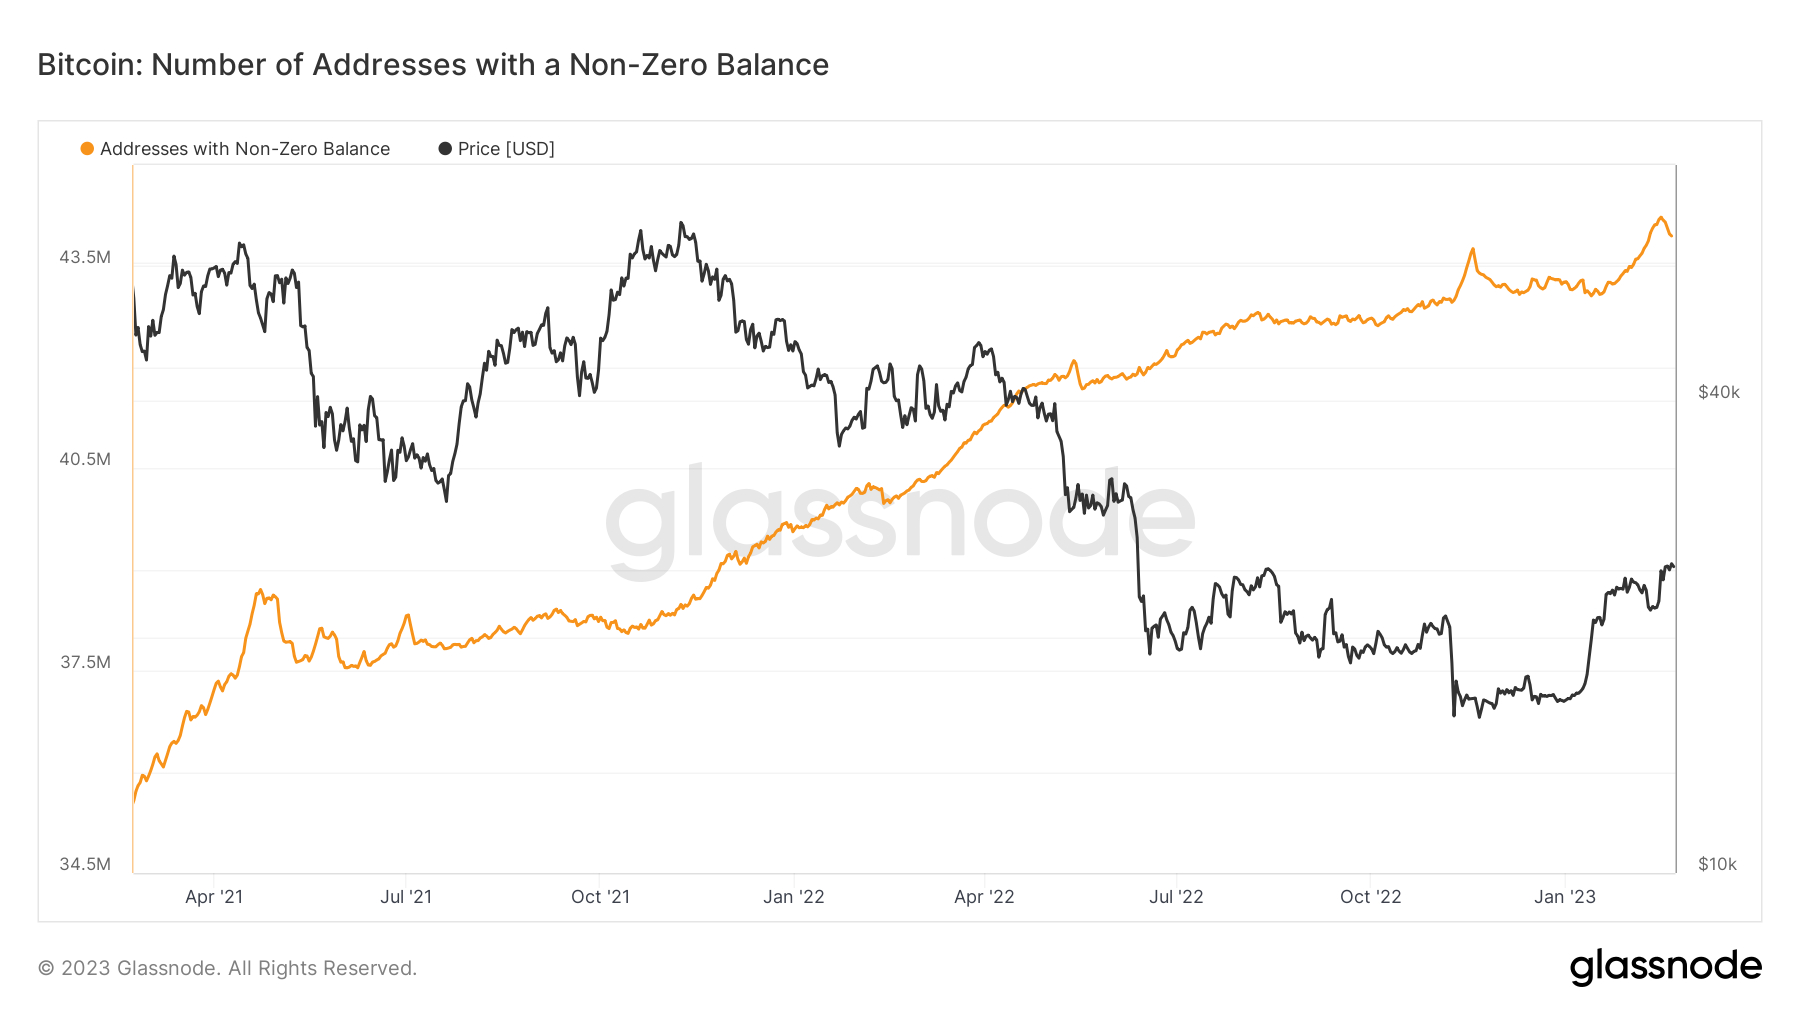
Finally, the number of Bitcoin wallet addresses holding a non-zero BTC balance recently hit new record highs above 44 million for the first time.
Maybe to Early to Call a Massive Rally, But the Bear Market is Probably Over
So Bitcoin on-chain metrics are showing a mixed picture – there are improvements in network fundamentals, but maybe not enough to start betting on a rapid surge back to record BTC price highs. That’s consistent with the idea that macro headwinds, namely continued interest rate hikes from the US Federal Reserve and other major central banks amid sticky inflation, will continue to dampen Bitcoin’s upside potential this year.
That being said, a host of alternative on-chain and technical metrics are all screaming that the bear market of 2022 is probably now over. Seven out of eight of the on-chain and technical metrics tracked by Glassnode in their “Recovering from a Bitcoin Bear” dashboard are flashing green. The dashboard tracks eight indicators to ascertain whether Bitcoin is trading above key pricing models, whether or not network utilization momentum is increasing, whether market profitability is returning and whether the balance of USD-denominated Bitcoin wealth is in favor of the long-term HODLers.
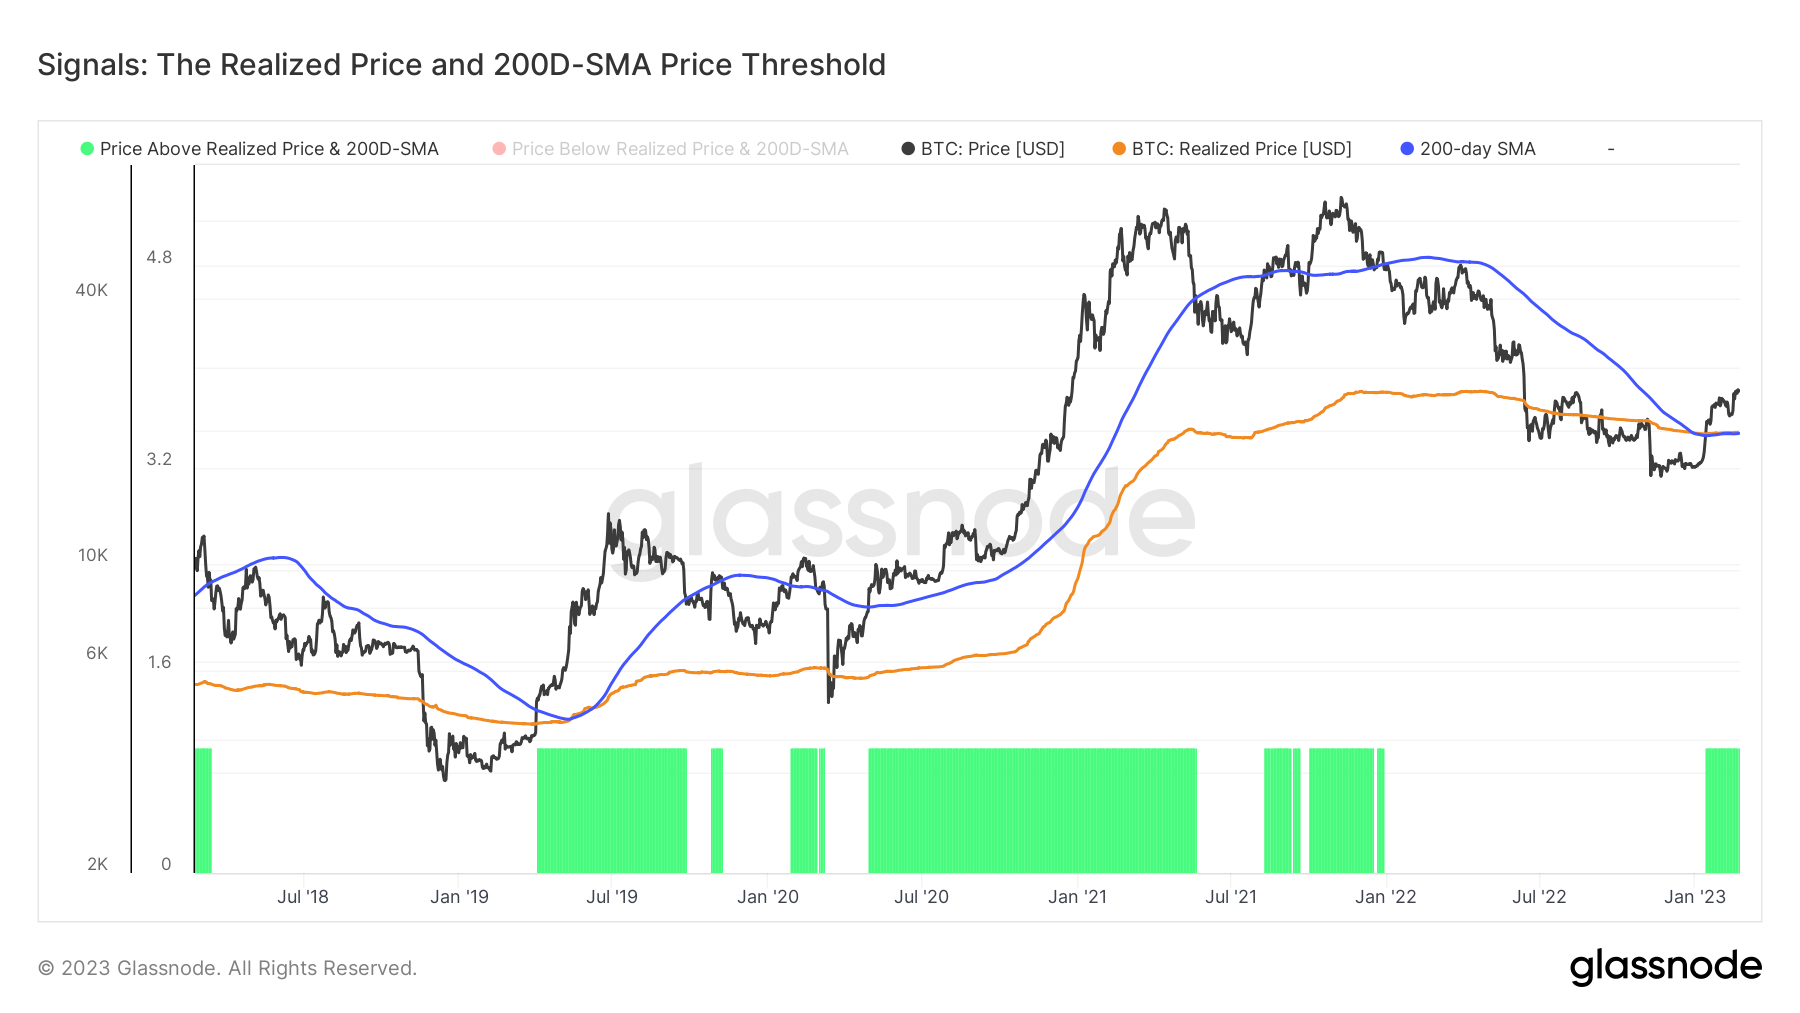
Regarding where Bitcoin is trading versus key pricing models, BTC this year surged above its 200-Day Moving Average and Realized Price, both of which sit just under $20,000, a dual bullish sign on the technical front. Another recent technical buy signal that got the bulls excited was Bitcoin experiencing only its seventh “gold cross” in the last 10 years. Elsewhere, the number Bitcoin wallet addresses holding a non-zero balance recently surged to a new all-time high, a sign that new investors are flooding in.

Other on-chain indicators tracked by Glassnode like Bitcoin’s Reserve Risk, as discussed in this recent article, a the MVRV-Z score, which “compares market value and realized value to assess when an asset is overvalued or undervalued”, are also screaming bull signals. The latter recently mustered a sustained recovery back above zero after a prolonged period below, which has historically occurred at the start of bull markets.
Elsewhere, another market profitability indicator tracked by CryptoQuant, another crypto analytics firm, is giving off a definitive buy signal for the first time since 2019.
CryptoQuant PnL Index Confirms Early Bull Market For Now
— CryptoQuant.com (@cryptoquant_com) January 26, 2023
1/7 🧵👇 pic.twitter.com/ShhqUR1xEl
Meanwhile, bulls are also taking solace from analysis of the market cycles that the world’s largest cryptocurrency by market capitalization has historically followed. In early January, crypto-focused Twitter account @CryptoHornHairs identified that Bitcoin is following nearly exactly in the path of a roughly four-year market cycle that has been respected perfectly now for over eight years.
$BTC #Bitcoin
— HornHairs 🌊 (@CryptoHornHairs) January 12, 2023
2015-2017 bull market: 1064 days
2017-2018 bear market: 364 days
2018-2021 bull market: 1064 days
2021-*current* market low: 364 days
Days left until the top if we just carbon copy the cycle timeframe again: 1001 days pic.twitter.com/KoNZxJRuy5
Elsewhere, a widely followed Bitcoin pricing model is sending a similar story. According to the Bitcoin Stock-to-Flow pricing model, the Bitcoin market cycle is roughly four years, with prices typically bottoming somewhere close to the middle of the four-year gap between “halvings” – the Bitcoin halving is a four-yearly phenomenon where the mining reward gets halved, thus slowing the Bitcoin inflation rate. Past price history suggests that Bitcoin’s next big surge will come after the next halving in 2024.