Bitcoin “Golden Cross” Confirmed – What Next for BTC Price?

An important technical event just occurred in the Bitcoin market. For the first time in more than a year, Bitcoin’s 50-Day Simple Moving Average (SMA), now at $19,825 just moved to the north of its 200-Day SMA, now at $19,723. When the 50-Day SMA moves above the 200-Day SMA, technicians refer to this as a “golden cross” – a sign that there has been a meaningful positive shift in the market’s momentum. Tuesday’s golden cross is only Bitcoin’s seventh in the last 10 years.
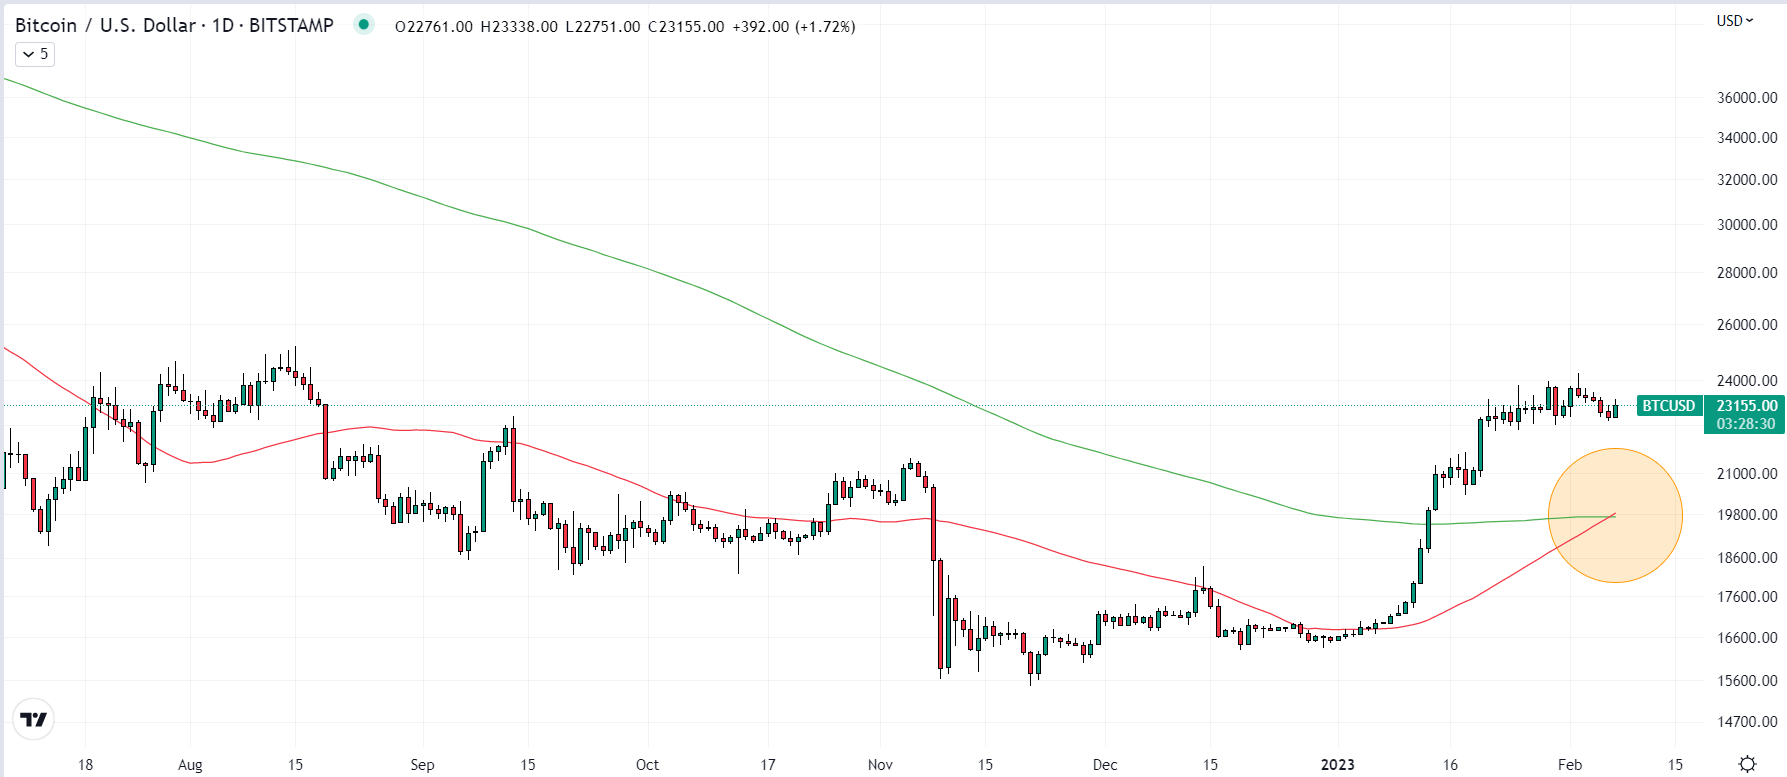
Some analysts see a golden cross as a buy signal, or at least include it in the suite of technical and other indicators that they monitor when making trading decisions. Both the 50 and 200-Day SMAs are widely followed technical indicators by investors, hence a golden cross could potentially lead to higher buying pressure in the Bitcoin market, should it encourage more buyers to enter the market.
What Next For Bitcoin After the Golden Cross?
With the golden cross now confirmed, many investors are asking whether this is a good buy signal. Not necessarily. As discussed in a recent article, golden crosses have a mixed history of success as a Bitcoin buy signal.
If you were to have bought Bitcoin at the time of each of the last seven golden cross events and held for 90 days, you would have been up on your investment four out of seven times. The margin of these gains would have varied wildly between 10-80%. One time out of seven, you would have been flat after 90 days, and on two occasions you would have been down (by 20% and 45%).
If you were to have held for 365 days, you would have been up five out of seven times. Again, the magnitude of gains over this time period varies wildly from 25% to 400%. The two occasions when you would have been down after 365 days coincided with the brutal bear markets of 2014 to early 2015 and of late 2021 into late 2022.
If you tweak the buy signal and only buy when a golden cross happens after the 50-Day SMA has been below the 200-Day SMA for a prolonged period of time (i.e. after a Bitcoin bear market, not during a choppy bull market), the results are arguably more bullish. If you bought and held for 365 days after the July 2015, October 2015 and April 2019 golden cross events, you would have returned a respective (roughly) 130, 120 and 25%.
As in these aforementioned occasions, the latest golden cross has happened after the 50-Day SMA had been underneath the 200-Day SMA for a prolonged period of time. Given historical precedent, a 100% gain in the next year is feasible. In other words, we could easily be talking about Bitcoin hitting the mid-$40,000s in early 2024.
Bitcoin Also Sees Weekly Death Cross, But Bottom Could Well Be In?
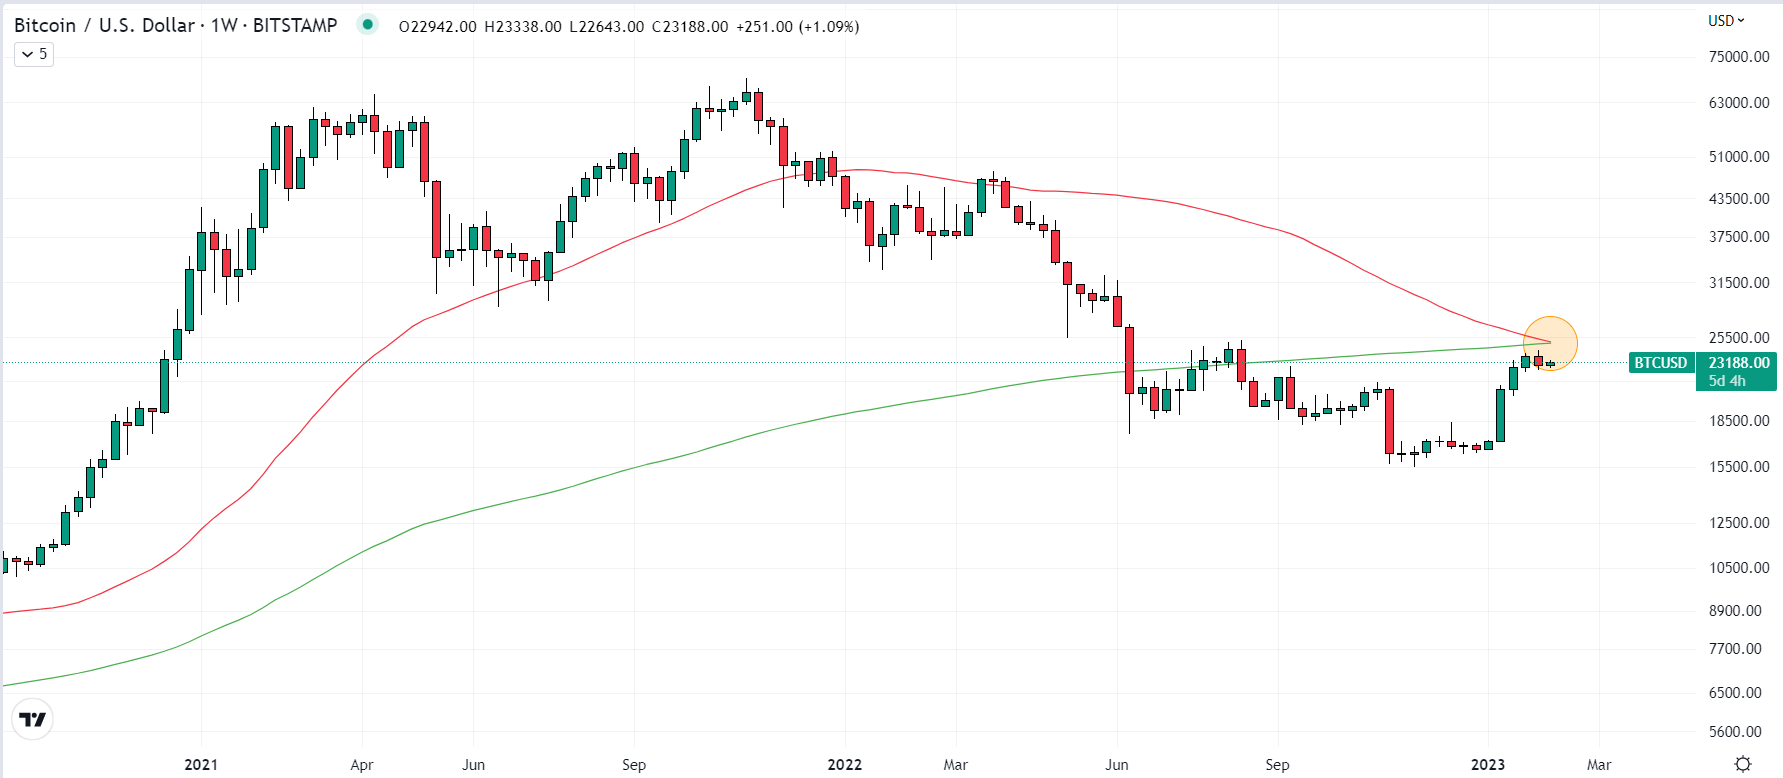
Complicating things is that Bitcoin has just seen its first-ever “death cross” on the weekly candle sticks. More specifically, the 50-Week SMA has moved under the 200-Week SMA for the first time in the cryptocurrency’s history, a signal that the Bitcoin bears will surely be clutching onto.
However, that is just one bearish signal against a mounting list of bullish signals. As also discussed in a recent article, seven out of eight technical and on-chain indicators tracked by analysts at crypto analytics firm Glassnode in their “Recovering from a Bitcoin Bear” dashboard are flashing that the bottom is in. Separately, another key on-chain indicator tracked by crypto analytics firm CryptoQuant called the Profit and Loss (PnL) Index just sent a definitive buy signal for the first time since 2019.
Positive on-chain and technical signs come as Bitcoin’s adoption by the broader population continues, with the number of non-zero balance wallet addresses likely to soon hit a new record high. Meanwhile, analysis of Bitcoin’s long-term market cycle, such as a recent thread from @CryptoHornHairs and according to Bitcoin’s stock-to-flow pricing model, suggest the cryptocurrency is probably in the early stages of a multi-year bull market.
One threat to the bull narrative is if the US Federal Reserve is forced to take interest rates higher than markets are currently pricing for in 2023. Markets are currently betting on a few more rate hikes to around, or just over 5.0%, before rate cuts arrive late in the year. But as Fed Chair Jerome Powell warned on Tuesday, if the US jobs market remains as strong as it has been as of late, more tightening might be required. However, we are still only talking about a potential 100 bps of additional rate hikes this year, much less than the more than 400 bps of tightening seen in 2022.