Bitcoin Historical Performance is No Guide for the Future in 2022


May turned out to be yet another disappointing month for bitcoin (BTC), despite promising predictions based on its historical performance. So, with that in mind, how reliable really are historical patterns for the price of bitcoin today?
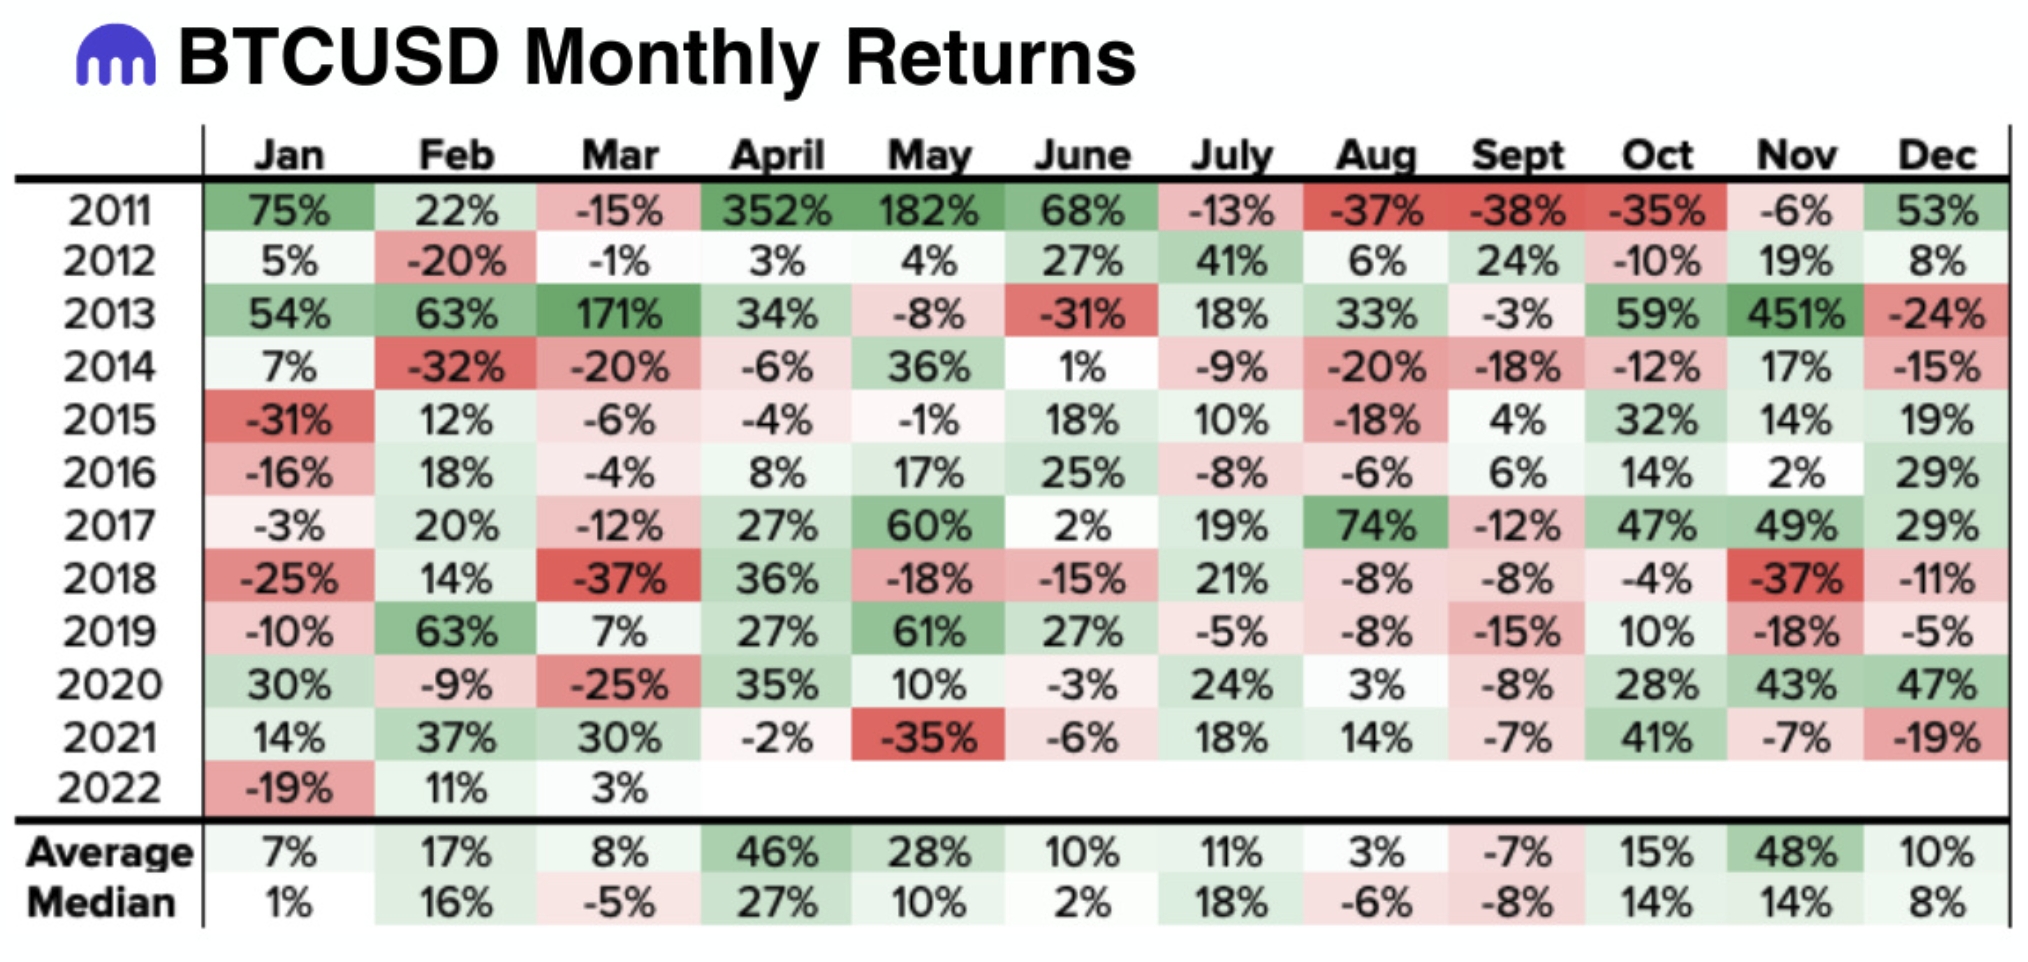
Using crypto exchange Kraken’s monthly market outlook as a guide, it’s clear that performance in May came in short of expectations. With a fall of 16%, bitcoin’s performance ended up far from its historical median return for May of 10%.
Similarly, we can go back and look at how the number one cryptocurrency has performed every month this year compared to its historical performance.
April, a month that Kraken in its market report had described as “historically a very strong month” for bitcoin with a median gain of 27%, also ended up far below expectations. Over the course of the month, the price fell 18%.
March, on the other hand, ended up better than expected. Compared to a median return in March of -5%, bitcoin’s third month this year came in with a positive return of 3%.
In February, bitcoin’s actual performance lined up better with its historical prices. Compared to a historical median price of 16%, the coin ended up returning 11%.
Lastly, January – a rather weak month historically – saw an even weaker actual performance in 2022. Compared to a historical median return of 1%, the month ended up with a loss of 19% for bitcoin.
| Jan | Feb | Mar | Apr | May | |
| Historical median performance | 1% | 16% | -5% | 27% | 10% |
| Actual performance in 2022 | -19% | 11% | 3% | -18% | -16% |
As is pretty obvious from the table above, historical monthly returns have so far not been a good indicator for future returns in any particular month this year, perhaps with the exception of February.
Also worth noting is the fact that performance every month so far in 2022 – except for March – has been weaker than the historical median would suggest. This was also clearly shown in a graph shared by Kraken in its latest market recap for May:
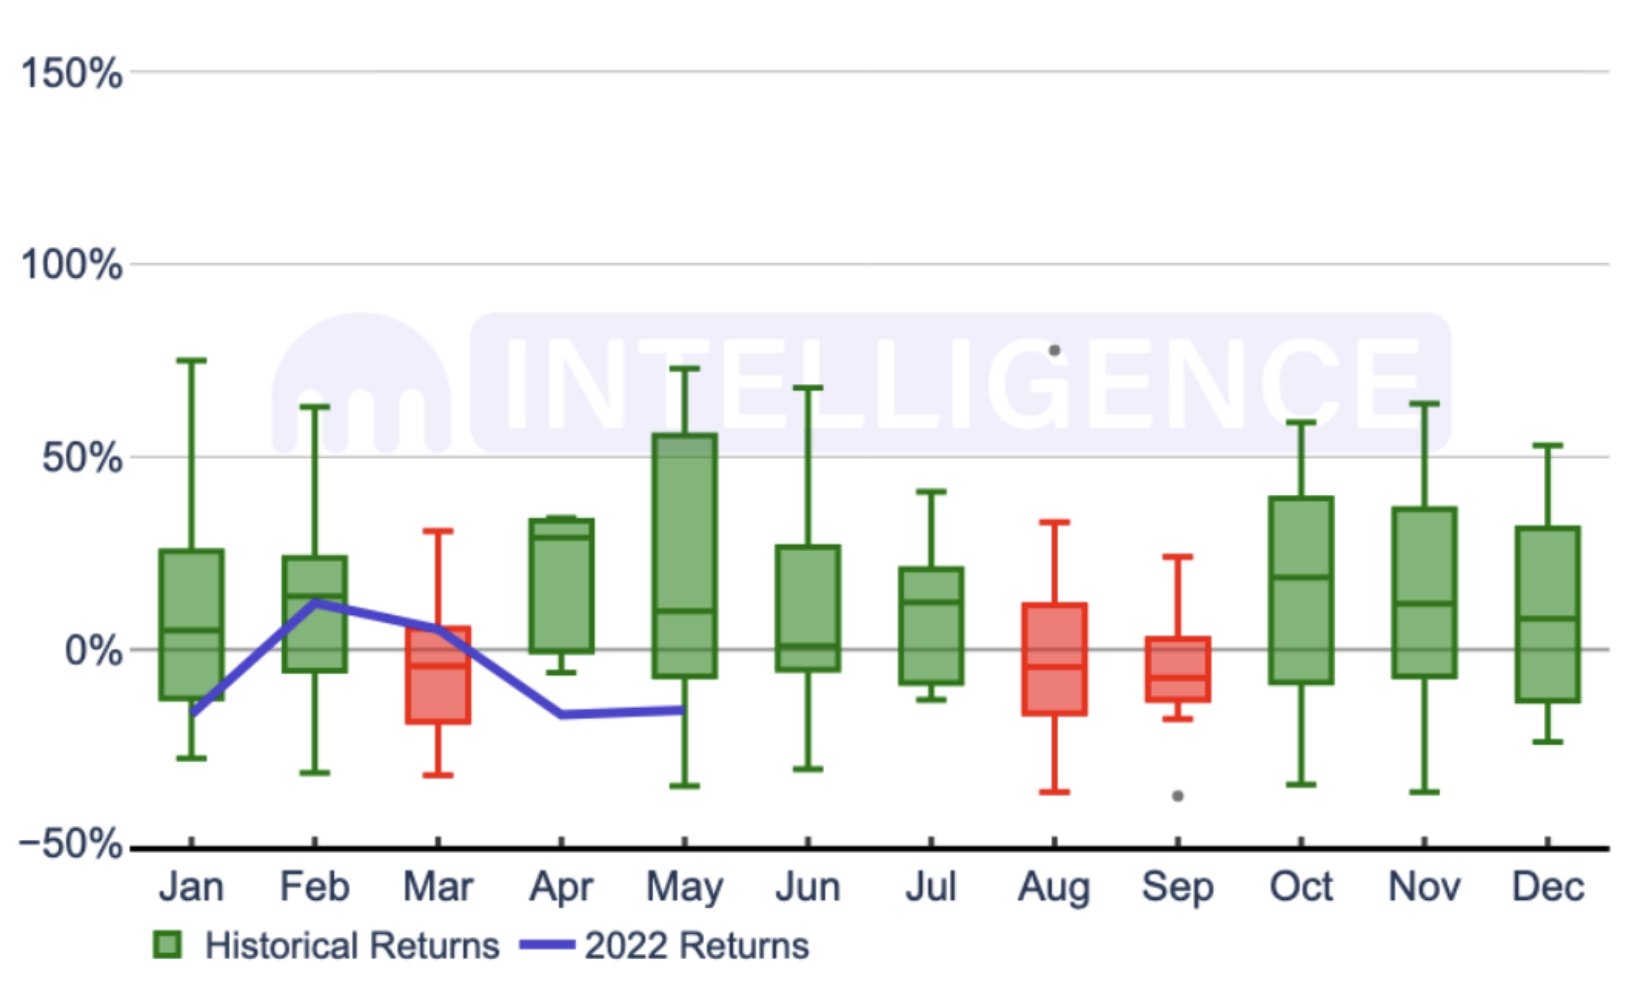
However, for those still holding some faith that history will be a guide, however, both June and the remainder of the year do look promising.
According to Kraken’s historical data, which goes back to 2011, June has seen a median return of 2% for bitcoin. Following that, the last five months of the year have seen median returns between -8% and 18%, the data showed.
At 11:05 UTC on Wednesday, bitcoin is trading at USD 30,381. It is up 2.8% in a day, down 4.7% in a week, and down nearly 11% in a month, per CoinGecko. It is also down just below 56% from its November 2021 all-time high.
____
Learn more:
– April is Historically ‘Very Strong Month’ for BTC; AVAX & LUNA Show Potential – Analysts
– Bitcoin Ends Record-Long Losing Streak, BTC Inflows Grow, Ethereum Sees Outflows
– USD 25K-USD 27K per Bitcoin Is ‘This Cycle’s Bottom’ – Arthur Hayes
– As inflation ‘Mellows Out’, a Bottom in Crypto is Likely in ‘The Back Half of 2022’ – VC Investor
– ‘Nothing New at All’ in Research Paper That Accuses Bitcoin of Early Centralization
– Report on Lightning Network-Powered DeFi and NFTs Dismissed Even by Bitcoin Advocates