Best Crypto to Buy Now September 6 – Synthetix, Chainlink, Render


Investment manager Grayscale is urging the Securities and Exchange Commission (SEC) to expedite the conversion of the Grayscale Bitcoin Trust (GBTC) into a Bitcoin exchange-traded fund (ETF).
This comes on the heels of Grayscale’s major court victory over the SEC last week.
Given the latest updates on a potential Bitcoin ETF approval, what are the best cryptos to buy now?
In a letter to the SEC, Grayscale lawyers have requested an urgent meeting to discuss a path forward for approving the conversion of GBTC into an ETF.
They argued the SEC no longer has grounds to deny the conversion after the U.S. Court of Appeals for the D.C. Circuit ruled the agency “erred” in previously rejecting Grayscale’s ETF application.
The unanimous ruling stated the SEC acted “arbitrarily and capriciously” in rejecting GBTC’s ETF bid while approving ETFs holding Bitcoin futures contracts.
According to Davis Polk attorney Joseph Hall, who penned the letter, the court decision showed additional fraud surveillance agreements, like those between ETF issuers and crypto exchange Coinbase, are unnecessary for Bitcoin ETF approval.
The window for the SEC to appeal the ruling is closing, with a mid-October deadline to request a rehearing. While the agency could try bringing the case to the Supreme Court, analysts say an appeal is unlikely to succeed.
“Each day that passes without listing the Trust’s shares on NYSE Arca is another day when the Trust’s existing investors bear unjustified harm,” Hall wrote in the letter. GBTC currently trades at a 20% discount to its underlying Bitcoin holdings.
Other major asset managers, including BlackRock and Fidelity Investments, have Bitcoin ETF applications pending with the SEC.
The recent court decision signals approvals could come as soon as this year, though the SEC still has the option to appeal and delay a final decision until 2024.
According to analysts, the SEC may choose to delay ETF approvals while considering all applications simultaneously. However, with hundreds of millions in assets already invested in existing futures-based Bitcoin ETFs, the SEC is unlikely to rescind those approvals.
SEC Chair Gary Gensler is expected to face questions on how the agency plans to respond to the court ruling during upcoming Congressional testimony next week.
For now, the Grayscale Bitcoin Trust continues to trade at a discount to its Bitcoin holdings despite rising 0.4% on the day of the ruling.
Given the current conditions of the cryptocurrency market, Synthetix, Wall Street Memes, Chainlink, Bitcoin BSC, and Render stand out as some of the best cryptos to buy now thanks to their strong fundamentals and/or positive technical analysis.
Synthetix (SNX) Faces Resistance: Examining the Roadblocks to Price Breakthrough
Following an impressive five-day run, Synthetix (SNX) has demonstrated a bullish streak that market participants are watching closely.
In spite of a slight pullback today, the broader trend for SNX remains promising, though not without its challenges.
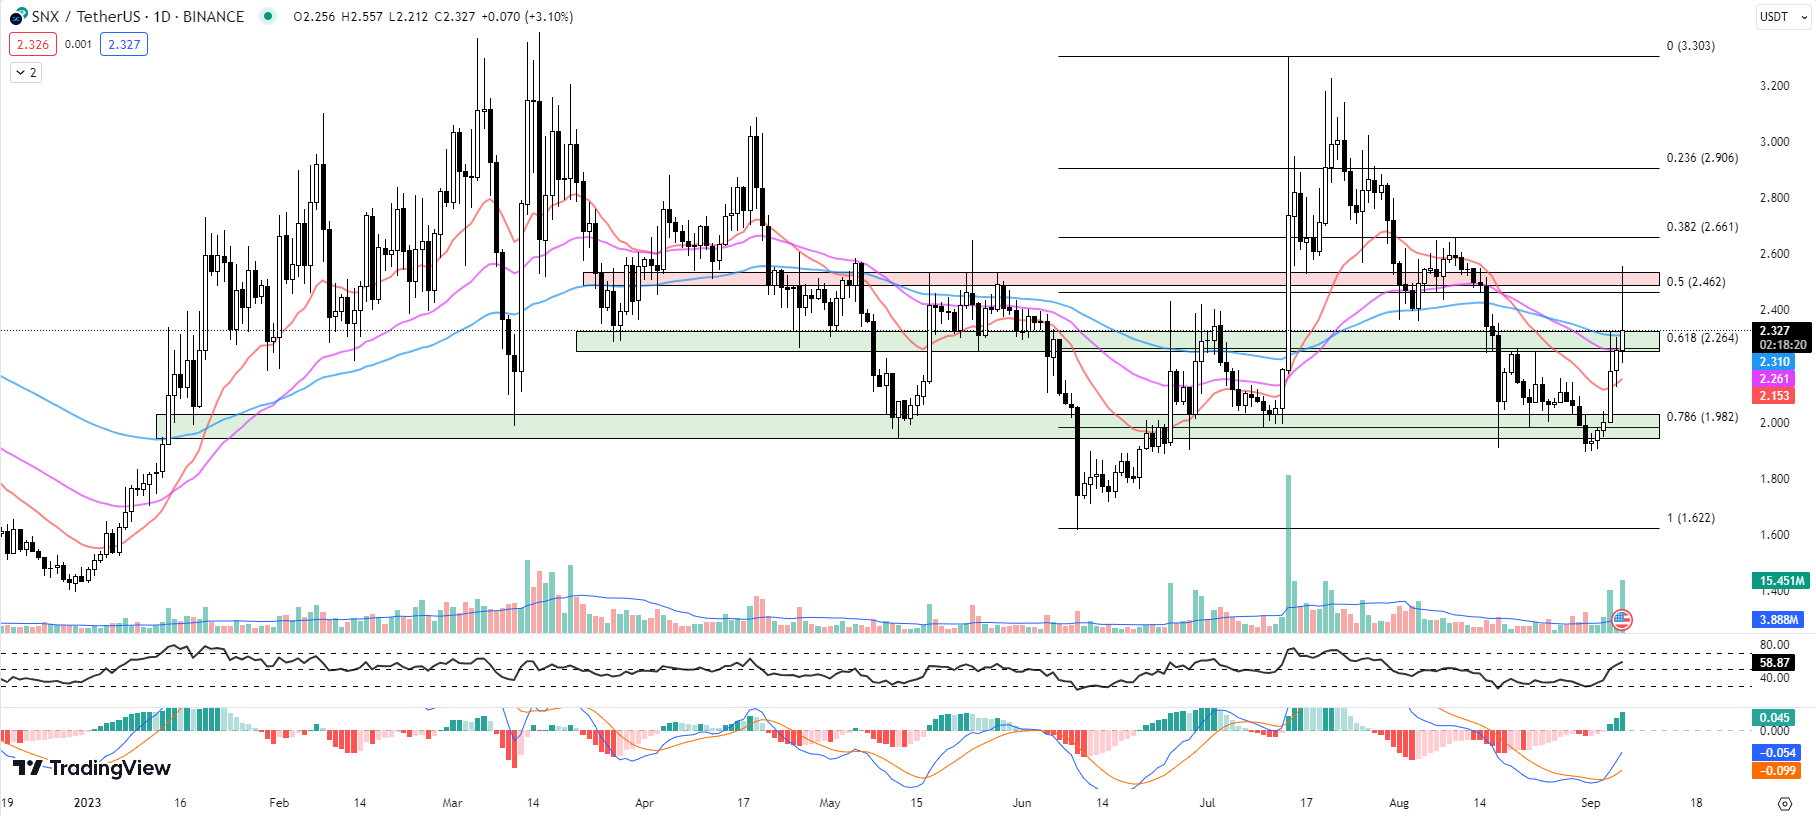
SNX is currently trading at $2.327 and had earlier tried to breach the Fib 0.5 level resistance of $2.462 and the horizontal resistance zone of $2.490 to $2.536 when it set an intraday high of $2.557.
However, selling pressure impeded the upward momentum, pushing it back to a level just above the previous resistance-turned-support zone of $2.255 to $2.323.
SNX’s battle to reclaim the Fib 0.5 level earlier today underscores the significance of these resistance levels.
A closer look at its key technical indicators reveals a nuanced picture. SNX bounced off the 20-day EMA of $2.153 yesterday, signifying a strong bullish sentiment.
Additionally, the current trading price of SNS at $2.327 is trading above both the 50-day EMA of $2.261 and the 100-day EMA of $2.153.
This indicates that the cryptocurrency is in a potential bullish phase as it’s maintaining a position above these key medium to long-term exponential moving averages.
SNX’s RSI has slightly increased to 58.87 from yesterday’s 55.16. This value suggests that SNX is neither overbought nor oversold at the moment, but is edging closer to the overbought territory.
The MACD histogram has also risen to 0.045 from 0.031, signaling a bullish bias in the short term. The uptick in the histogram indicates that the pace of upward price movement is accelerating.
Meanwhile, SNX’s market cap has risen by 2.57% to $627.7 million, and its 24-hour trading volume has spiked by a substantial 162.55% to $132.8 million. This uptick in volume could suggest increased interest in SNX, potentially leading to higher price volatility.
Despite today’s minor setback, the technical indicators point towards a continued bullish trend for SNX. The immediate goal for SNX is to surpass the 100-day EMA by the close of the trading day.
However, investors should be cautious and watch for potential resistance at the Fib 0.5 level and the horizontal resistance zone of $2.490 to $2.536.
On the downside, the horizontal support zone of $2.255 to $2.323 coupled with the 50-day and 100-day EMAs will serve as key support levels that should contain any short-term selling pressure.
While the broader trend for SNX remains bullish, the potential for volatility underscores the importance of closely monitoring these key technical indicators and being prepared to react to market movements.
Wall St Memes Token Nears End of Presale Phase Amid Strong Community Support
As the Wall Street Memes (WSM) token presale draws to a close, its significant achievement of securing over $25 million in funding cannot be overlooked.
The formation of Wall Street Memes was significantly influenced by the Wall Street Bets movement and the GameStop short squeeze saga. The community brings together elements of finance, online culture, and memes to offer a fresh take on traditional finance.
Currently priced at $0.0337 in its presale, the Wall Street Memes presale has already secured over $25 million in funding. Payment options for prospective buyers include Ethereum (ETH) and Tether (USDT).
After its introduction, the Wall Street Memes staking service has seen a steady growth in usage. 28.8% of the presale allocation of one billion tokens has been staked so far.
According to the project’s staking dashboard, those who will stake WSM tokens now can expect an annual yield of 70%, although this figure is expected to decrease as more tokens are staked.
Staking serves two primary functions for the Wall Street Memes coin. It encourages long-term holding by providing a passive income source. Additionally, it can provide price stability by reducing the selling pressure when the coin is publicly launched.
This approach has been previously applied successfully by coins like BTC20, which also focuses on staking.
Wall Street Memes already boasts an impressive online community, having garnered a following of more than a million retail investors. Their Wall Street Bets Instagram account alone has 811,000 followers.
Additionally, their reach extends to other Instagram channels like wallstgonewild and wallstbullsnft, which collectively have over 100,000 followers.
Propelled by an energetic community and presale success, the next chapter for Wall Street Memes will commence when WSM lists on major crypto exchanges on September 27.
Chainlink (LINK) Gains Momentum: Could a Bullish Surge Be Imminent?
As Chainlink (LINK) continues to consolidate within the confines of a well-established trading range, several key technical indicators offer a promising forecast.
Investors, traders, and enthusiasts are all keeping a close eye on this well-known altcoin, which has recently shown signs of a potential breakout.
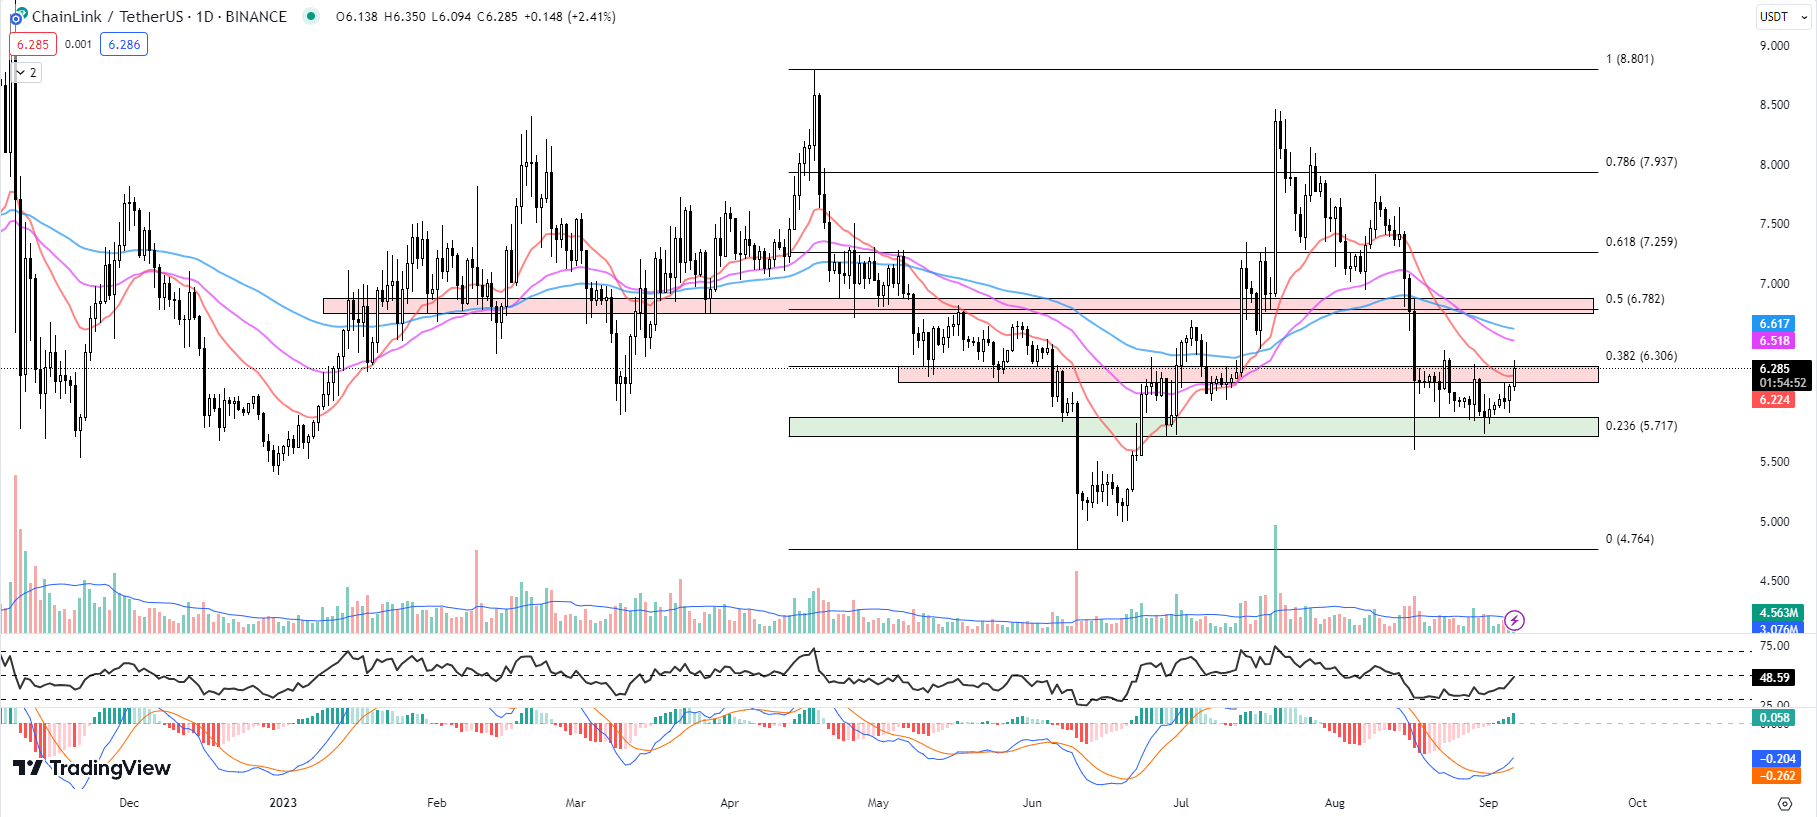
The current trading range for LINK is defined by a high of $6.435 and a low of $5.730.
A breakout from this consolidation would effectively print a higher low in relation to its previous low of $4.761 registered back on June 10. This potential higher low is often considered a bullish signal, suggesting a continued uptrend for Chainlink.
LINK’s 20-day Exponential Moving Average (EMA) is currently at $6.224, sitting just below the current price of $6.285, which is up by 2.41% so far today.
The 50-day and 100-day EMAs are $6.518 and $6.617, respectively. These values indicate that the price is consolidating below the EMA resistance levels, potentially setting the stage for an upward move.
LINK’s Relative Strength Index (RSI) has increased from yesterday’s 43.56 to a current value of 48.59.
This uptick suggests growing bullish momentum, but it’s still below the neutral threshold of RSI50 which warrants caution as a rejection at this significant level is a possibility.
The MACD histogram has also risen from yesterday’s 0.039 to 0.058. This increase also suggests a growing bullish momentum.
The market cap of LINK has increased by 2.61% to $3.3 billion, and the 24-hour volume is also up by 45.23% to $187.8 million. Increases in volume often precede price increases, suggesting a heightened interest in the asset.
Chainlink currently faces substantial resistance at the $6.167 to $6.307 level, which is in confluence with the 20-day EMA at $6.224 and the Fib 0.382 level at $6.306. If LINK successfully overcomes this resistance, the next hurdle is the 50-day EMA at $6.518.
The immediate support zone for Chainlink is between $5.714 and $5.878, in confluence with the Fib 0.236 level of $5.717. This area serves as a safety net, potentially preventing further downward movement.
While Chainlink is currently trading in a tight range, the technical indicators suggest a growing bullish momentum. Traders could consider looking for buying opportunities if the price breaks above the resistance zone with significant volume.
Bitcoin BSC Offers Native Token at 2011 Bitcoin Prices; One of the Best Cryptos to Buy Now
Bitcoin BSC is giving early investors the opportunity to purchase its native token, BTCBSC, at the nostalgic price of $0.99—equivalent to Bitcoin’s value a decade ago.
This new token is among the latest entries in a series of tokens often referred to as ‘Bitcoin clones’. These tokens, such as BTC20, an ERC-20 version of Bitcoin, have sometimes outperformed the original Bitcoin, at least in the short term.
For example, BTC20 saw a 688% return on its presale. Meanwhile, Bitcoin’s value has declined by 11.3% over the past month, partly due to a lack of enthusiasm around a potential spot Bitcoin ETF.
According to the project’s website, Bitcoin BSC is fundamentally different from Bitcoin in two main ways. First, it operates on Binance’s BNB Smart Chain, which supports proof-of-stake mining. This leads to the second difference: Bitcoin BSC provides staking rewards.
Those who invest in BTCBSC can stake their tokens to validate transactions on the blockchain, earning rewards without the need for traditional Bitcoin mining. New BTCBSC rewards will be released every 10 minutes, similar to the schedule of Bitcoin block rewards.
The tokens used for staking are locked for a seven-day period, and the reward received by investors is proportional to the number of tokens they have staked relative to the total staking pool.
About 69% of the total BTCBSC token supply has been allocated for staking rewards, with enough tokens to continue this for approximately 120 years.
One advantage of BTCBSC over similar tokens is that transactions on the BNB Smart Chain are both fast and low-cost. Transactions can cost as little as an estimated $0.10, compared to transaction fees of up to $10 on the Ethereum blockchain for tokens like BTC20.
Additionally, BEP-20 tokens such as BTCBSC are compatible with decentralized wallet apps like MetaMask and Trust Wallet.
BTCBSC’s presale currently offers a limited supply of 6,125,000 tokens for purchase, while the remaining 14,455,000 tokens are reserved for staking rewards.
The presale has a soft cap of $3.96 million. After the presale ends, Bitcoin BSC plans to make the token available on a decentralized exchange based on the BNB Smart Chain.
For those interested in more details, the Bitcoin BSC whitepaper is available for review, and updates can be found on the project’s Twitter and Telegram accounts.
Render (RNDR): Reclaiming Support Levels Amidst Bearish Trend
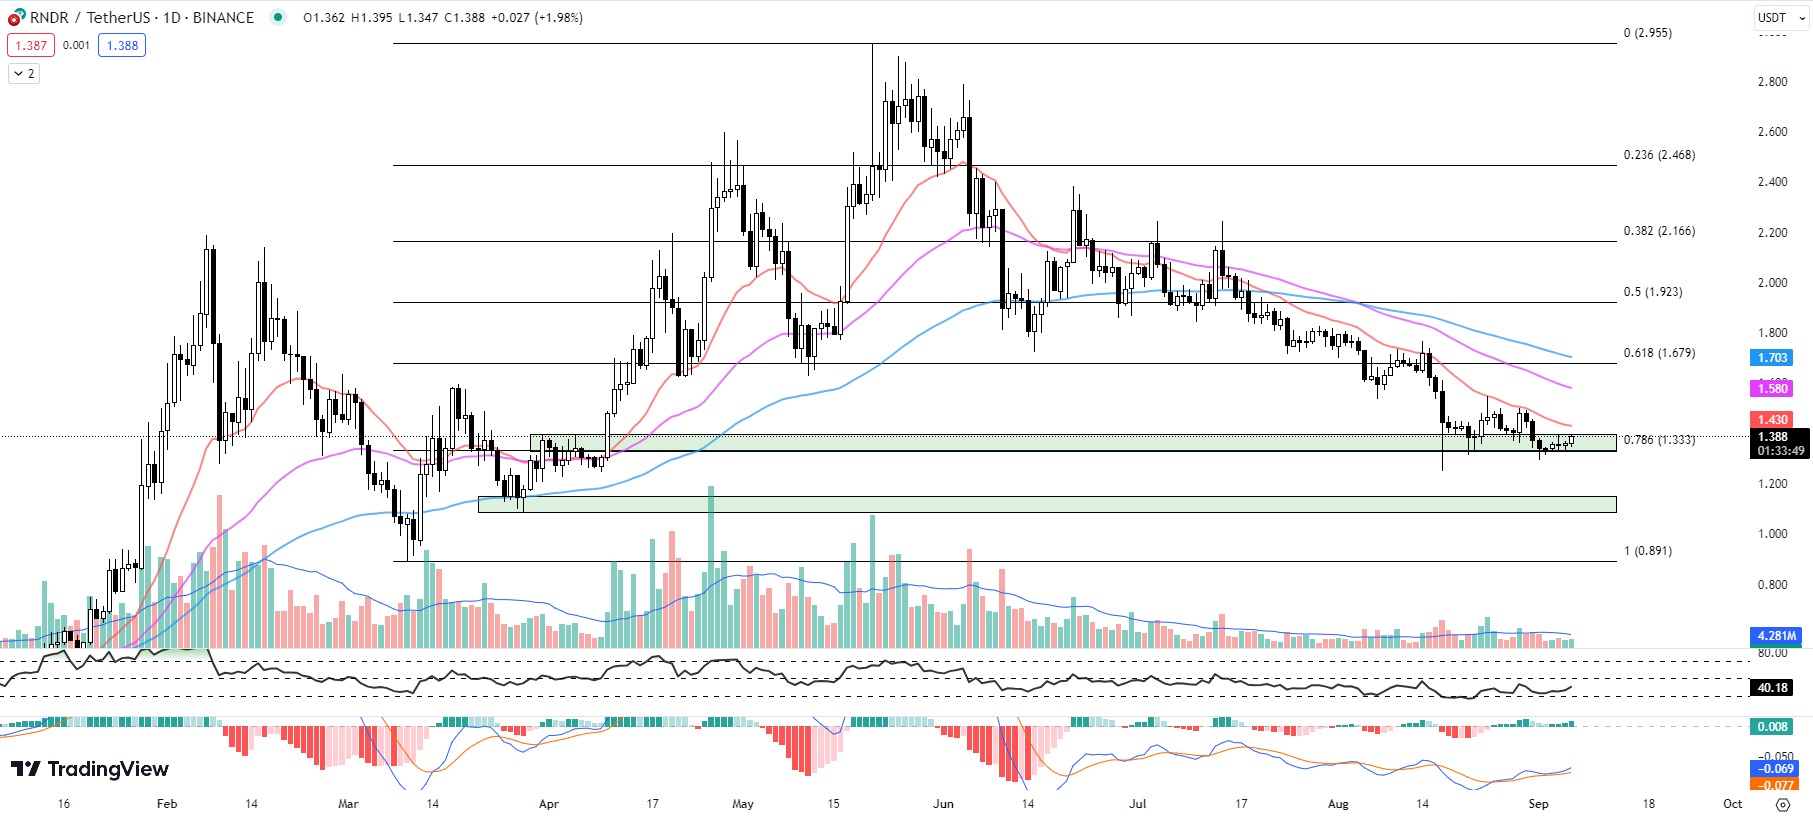
Render (RNDR) continues to navigate a bearish phase that has dominated its price action for the past 108 days.
After reaching a year-to-date high of $2.950 on May 21, the cryptocurrency has been on a steady decline. The bearish trend is further confirmed by the bearish alignment of its short to long-term EMAs.
RNDR’s current price of $1.388, a 1.98% increase so far today, is at a crucial juncture. Sitting just above the horizontal resistance zone of $1.331 to $1.399 and the Fib 0.786 level of $1.333, RNDR has to maintain these support levels to avoid a further downward spiral.
The 20-day EMA at $1.430 is a key indicator to monitor. The price of RNDR has been trading below this key EMA for the past 50 days, signaling a persistent bearish trend.
A successful breach above the 20-day EMA may indicate a potential price reversal. This would be a significant shift, as it would signal the first bullish trend in over 3 months.
Meanwhile, RNDR’s RSI has seen a minor uptick from 34.82 to 40.18 in just a day, suggesting a slight increase in buying pressure. However, an RSI below 50 still indicates that the bears are in control of the market.
The MACD histogram has also shown a slight increase, moving from 0.005 to 0.008. While this is a minimal shift, traders should closely watch for a potential cross above the zero line, which would mark a shift to bullish momentum.
Looking ahead, RNDR faces immediate resistance at $1.430, which is parallel to the 20-day EMA, followed by the 50-day EMA at $1.580. Overcoming these resistance levels would be a strong bullish indicator, potentially signaling a shift in the ongoing bearish trend.
Investors should tread cautiously with RNDR, given its prevailing bearish trend. The next few trading days are critical for RNDR as it battles to reclaim the 20-day EMA and resist falling below its immediate support levels.
Disclaimer: Crypto is a high-risk asset class. This article is provided for informational purposes and does not constitute investment advice. You could lose all of your capital.