Best Crypto to Buy Now September 5 – Maker, NEO, Polygon

Visa announced on Tuesday that it plans to use the Solana blockchain for settling transactions with USDC, a major stablecoin.
The financial company stated that this decision could speed up cross-border payments and offer an updated method for transferring funds.
With widespread cryptocurrency adoption on the rise, what are the best cryptos to buy now?
The Visa announcement focused on USDC, the second-largest stablecoin in the market. According to the company, utilizing the Solana network for USDC transactions could offer significant benefits, such as faster and more cost-effective cross-border settlements.
The move follows Visa’s ongoing work with USDC since 2021, aimed at streamlining currency conversion in international payments.
After the announcement, Solana’s native token SOL experienced a bump in price. Data from TradingView reveals a 4.10% increase so far today as it currently trades at $20.32.
This shift came in contrast to leading cryptocurrencies Bitcoin and Ether, which remained relatively stable, trading at $25,733.25 and $1,631.06, respectively.
Visa’s move comes on the heels of PayPal’s introduction of its own stablecoin, PayPal USD, aimed at reducing friction in online payments.
Research firm Bernstein has estimated the stablecoin market to reach nearly $3 trillion within the next five years. They anticipate that major global platforms will issue their own stablecoins to facilitate transactions.
Given these projections, the integration of stablecoins like USDC into mainstream financial systems appears to be a growing trend. The developments with Visa and Solana may hold implications for the broader cryptocurrency market.
As stablecoins gain increased importance, their role in shaping the future of digital payments cannot be ignored.
With the present dynamics of the cryptocurrency market, Maker, Wall Street Memes, NEO, Sonik Coin, and Polygon are some of the best cryptos to buy now thanks to their robust fundamentals and/or potential for technical growth.
Awaiting a Significant Break: Maker’s Consolidation Phase Continues

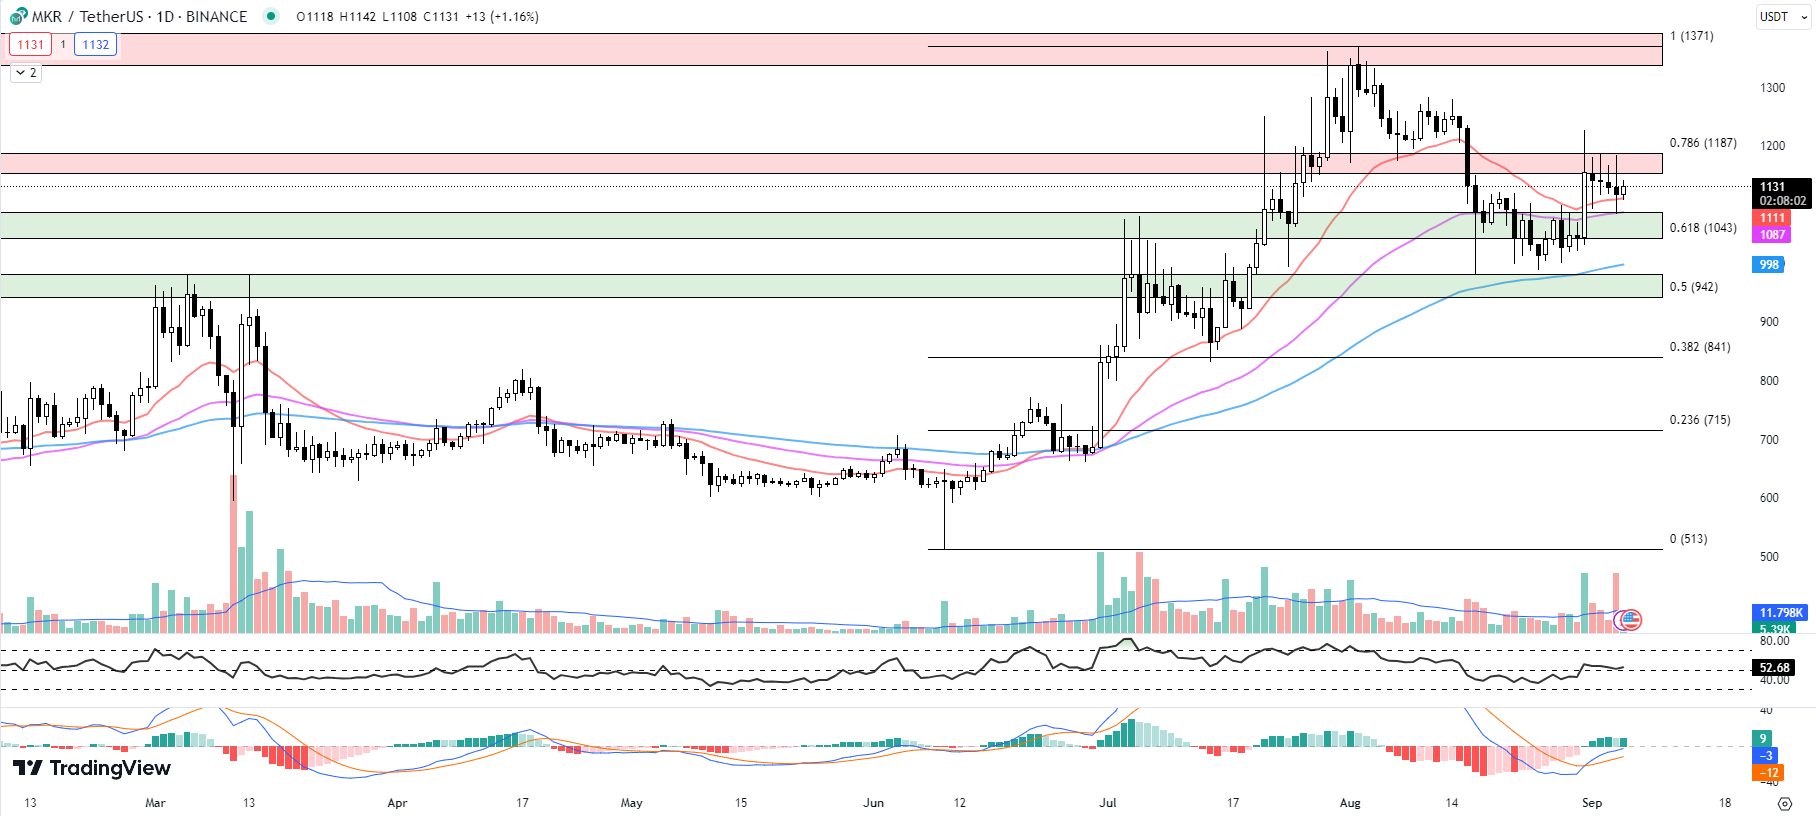
Despite an uptick in price by 1.16% so far today, Maker’s journey towards the critical horizontal resistance zone of $1,153 to $1,187, in confluence with the Fib 0.786 level of $1,187, remains stalled.
This resistance level has proven to be a formidable barrier, leading to ongoing consolidation as the digital currency continues to oscillate between it and the 20-day EMA support level.
MKR’s 20-day EMA is currently at $1,111, providing immediate support to the price, while the 50-day EMA at $1,087 and the 100-day EMA at $998 underline this support.
The positioning of these EMAs indicates a bullish trend in the mid-term, as the 20-day EMA is above the 50-day EMA, which in turn is above the 100-day EMA. However, the strength of this bullish trend is yet to be confirmed.
MKR’s RSI has slightly increased from 51 to 52.68. This movement is rather neutral and does not indicate a clear buying or selling pressure at this moment.
As the RSI remains in the middle of the range, it suggests a balance between bullish and bearish sentiments among traders.
The MACD histogram remains static at 9, indicating a period of stagnation without a clear signal for potential reversals or trend continuation. The MACD’s static nature further confirms the ongoing consolidation phase for MKR.
MKR’s immediate resistance is the horizontal resistance zone of $1,153 to $1,187, which aligns with the Fib 0.786 level of $1,187. This formidable line has prevented MKR from pushing upwards and remains a significant level to watch.
On the downside, the immediate support is the 20-day EMA of $1,111. Should the price break down from this level, the next strong support lies between $1,044 and $1,067, which is in confluence with the Fib 0.618 level of $1,043 and the 50-day EMA of $1,087.
This area could act as a springboard for the price, potentially triggering a strong bounce back if the price dips into this zone.
Traders should be on the lookout for a potential break above the resistance zone or a breakdown below the 20-day EMA.
Given the ongoing consolidation and the lack of clear signals from the RSI and MACD, patience might be the best strategy.
Market participants are advised to wait for a more definitive direction before making a trading decision.
Wall Street Memes Raises Over $25 Million in $WSM Token Presale; One of the Best Cryptos to Buy Now
Building on its success as a prominent curator of financial market memes that have gained significant traction, Wall Street Memes is expanding its digital footprint with the launch of the $WSM token
Prior to this, Wall Street Memes had already established its presence in crypto. Their NFT collection, “Wall St Bulls,” gained significant attention and sold out in less than 30 minutes in 2021.
Now, Wall Street Memes is leveraging its engaged community of over 1 million followers to push further into the cryptocurrency market with a meme coin.
Wall Street Memes has already raised over $25 million in an ongoing presale for $WSM tokens. The initial pricing started at $0.025 per token but has since jumped to $0.0337 amid high demand.
The presale period is expected to close in the coming weeks, with the initial exchange offering set for September 27.
Wall Street Memes has allocated 100% of the token supply to its community members. A portion is reserved for the presale and liquidity, with additional tokens set aside for community rewards.
The $WSM token is also offering staking rewards, with over 281 million tokens already staked for an estimated 71% APY.
Meme or not, Wall Street Memes’ massive following gives $WSM the traction needed for takeoff. If Wall Street Memes can translate its social media dominance into cryptocurrency success, $WSM could deliver substantial returns for early adopters.
NEO: A Potential Price Reversal on the Horizon?

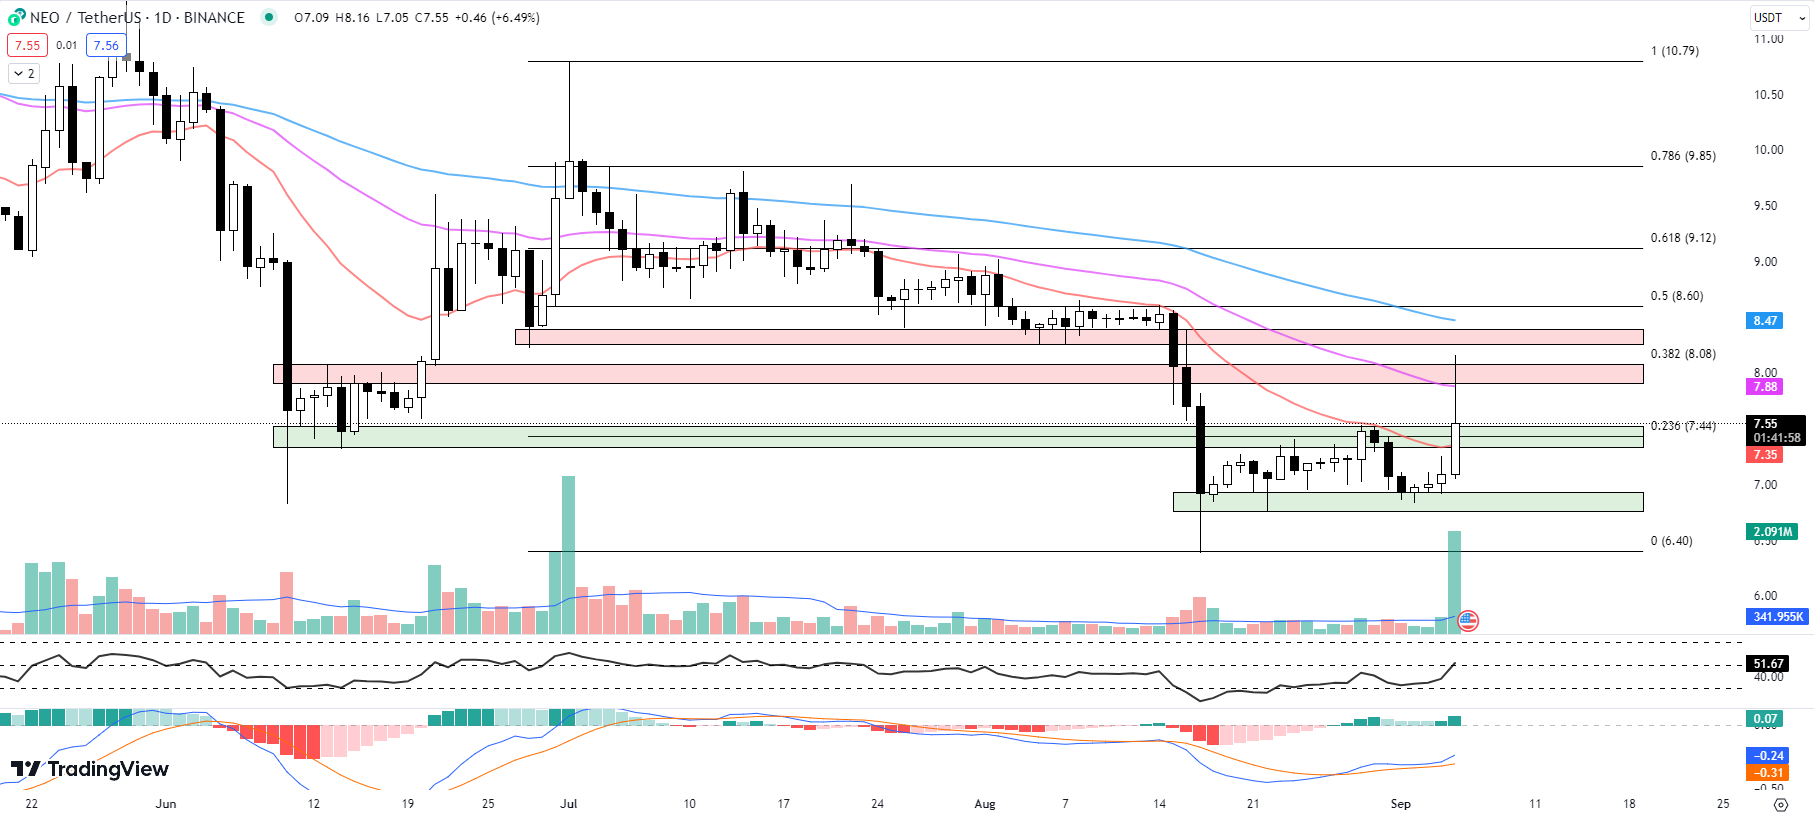
NEO has been stuck in a consolidation phase for the past 19 days. Despite retesting higher resistance levels today, the cryptocurrency was faced with immediate rejection and ensuing selling pressure.
NEO once again trades just above its previous resistance level, with hopes of a potential price reversal pinned on its ability to mount the 20-day Exponential Moving Average (EMA).
The recent price action has left NEO in a delicate position. NEO’s 20-day EMA currently sits at $7.35, slightly below the current price of $7.55, suggesting that NEO is attempting to claw its way back above this level.
However, NEO faces an immediate triple confluence resistance zone of $7.90 to $8.08. This zone is in confluence with the 50-day EMA of $7.88 and the Fib 0.382 level of $8.08, which was retested earlier today where NEO set an intraday high of $8.167 but was unable to sustain.
The 100-day EMA stands at $8.47, marking a further level of resistance for NEO’s price movement. NEO will need to mount and hold this level to confirm a potential reversal in its favor.
Meanwhile, NEO’s RSI has surged to 51.67 from yesterday’s 37.64. This is the first instance since July 23 that NEO is trading above the RSI’s midline of 50. The move above the midline suggests that buying pressure is starting to outpace selling pressure, providing a potentially bullish signal.
The MACD has also seen its histogram rise to 0.07 from yesterday’s 0.03, indicating an upward momentum for NEO.
The market cap of NEO, a measure of the total dollar market value of all of their outstanding shares, has increased by 7.56% to $532.5 million, indicating growing investor interest.
The 24-hour trading volume also shows a significant surge, up by 288.18% to $97.2 million, suggesting increased activity and liquidity in the NEO market.
The immediate support for NEO lies in the horizontal support zone of $7.33 to $7.53. This zone is in confluence with the 20-day EMA of $7.35 and the Fib 0.236 level of $7.44.
NEO is showing potential signs of a price reversal. The surge in RSI and MACD, along with the increase in trading volume and market cap, suggest an increase in bullish sentiment.
However, NEO still needs to break through the immediate resistance zone and hold above the 100-day EMA to confirm this potential trend reversal.
Sonik Coin: Lighting Up the Crypto Market with Staking Rewards
Sonik Coin, the latest addition to the constantly expanding roster of meme coins, is set to make its debut on the Uniswap decentralized exchange on September 7 at 9 a.m. UTC. At the same time, participants in the presale will be able to claim their tokens.
The project raised $1.75 million within two weeks, with less than $300,000 remaining for purchase before its official listing. The token is currently priced at $0.000014.
The presale, which will run until the Uniswap listing, has a hard cap target of $2,098,547. As of writing, potential buyers are informed that they have a limited time left to decide, with only 1 day and 10 hours remaining.
In order to enhance security for investors, the project team has not only undertaken a comprehensive smart contract audit but also committed to locking in liquidity.
To acquire $SONIK, buyers can connect their Web3 wallet to the project’s official website. From there, they can use either $ETH or $USDT to complete the purchase via the Ethereum network.
Despite not being officially listed yet, 49.5 billion tokens out of a total supply of 299,792,458,000 have already been staked, earning an annual percentage yield (APY) of 48%.
Meme coins like Sonik Coin continue to occupy a highly traded niche in the crypto market.
Sonik Coin plans to offer staking rewards, allowing token holders to generate passive income.
Notably, the token supply of 299,792,458,000 is the speed of light in meters per second, a humorous touch by the team.
Crypto influencers and financial sites have already begun discussing Sonik Coin. Crypto YouTube channels like CryptoCoins (353,000 subscribers) and CryptoGains (107,000 subscribers) have given airtime to the new meme coin.
Additionally, high-profile crypto news websites including Finbold and CryptoPotato have covered the project.
On social media, Sonik Coin’s Twitter following has recently grown to over 2,290, and its Telegram channel has over 3,400 members.
Polygon (MATIC): A Potential Bullish Reversal Amid Resistance Levels

Despite Polygon (MATIC) seeing green for the third consecutive day, the cryptocurrency faces a challenging task ahead.
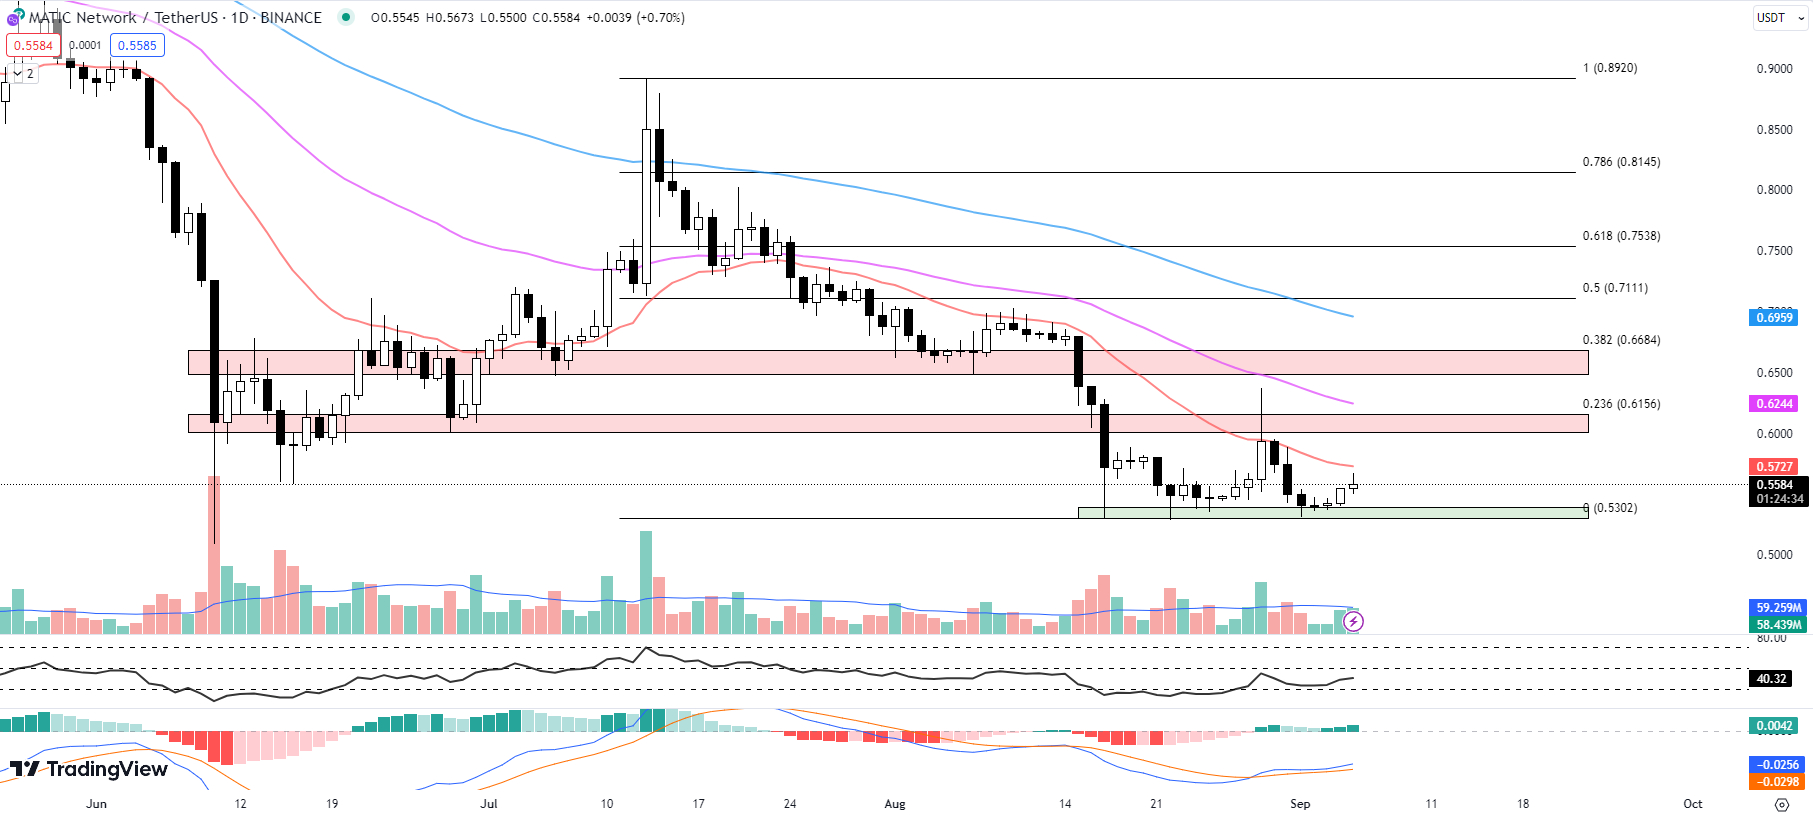
With its current price trading at $0.5584 and an increase of 0.70% so far today, MATIC is approaching the dynamic resistance of its 20-day EMA at $0.5727.
From a technical analysis standpoint, the 20-day EMA holds significance as MATIC seeks to recover from recent lows.
A successful breach of this level could act as a bullish signal, indicating a potential upward trend. Conversely, if the price remains unable to surpass this resistance, it could suggest a sustained bearish sentiment.
In addition to the 20-day EMA, two other EMA values provide valuable insight. The 50-day EMA at $0.6244 and the 100-day EMA at $0.6959 suggest that MATIC is in a downtrend in both the medium and long term.
These higher EMA values, above the current price, reinforce the idea that there are significant challenges ahead for this cryptocurrency.
The RSI, currently at 40.32, is another significant indicator. Typically, an RSI below 30 suggests oversold conditions, while an RSI over 70 indicates overbought conditions.
At its current level, MATIC’s RSI suggests that the coin is neither oversold nor overbought, but is leaning towards the oversold territory. This could indicate a potential price appreciation if the RSI moves upwards and crosses the 50 level.
MATIC’s MACD histogram is currently at 0.0042. A positive MACD histogram typically indicates bullish momentum. However, its value is relatively low, indicating that the bullish momentum is not particularly strong.
Looking at the resistance levels, the immediate resistance is the 20-day EMA of $0.5727.
This is followed by a more significant resistance zone between $0.60 to $0.6154, which aligns with the Fib 0.236 level of $0.6156. Breaking these resistance levels could signal a potential bullish reversal.
On the flip side, should the price begin to decline, the immediate support levels to watch are the swing low values between $0.5302 to $0.5394. These levels could potentially halt a price drop and provide a platform for a rebound.
Despite the recent green days, MATIC faces a crucial test as it approaches its 20-day EMA resistance. Traders should closely monitor these technical indicators and price levels in the immediate future, as they could dictate the trend direction for Polygon’s MATIC.
Disclaimer: Crypto is a high-risk asset class. This article is provided for informational purposes and does not constitute investment advice. You could lose all of your capital.


