


Best Crypto to Buy Now September 1 – Maker, Toncoin, Tron


U.S. employers added more jobs than expected last month, according to the monthly employment report released Friday by the Labor Department.
The report showed nonfarm payrolls rose by 187,000 in August, exceeding economists’ consensus estimate of 170,000. The unemployment rate held steady at 3.7%.
Considering the current job market dynamics, what are the best cryptos to buy now?
The stronger-than-forecast jobs growth could impact the Federal Reserve’s upcoming decision on interest rates at its September 20-21 policy meeting.
Tighter labor market conditions may add pressure on the Fed to continue raising rates aggressively to combat high inflation.
In reaction to the hotter jobs data, Bitcoin’s price has dipped below the $26,000 support. The leading cryptocurrency is currently trading at $25,758 with a decrease of 0.69% so far today.
The Fed is monitoring employment and inflation closely as it seeks to fulfill its dual mandate.
While strong job growth is normally welcome news, some economists argue the central bank needs to see a clear slowdown before it can ease up on rate hikes.
For now, the stronger August jobs numbers will keep the pressure on the Fed to continue its tightening path to restrain inflation running near 40-year highs.
The next rate decision will come at the September 20-21 Federal Open Market Committee meeting.
Given the present economic situation, Maker, Wall Street Memes, Toncoin, Launchpad XYZ, and Tron are some of the best cryptos to buy now thanks to their strong fundamentals and/or optimistic technical analysis.
Maker (MKR): Key Indicators Signal Potential Bullish Continuation
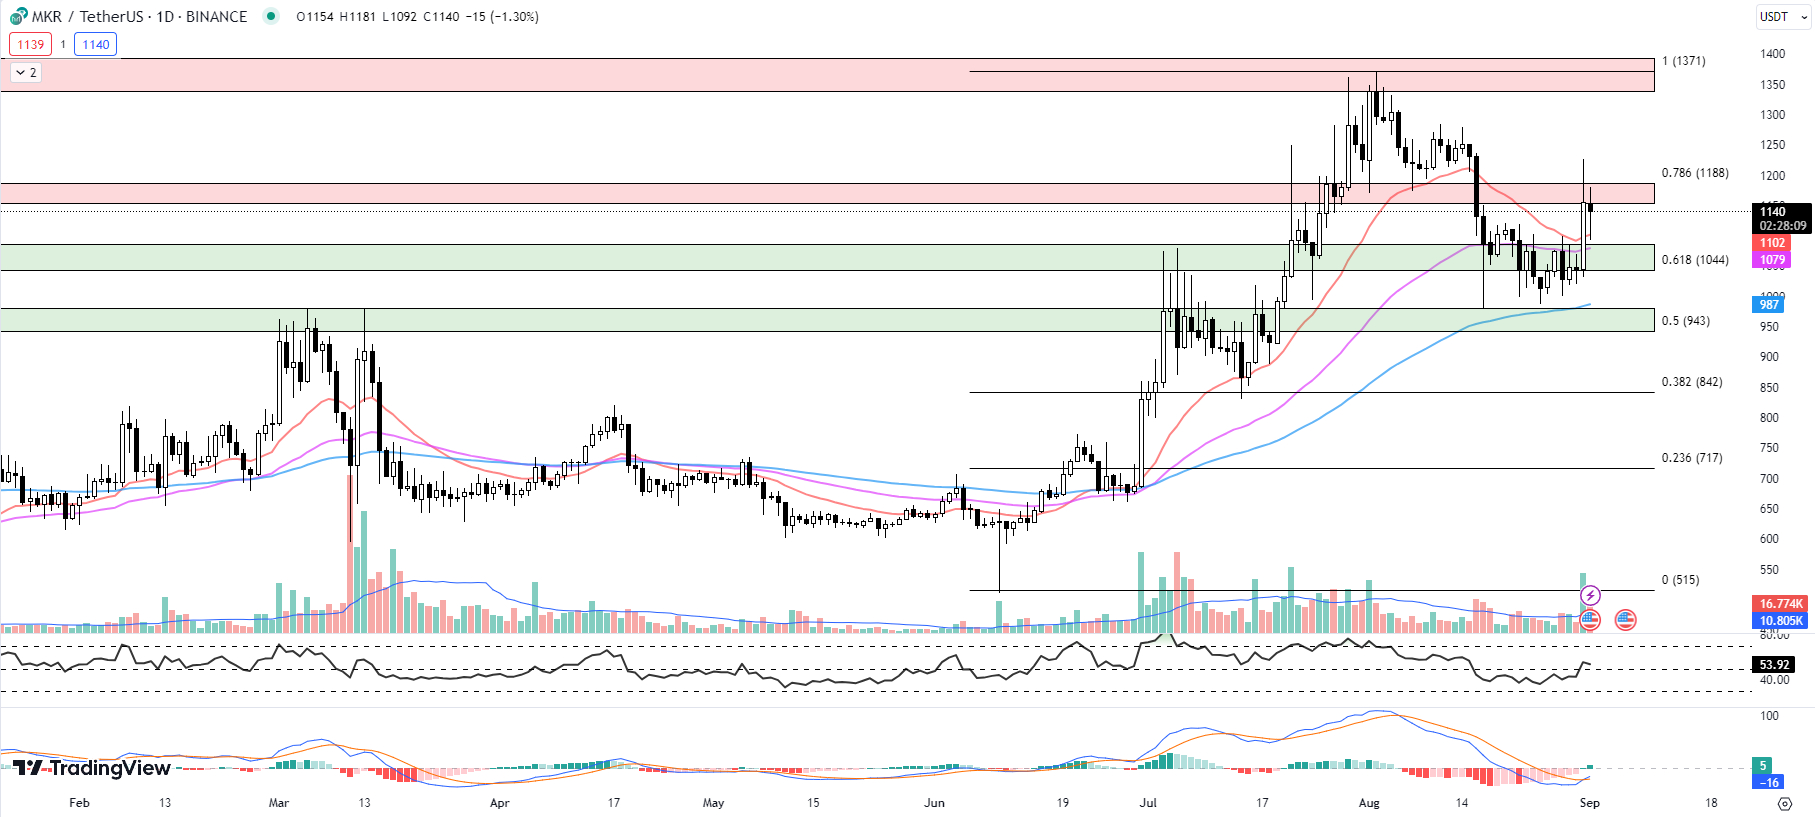
Maker (MKR) continues to navigate a challenging resistance zone between $1,153 and $1,187, punctuated by the Fib 0.786 level at $1,188.
Despite a slight dip of 1.30% so far today, MKR is showing signs of a potential uptick in the near term, according to key technical indicators.
The MACD histogram has recently demonstrated a bullish crossover. It has shifted from 0 to 5, which could be interpreted as growing bullish momentum.
This bullish signal, coupled with today’s trading candle casting a long bottom wick, suggests the presence of buyers in the market, even as MKR trades in the red.
Meanwhile, the RSI has slightly decreased from yesterday’s 55.71 to 53.92. While the slight drop suggests a marginal decline in buying pressure, the RSI still resides in neutral territory, providing no clear signs of overbought or oversold conditions.
MKR’s 20-day EMA is currently at $1,102, which has risen above the 50-day EMA at $1,079, and both are comfortably above the 100-day EMA at $987.
This could be seen as a bullish sign, as shorter-term averages outpacing longer-term ones often signal upward momentum.
The immediate support for MKR rests at the 20-day EMA of $1,102. Should the price fall below this point, the next level of support resides in a horizontal zone between $1,044 and $1,086, backed by the 50-day EMA of $1,079.
In terms of volume and market capitalization, the asset’s market cap has seen a slight increase of 0.70% to $1.1 billion.
However, the 24-hour trading volume has decreased by 22.18% to $104.2 million. This reduction in volume could indicate a slowing of selling pressure, adding to the potential bullish scenario.
While Maker (MKR) struggles against a significant resistance zone, the technical indicators signal bullish potential.
Investors should closely monitor these indicators and price action around key resistance and support levels in the immediate future.
WSM Presale Closes Soon: Is It the Best Crypto to Buy?
Since its launch on May 26, 2023, the Wall Street Memes (WSM) presale has attracted significant interest, raising over $25 million. The project is set to wrap up by the end of September.
While the crypto space is crowded, the rise of meme coins like Pepe earlier this year and Dogecoin in 2021 suggests that these tokens often outperform other types of crypto assets.
WSM has piqued the interest of many by offering a dual opportunity. First, it provides a chance to invest in the WSM coin before it gets listed on exchanges later this year.
Second, it offers potential rewards through a staking system. These features make WSM a subject of conversation among those looking for the best crypto to buy.
Wall Street Memes taps into the r/WallStreetBets subreddit that gained traction after the GameStop events of 2021. Once the token is live, 100% of its 2 billion supply will be available for community trading.
Allocation is set at 50% for presale buyers, 30% for community rewards, and the remaining 20% for liquidity.
In addition to its crypto offering, WSM has built a strong online presence. It has more than one million followers across social media platforms, thanks to its engaging content on crypto and stock investments.
Unlike other meme coins that appear without much backing, WSM has a broad following due to its popular NFT collections.
So, while the best crypto to buy is often a subjective choice based on various factors, WSM offers a unique blend of community engagement and investment rewards. With the presale ending this month, those interested will need to act soon.
Toncoin (TON): A Bullish Breakout on the Horizon?
Toncoin (TON) has shown extraordinary performance this past week, gaining 35.38% despite the broader cryptocurrency market’s struggle to remain at higher levels.
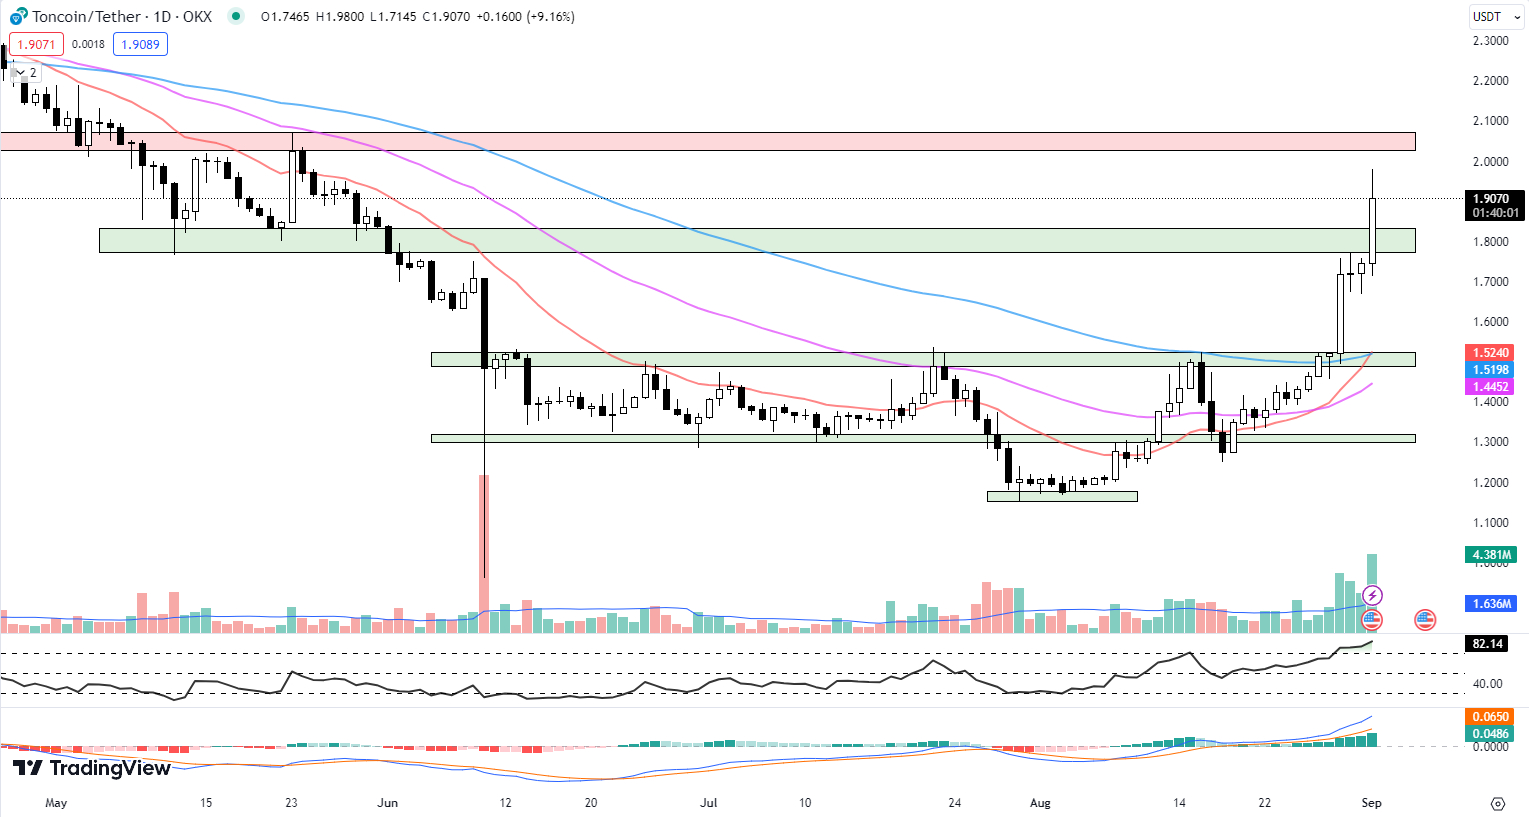
Today, TON is trading at $1.9070, a notable 9.16% increase so far today, as it tries to break out of a significant resistance area of $1.7742 to $1.8334.
TON’s 20-day EMA currently stands at $1.5240, slightly above the 50-day EMA at $1.5198 and the 100-day EMA at $1.4452. These EMAs, all of which are below the current TON price, indicate a bullish trend.
The fact that the shorter-term 20-day EMA is above the long-term 100-day EMA suggests that the uptrend is gaining momentum.
The RSI is currently at a very high level of 82.14. Typically, an RSI above 70 indicates that a cryptocurrency is overbought, suggesting that a corrective pullback might be due.
However, in strong uptrends, cryptocurrencies can remain overbought for extended periods. Thus, while the high RSI signals a potential pullback, it does not rule out further gains.
The MACD histogram, is positive as well, with a histogram reading of 0.0486. This is a bullish signal, indicating that the short-term momentum is stronger than the long-term momentum.
Additionally, Toncoin’s market cap and volume are displaying positive trends. The market cap has increased by 9.74% to $6.5 billion, and the 24-hour trading volume is up 65.17% to $48.7 million, suggesting a strong buying interest in TON.
Turning our eyes to the price levels, Toncoin is nearing a significant horizontal resistance zone of $2.0267 to $2.0735.
If TON can break through this resistance, it could potentially trigger a new wave of buying pressure, driving the price even higher.
The immediate support lies between $1.7742 and $1.8334, a range TON is currently trying to break out from.
The technical indicators suggest that Toncoin is in a strong bullish trend. Traders should watch the $2.0267 to $2.0735 resistance zone carefully.
A successful breakout above this level could signal further upside. However, given the overbought RSI, traders should also be prepared for possible short-term pullbacks.
Launchpad XYZ: Fueling the Future of Crypto Trading with AI-Powered Tools
Launchpad xyz, a future player in the cryptocurrency trading sector, recently met its presale fundraising goal of $1.5 million.
The platform plans to offer a range of artificial intelligence-powered tools to help traders make informed choices.
One of the anticipated tools on the platform is called Launchpad Quotient. This tool will use AI to sort through 400 data points on various cryptocurrencies.
The purpose is to help traders find promising opportunities in the crypto market.
Another tool that traders can expect is the TradingEdge. TradingEdge will offer insights based on sentiment analysis and current news. It’s another layer of information that can help traders make more accurate decisions.
Additionally, the platform plans to share trade setups from those with experience in the field. Early adopters who buy $LPX tokens will receive special perks on the platform in the form of NFT-based premium access passes.
After reaching its presale goal, Launchpad XYZ announced a bonus offer of 19% for those who hold its tokens. The offer is set to expire in 4 days.
To enhance community engagement, the platform has also provided temporary free access to its alpha calls group on Telegram.
This group has been a venue for sharing successful trade setups, and it is part of the platform’s steps toward its future objectives.
Tron (TRX): Price Contraction and Potential Breakout
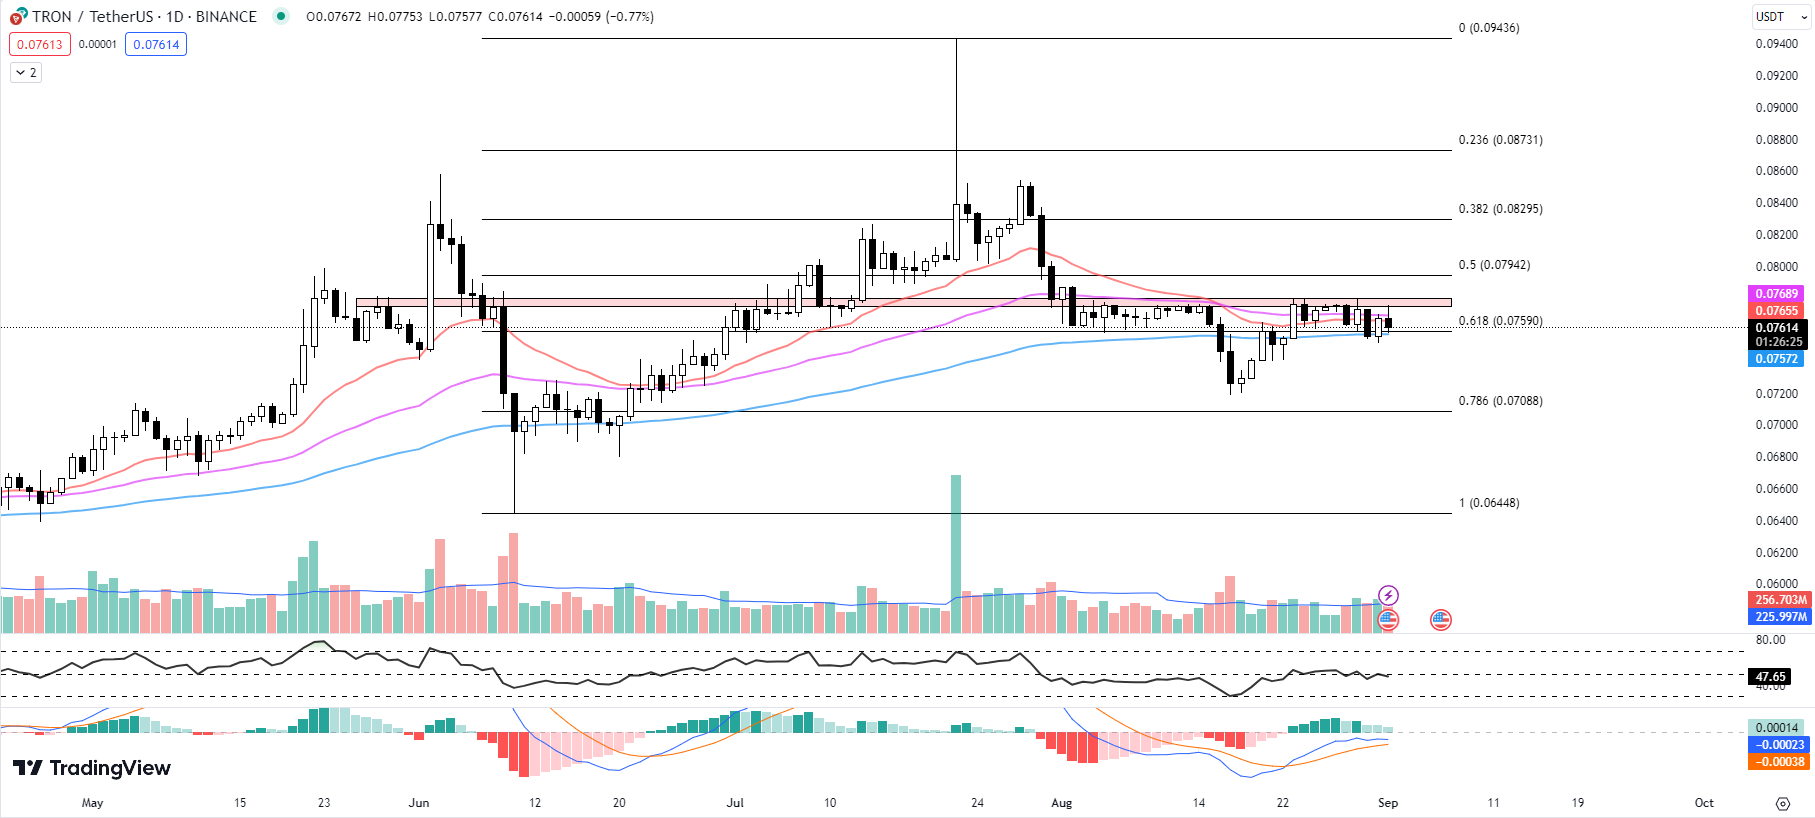
TRON (TRX) has been in a period of consolidation, trading sideways between a resistance zone of $0.07748 to $0.07797 and a Fib 0.618 support level of $0.07590.
This trend has persisted throughout the past month, and combined with the contracting Exponential Moving Averages (EMAs), it suggests a significant move may be imminent.
TRX is currently trading at $0.07614, representing a 0.77% decrease so far today.
The 20-day and 50-day EMAs, at $0.07655 and $0.07689 respectively, are acting as immediate resistance for TRX.
The fact that these EMAs are above the current price indicates that the short-term trend is slightly bearish.
However, the 100-day EMA, which is considered a longer-term trend indicator, is currently at $0.07572, providing some support slightly below the current price level.
TRX’s RSI is currently at 47.65, down from yesterday’s 49.89. An RSI below 50 indicates that there is more selling pressure than buying pressure.
However, since the RSI is not yet oversold (below 30), it signals that there could be more room for the price to drop before a potential reversal.
The MACD histogram has decreased to 0.00014 from yesterday’s 0.00019. This reduction in the MACD histogram signifies a loss of bullish momentum. However, it’s still positive, indicating there is still some bullish sentiment.
The market capitalization of TRX has decreased by 0.86% to $6.8 billion, which aligns with the slightly bearish sentiment.
However, the 24-hour trading volume has increased by 5.54% to $190.6 million. An increase in volume may suggest a heightened interest in TRX and potentially precede a significant price move.
In terms of immediate levels to watch, resistance lies at the 20-day and 50-day EMAs of $0.07655 and $0.07689, followed by the horizontal resistance zone of $0.07748 to $0.07797.
Meanwhile, support is at the Fib 0.618 level of $0.07590, followed by the 100-day EMA of $0.07572.
Given these technical indicators, traders should keep a close eye on TRX’s price movements.
The contraction of EMAs and the increase in volume suggest an impending breakout. However, the direction of this move is currently unclear, with slightly bearish short-term indicators.
Traders should watch for a break above the resistance levels for a potential bullish reversal, or a break below the support level as a sign of a continued bearish trend.
Disclaimer: Crypto is a high-risk asset class. This article is provided for informational purposes and does not constitute investment advice. You could lose all of your capital.


