Best Crypto to Buy Now October 16 – Bitcoin SV, Render, Bitcoin Cash


Bitcoin prices briefly spiked on Monday morning after a false report circulated on social media that the U.S. Securities and Exchange Commission (SEC) had approved a spot bitcoin exchange-traded fund (ETF).
The unsubstantiated claim was posted on the Twitter account of Cointelegraph before being edited and deleted shortly after 10 a.m. ET. Given the unexpected rise in cryptocurrency market volatility today, what is the best crypto to buy now?
Bitcoin prices surged over $2,000 within 30 minutes after the fake tweet, rising from around $27,883 to over $30,000 across trading platforms.
The volatility resulted in over $100 million in liquidations across the crypto derivatives market within an hour, including $73 million in short positions and $32 million in long positions.
BlackRock confirmed that the SEC has not yet approved any such product. Additionally, sources close to the SEC verified that the Cointelegraph report was false.
The false tweet from the Cointelegraph account was later edited and ultimately deleted. The Bitcoin price subsequently retreated from its brief highs, trading at $28,500 as of writing.
Regardless of the cryptocurrency market volatility prompted by inaccurate information on a Bitcoin ETF approval, Bitcoin SV, Bitcoin Minetrix, Render, TG.Casino, and Bitcoin Cash continue to present a compelling case as the best crypto to buy now, thanks to their strong fundamentals and/or promising technical outlooks.
Bitcoin SV (BSV) Battles Immediate Resistance: Can It Break Through?
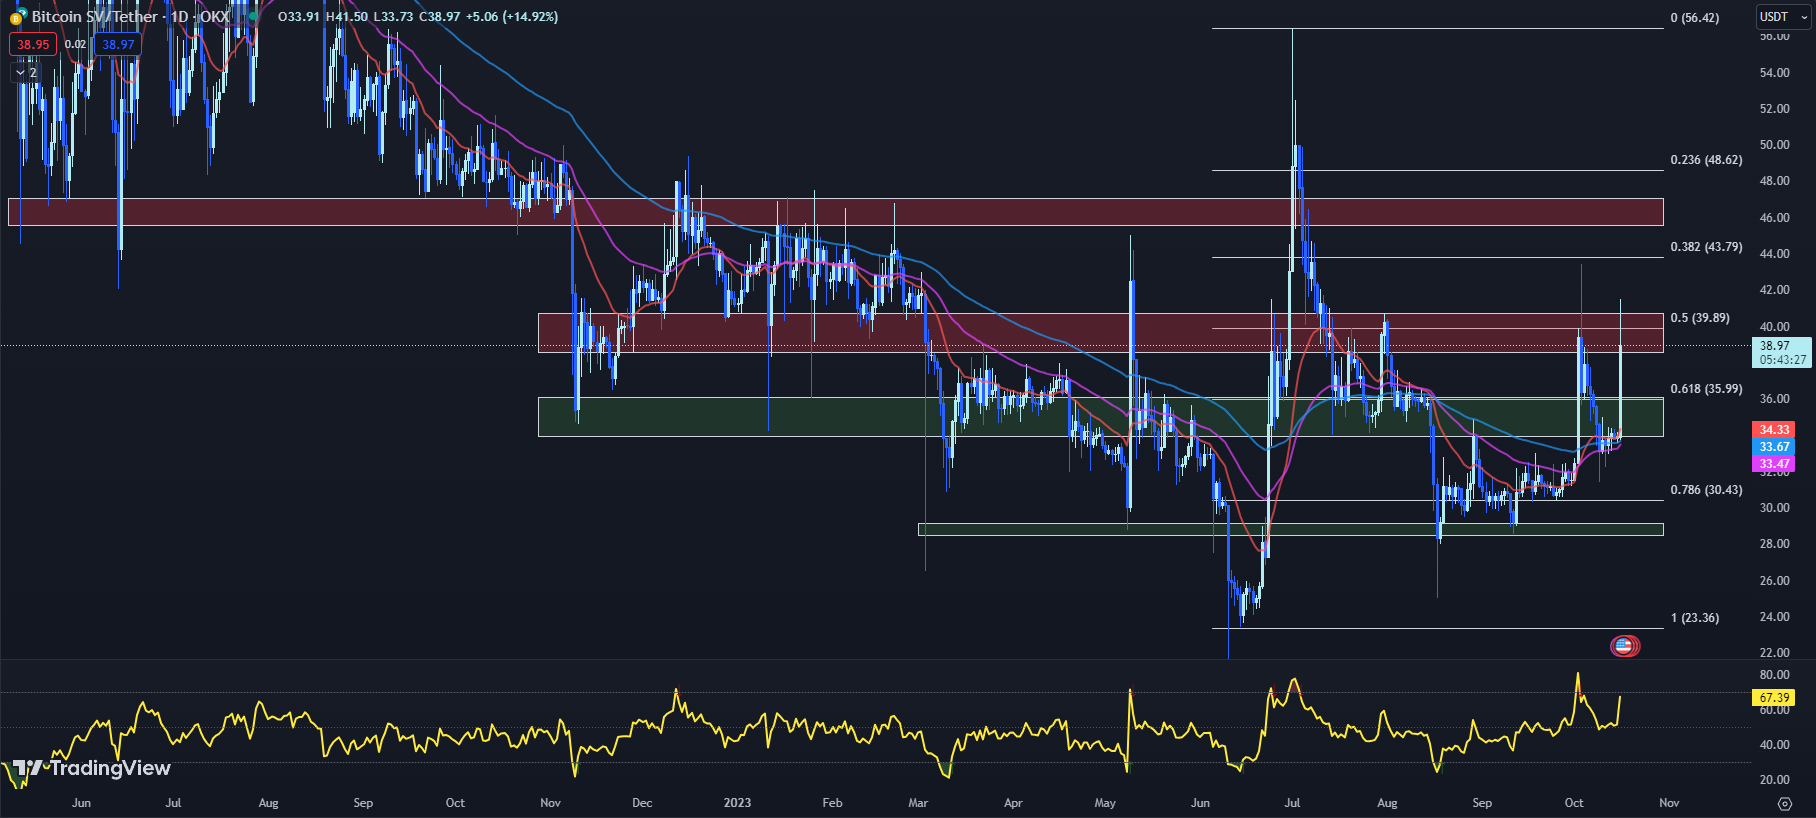
The October trajectory of Bitcoin SV (BSV) has been a tense tug-of-war between bulls and bears as the cryptocurrency retraced key EMA levels after meeting resistance at around the Fib 0.5 level of $39.89.
Today’s surge in market activity saw the BSV price again knocking at the door of its immediate resistance zone. However, the selling pressure maintains a formidable barrier. With the BSV price still trading considerably higher so far today, can the BSV price conquer this resistance level in the coming days?
The BSV price currently sits at $38.97, marking a robust 14.92% uptick so far today. The 20-day EMA for the BSV price currently stands at $34.33, modestly above the 50-day EMA of $33.47 and the 100-day EMA of $33.67.
When the shorter-term EMA crosses above the longer-term EMAs, it is typically seen as a bullish sign. However, the BSV price’s proximity to these EMAs implies a volatile market environment, and traders should exercise caution in interpreting these indicators.
The RSI for BSV is currently at 67.39, up from yesterday’s 51.54. This jump towards overbought territory (an RSI above 70) indicates a potential overheating in the market. However, the current level is not yet at the extreme, suggesting that the BSV price still has room for further growth before a cooling period is necessary.
The MACD histogram stands at 0.08, a significant increase from yesterday’s -0.23. This positive value indicates that the bullish momentum is gaining strength, which could further propel the BSV price.
A 15.20% jump in market cap to $748 million and an 802.00% spike in the 24-hour volume to $211.8 million signal increased investor interest in BSV. This newfound enthusiasm may provide additional support for the BSV price, but traders should be aware of the volatility that such rapid increases in volume and market cap can bring.
The BSV price currently faces a horizontal resistance zone between $38.60 and $40.71, which aligns with the Fib 0.5 level of $39.89. Breaching this resistance could signify a continued upward trend.
Conversely, an immediate support zone lies between $33.95 and $36.11, which intersects with the 20-day EMA of $34.33 and the Fib 0.618 level of $35.99. The BSV price would likely find some support in this region if a pullback occurs.
The BSV price trajectory remains uncertain, with technical indicators offering mixed signals. While the increased RSI and MACD suggest the potential for further growth, the proximity to key resistance levels could lead to a tug-of-war between bullish and bearish traders.
Investors should consider these technical indicators in conjunction with overall market trends and their personal risk tolerance before making a decision. A violation of the $33.95 support or a breakthrough past the $40.71 resistance could set the next trend for the BSV price.
Bitcoin Minetrix: Simplifying Bitcoin Cloud Mining for the Average Crypto Investor, Best Crypto to Buy Now?
Bitcoin Minetrix seeks to disrupt cloud mining with its tokenized, smart contract-based system. The platform removes typical requirements of expensive mining equipment and technical expertise.
Users can stake tokens to earn automated cloud mining rewards, making crypto passive income accessible to a broader cryptocurrency audience.
The presale for this one-of-a-kind Bitcoin cloud mining platform provides the chance for investors to acquire the platform’s native token, BTCMTX, at a discount before its official launch. The presale has successfully raised more than $1.59 million so far.
Bitcoin Minetrix utilizes a stake-to-mine system where users stake BTCMTX tokens to earn cloud mining credits without needing expensive mining equipment. Smart contracts control the mining operations and rewards.
According to crypto analyst Jacob Crypto Bury, Bitcoin Minetrix possesses significant growth potential at launch. He told his 22,800+ subscribers, “NEW 10X Potential Presale Bitcoin Minetrix MINES $BTC For YOU – Best Crypto to Buy Now?“
Other crypto experts are also optimistic about Bitcoin Minetrix. Michael Wrubel informed his 310,000 subscribers he is “bullish on BTCMTX,” and Austin Hilton called it a “hidden crypto gem.”
Conor Kenny, with 165,000 subscribers, says Bitcoin Minetrix’s simplicity makes it appealing. “NEW Altcoin Presale Bitcoin Minetrix MINES $BTC For YOU!!!” he titled a recent video.
The presale comes as Bitcoin attempts to find its footing to gain upside momentum. However, experts predict the upcoming Bitcoin halving in April 2023 will start a bull run, benefitting platforms like Bitcoin Minetrix.
To purchase BTCMTX, investors need ETH, USDT, BNB, or a credit card. Those using ETH can stake immediately to earn rewards of up to 370% APY.
With its robust security, expert endorsement, and stake-to-mine model, Bitcoin Minetrix intends to make cloud mining profitable and secure for the average investor, tapping into the surging demand for simplified crypto passive income.
RNDR Price Prediction: Momentum Building Towards $2 Level
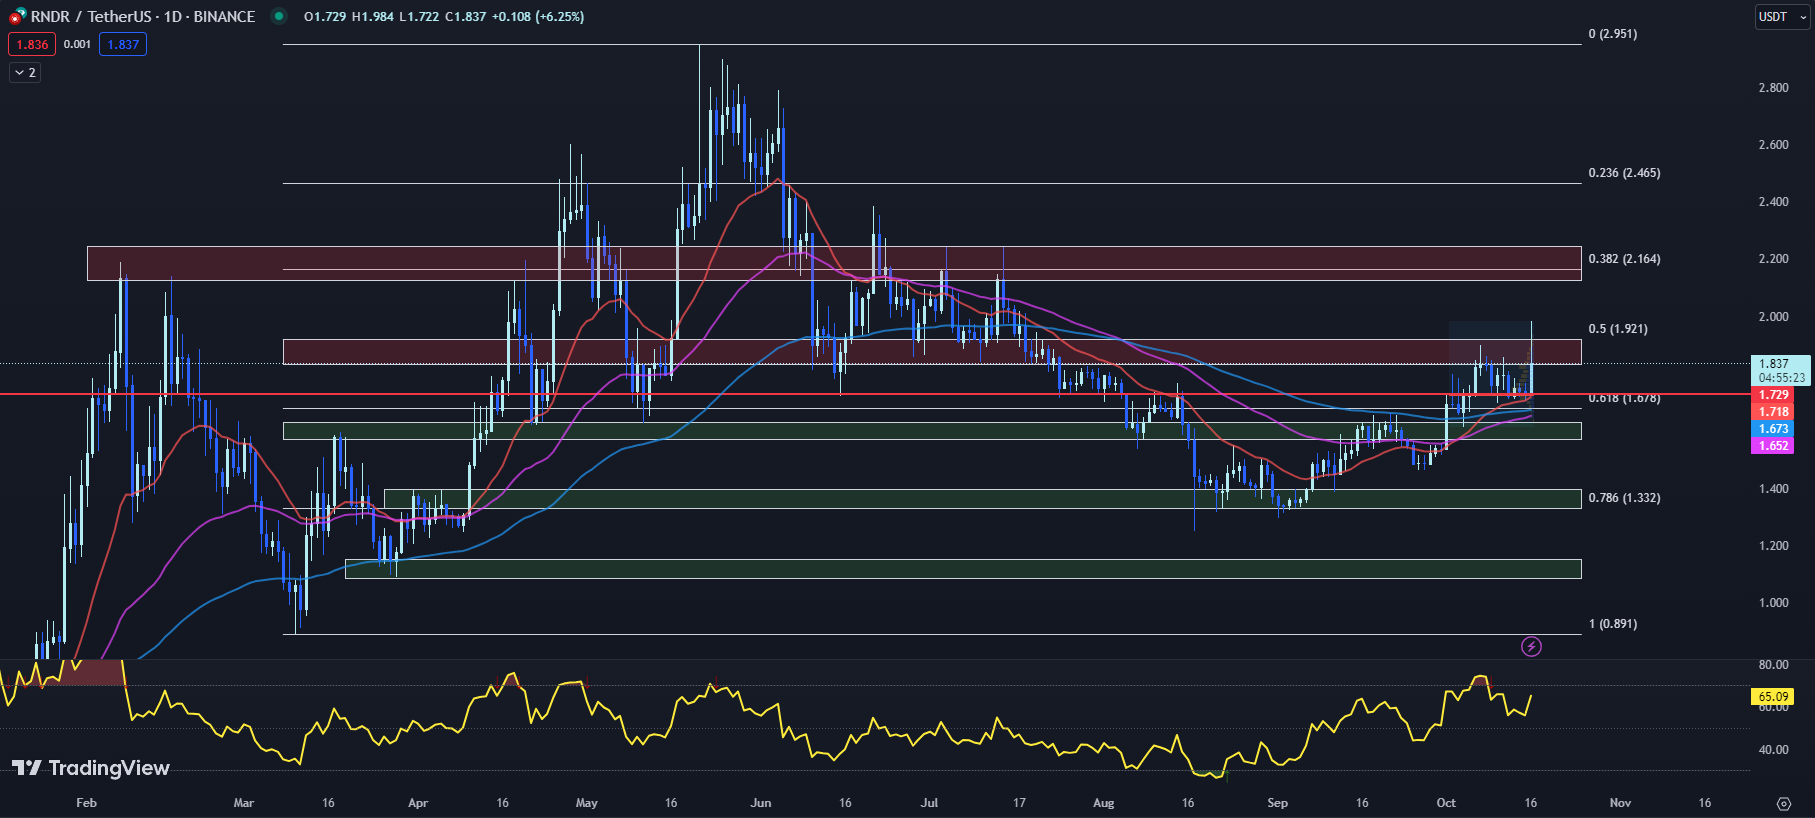
After two weeks of consolidation, Render (RNDR) has seen a bounce from its Point of Control (POC) at $1.729, a situation that has given the RNDR price an opportunity to attempt breaching the immediate resistance of the Fib 0.5 level at $1.921.
RNDR’s recent intraday high has reached $1.984, and the current trading price is $1.837, a 6.25% increase so far today. This momentum has prompted speculation about whether RNDR will regain the crucial $2 level in the upcoming days.
The 20-day EMA for the RNDR price presently stands at $1.718, above the 50-day EMA of $1.652, which is a generally bullish signal.
However, the RNDR price has to maintain momentum to confirm this positive outlook. The 100-day EMA at $1.573 also serves as a significant support level, strengthening the coin’s medium-term uptrend.
The RSI has jumped from yesterday’s 55.93 to a current 65.09. This is an indication of growing buying pressure and suggests that the RNDR price could continue its upward trajectory in the near term.
The MACD histogram is currently at -0.001, an improvement from yesterday’s -0.006. This narrowing negative value points to a potential bullish crossover, which again could be a positive sign for the RNDR price.
The sharp 6.91% increase in market cap to $684.3 million, along with the 360.01% surge in 24-hour trading volume to $75.4 million, depicts a surge in investor interest in RNDR. If this trend persists, we could see further upside in the RNDR price.
RNDR is currently challenging a horizontal resistance zone between $1.834 and $1.921, coinciding with the Fib 0.5 level of $1.921. A successful breakout from this zone, along with surpassing the psychological $2 barrier, might trigger a move toward the next resistance zone between $2.128 and $2.245, corresponding with the Fib 0.382 level of $2.164.
Conversely, the immediate support for RNDR lies at the range POC of $1.729, followed by the 20-day EMA of $1.718. These levels should be keenly watched as a break below them may denote a shift in market sentiment.
With the RNDR price showing signs of strength, technical indicators suggest a possible bullish trend ahead. The rising RSI and improving MACD value support a positive outlook. However, traders should keep a close eye on the $1.921 resistance level and the $2 psychological barrier.
A break above these levels could confirm the next bullish wave. Meanwhile, the support at the POC and 20-day EMA should hold to maintain the current uptrend. Traders are advised to have well-defined risk parameters while awaiting key technical confirmations.
TG.Casino’s $TGC Is the Best Crypto to Buy Now for Crypto Gaming
Telegram’s 700 million users can now access blockchain gambling through a new platform called TG.Casino.
Integrated directly into the popular messaging app, the crypto casino launched with the goal of bringing Web3 gaming to the masses.
According to data from Dune Analytics, crypto gambling sites hosted nearly 50,000 unique users in mid-September, a 10x increase since January.
However, complex wallet and exchange barriers often deter potential players. TG.Casino solves this by enabling Telegram users to seamlessly access crypto games without prior blockchain knowledge.
The project has gained significant traction, raising over $1.1 million in less than a month. Now, TG.Casino has implemented its Ethereum-based $TGC token, offering 25% cashback on losses when playing with $TGC.
Early $TGC investors will also benefit from staking rewards of up to 456.78% APY. TG.Casino allocates platform profits to stakers and implements a buyback-and-burn model, shown to be successful for crypto gaming tokens like Rollbit’s $RLB.
Crypto gambling represents only a fraction of the $263 billion global gambling market, indicating ample room for platforms like TG.Casino to grow. With 80% of gameplay happening on mobile, TG.Casino’s Telegram integration and mobile optimization give it an edge.
Influencers like YouTube analyst Cilinix predict a bright future for $TGC. Investors seem to agree – TG.Casino’s presale has quickly raised 20% of its $5 million goal as of writing.
With projections indicating rapid growth ahead, crypto gaming could soon become a multi-billion dollar market.
Should upstart TG.Casino reach the lofty $700 million market cap held by sector leader Rollbit, experts say $TGC could deliver significant returns for early backers. For those seeking crypto projects with room to run, $TGC may hold potential.
Bitcoin Cash (BCH) Surges 8.41%: A Promising Uptick in Trading Activity
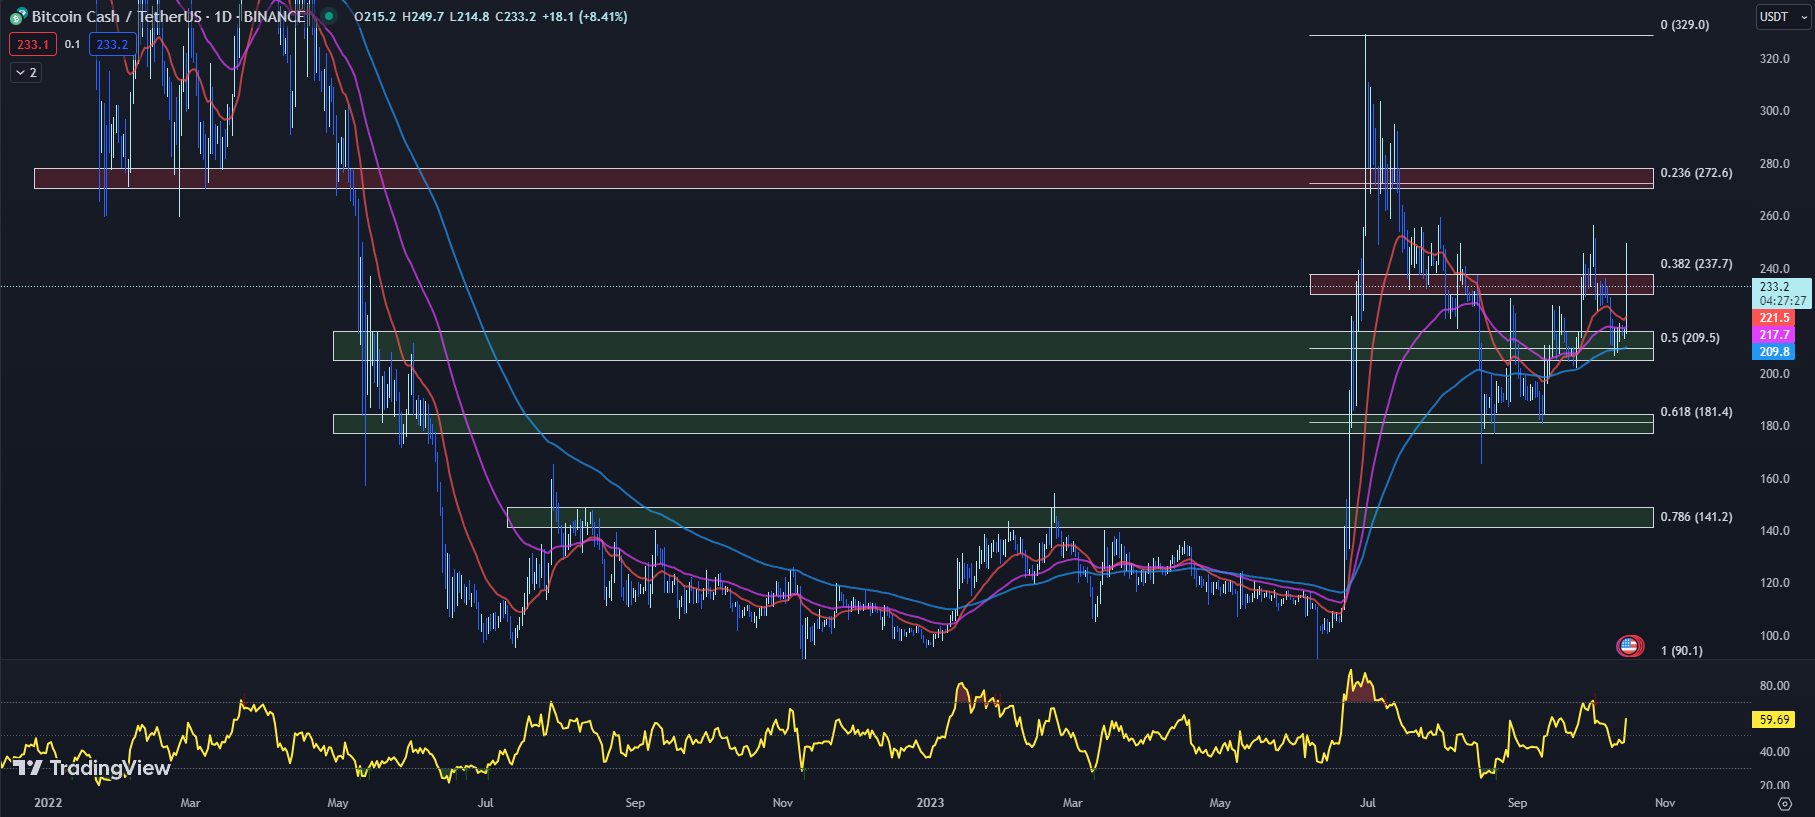
Fueled by an uptick in trading activity, Bitcoin Cash (BCH) has surged to retest its immediate resistance level. This bullish momentum has transpired after a period of consolidation above the 100-day EMA and the Fib 0.5 level of support at $209.5 for the past week.
The latest BCH price movement, which has seen an increase of 8.41%, is indicative of heightened investor interest and potentially a shift in market sentiment.
Analyzing the BCH price through the lens of key technical indicators provides nuanced insights. The 20-day EMA currently stands at $221.5, slightly above the 50-day EMA at $217.7, and well above the 100-day EMA at $209.8. This alignment of the EMAs, especially with the 100-day EMA serving as support last week, signals a bullish position for the BCH price.
The RSI for BCH has increased to 59.69 from yesterday’s 45.75. This indicates growing buying pressure and, although not in the overbought territory (an RSI above 70), this upward trend in the RSI suggests a continuation of bullish sentiment.
The MACD histogram reveals a value of -1.3, improving from yesterday’s -2.6. This narrowing negative value signifies a potential shift towards bullish sentiment, although investors should remain cautious until a definitive bullish crossover occurs.
The BCH price currently faces immediate resistance in the horizontal zone between $230 and $237.8, aligning with the Fib 0.382 level at $237.7. Today’s trading activity has seen BCH price attempting to overcome this resistance.
If BCH can successfully mount this level, the next significant resistance to watch is between $270.6 to $278, in confluence with the Fib 0.236 level at $272.6.
On the flip side, immediate support is found in the horizontal zone between $205 and $215.8, which also aligns with the Fib 0.5 level at $209.5.
This support level served as a solid foundation for BCH’s price during the past week’s consolidation, and it is expected to provide substantial support should BCH’s price face a downward correction.
The current BCH price movement and the alignment of technical indicators suggest a bullish momentum. However, investors should maintain a vigilant stance especially with the BCH price currently testing a significant resistance level.
A successful breach of this resistance could stimulate further bullish activity, while failure could see the BCH price retracing to its immediate support level. Traders are advised to set appropriate stop losses and risk management strategies in such volatile market conditions.
Disclaimer: Crypto is a high-risk asset class. This article is provided for informational purposes and does not constitute investment advice. You could lose all of your capital.