Best Crypto to Buy Now August 30 – EOS, THORChain, Fantom


The U.S. Securities and Exchange Commission (SEC) is set to make initial rulings this week on several proposed Bitcoin exchange-traded funds (ETFs).
The regulatory body is set to either sanction, reject, or postpone verdicts on Bitcoin ETF submissions by leading financial firms such as BlackRock, Fidelity, and Bitwise.
With the anticipated macroeconomic development on the horizon, what are the best cryptos to buy now?
According to federal regulations, the SEC has 240 days to approve or reject proposed ETFs after they are published in the federal register.
The agency faces key 45, 90, and 60-day deadlines to submit filings on each ETF before the 240-day deadline.
A spot bitcoin ETF proposed by BlackRock, which manages over $9 trillion in assets, was published in the federal register on July 19.
This means the SEC must submit an initial filing by September 2, 45 days from the publication date.
Proposals by Fidelity, VanEck, Invesco, and WisdomTree face the same September 2 deadline.
Bitwise’s spot Bitcoin ETF hit the register on July 18, giving the SEC a September 1st deadline for an initial filing. Meanwhile, Valkyrie’s proposed Bitcoin ETF has a September 4th deadline.
While several firms await rulings, the SEC recently delayed a decision on an ETF proposed by Ark Invest and 21Shares.
The SEC said it needed more time and would open the proposal to public comments before deciding during the 240-day window. That sets a final deadline of January 10th for approval or rejection.
Industry observers say SEC approval of a spot Bitcoin ETF, if it comes, will likely happen in late 2023 or early 2024 despite impending initial deadlines.
Bitwise CEO Matt Hougan predicts approval in Q4 2023 or Q1 2024. The agency has previously rejected over a dozen Bitcoin ETF applications.
As Bitcoin ETF filings continue to linger before the SEC, market analysts recommend diversifying into promising altcoins, such as EOS, Sonik Coin, THORChain, yPredict, and Fantom.
These altcoins are some of the best cryptos to buy now due to their robust fundamentals and/or positive technical analyses.
EOS: Challenging Resistance Levels, Will Bulls Prevail?
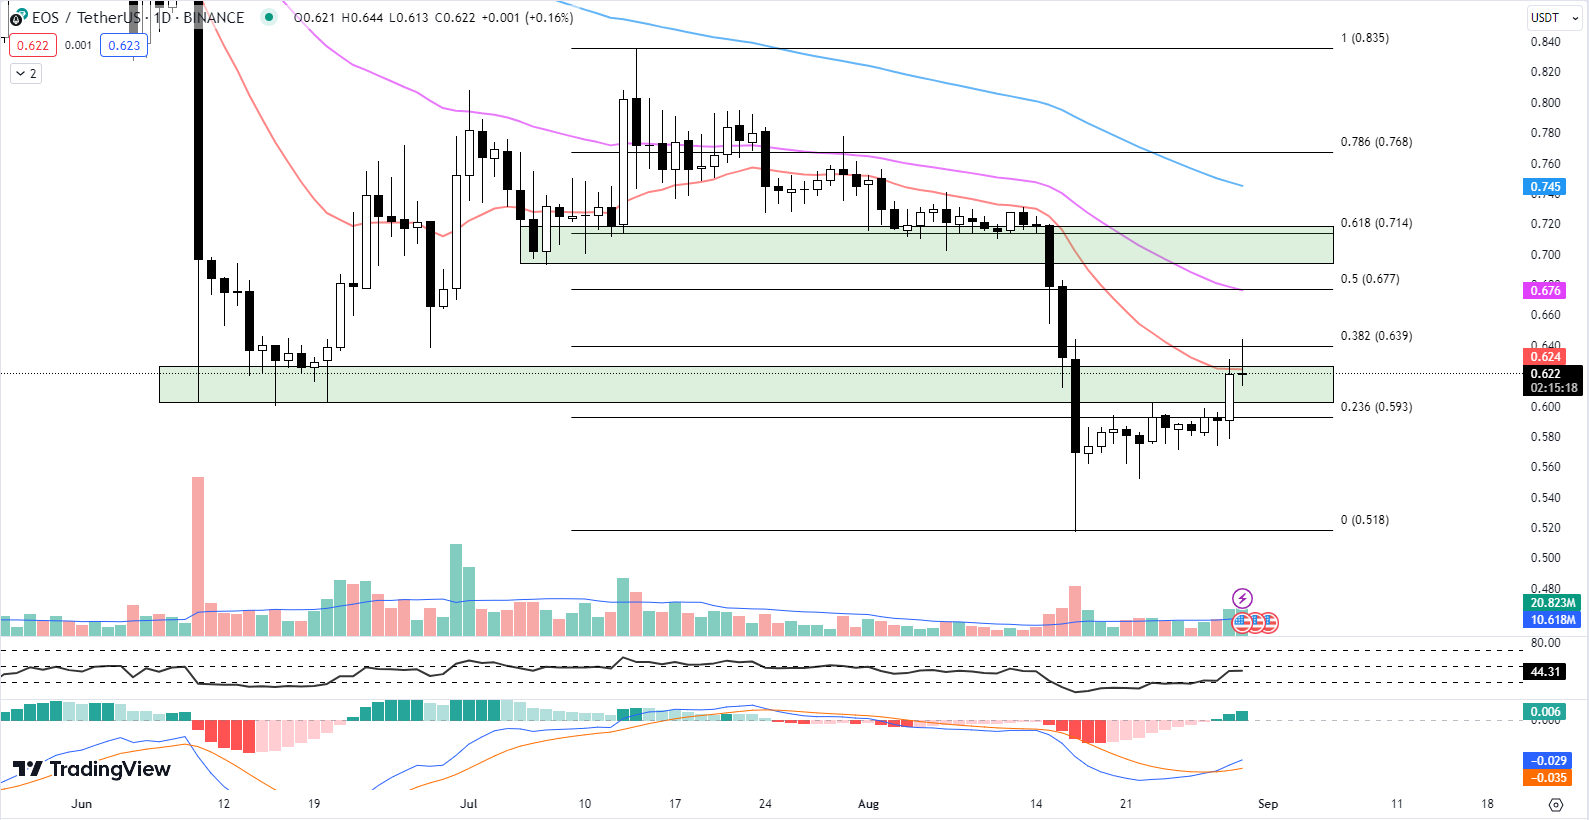
EOS initiated the trading day with a dominant bullish stance, as it retested the Fib 0.382 level at $0.593, reaching an intraday high of $0.644.
However, the cryptocurrency’s momentum was inadequate to overcome multiple resistance levels of the Fib 0.382 level at $0.639, the 20-day EMA of $0.634, and the horizontal resistance zone that spans from $0.603 to $0.626.
EOS is currently trading at $0.622, showing a nominal gain of 0.16% for the day. The 20-day EMA stands at $0.634, the 50-day EMA at $0.676, and the 100-day EMA at $0.745.
The current price of EOS is below all three EMA levels, indicating a prevailing bearish trend.
Yet, there are signs that this trend could soon change. The RSI has slightly increased from yesterday’s 43.92 to today’s 44.31. Though still below the neutral 50 mark, this uptick suggests a lessening in selling pressure.
The MACD histogram shows a newly formed bullish crossover, moving from 0.004 to 0.006. MACD crossovers are often seen as bullish signals, indicating potential buying opportunities.
EOS’s market capitalization has increased marginally by 0.28% to $686.4 million, indicating a small inflow of capital.
In contrast, the 24-hour trading volume has made a significant leap, up by 15.90% to $133.6 million. This uptick in trading volume could be a precursor to increased price volatility.
For EOS, the immediate resistance lies in the horizontal zone of $0.603 to $0.626, which intersects with the 20-day EMA of $0.634. Overcoming this resistance zone will be crucial for EOS to sustain any upward price movement.
On the flip side, EOS finds its immediate support at the Fib 0.236 level at $0.593. Should the price descend, this level will function as a safety net, preventing further declines.
While EOS’s current position below key EMAs signals a bearish trend, the slight uptick in RSI and the bullish MACD crossover suggest a potential reversal.
Traders should keep a close eye on these indicators and the volume, as an increase could signal a strong price movement.
If EOS manages to break past the immediate resistance and maintain its position above the 20-day EMA, it could pave the way for a bullish run. However, should it fail, the Fib 0.236 level at $0.593 is expected to provide immediate support.
Sonik Coin: Power Up Your Portfolio with One of the Best Cryptos to Buy Now
Riding high after Grayscale’s legal victory over the SEC, a new meme coin called Sonik Coin has raised over $780,000 in presale investments.
Inspired by Sonic the Hedgehog, Sonik offers a playful alternative to mainstream cryptocurrencies while providing staking yields up to 88% APY.
With the presale nearing its end, Sonik is gaining traction in the hot meme coin space.
What sets Sonik Coin apart from its meme coin counterparts is its stake-to-earn utility feature, which offers token holders the chance to earn passive income.
To date, a significant 27.3 billion tokens have been staked by contributors in the presale, yielding an impressive annual return of 88%.
Sonik Coin’s presale intends to distribute 50% of its vast total token supply, which stands at 299,792,458,000. The objective here is to generate approximately $2.1 million.
The total supply figure cleverly references the speed of light in meters per second, signifying the coin’s rapid journey towards its ambitious market cap goal of $100 million.
Contributors to the presale have the opportunity to begin earning immediately by buying and staking, with the yield shown in real-time on Sonik Coin’s staking dashboard.
The tokens will be claimable after the presale ends and the coin is listed, but a lock period of seven days applies.
Sonik Coin’s staking program is set to dispense rewards over four years. It stands out in the meme coin industry by dedicating 40% of its supply to reward token holders who stake, thus offering a built-in income-generation mechanism.
Sonik Coin has been featured by prominent crypto news sites such as Finbold, CryptoPotato, and Captain Altcoin as interest in the meme coin builds.
Sonik has also witnessed impressive growth of its social media community in conjunction with its presale, which continues to pick up steam after early success.
RUNE’s Price Consolidation: Monitoring Indicators for Potential Reversal
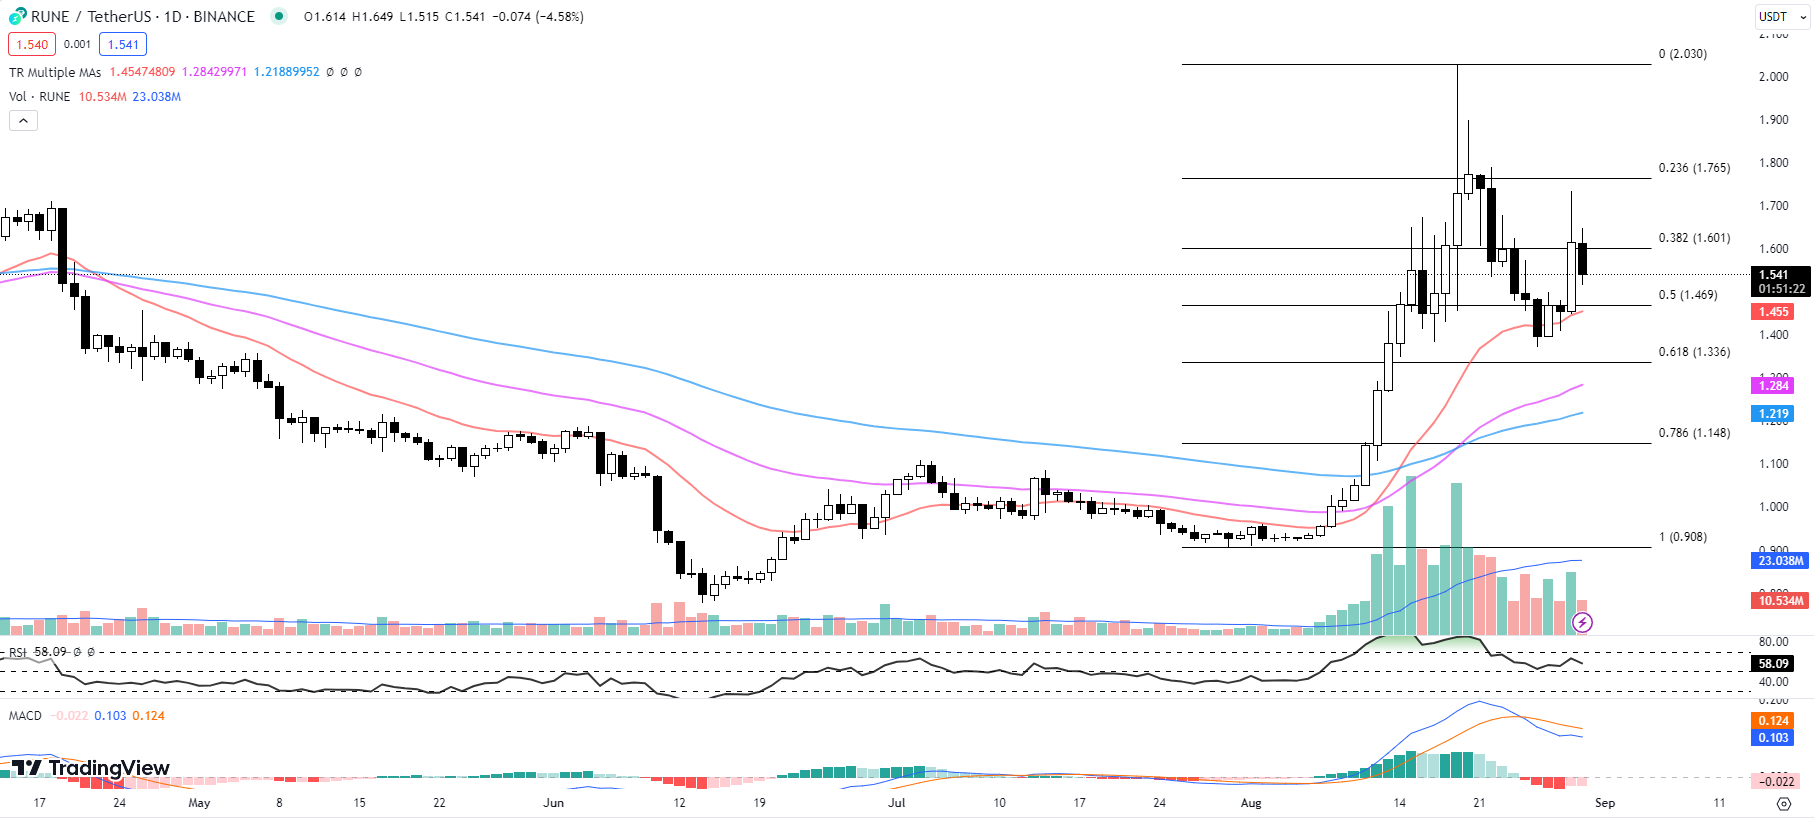
After showing promise with an 11% rally yesterday, THORChain’s embattled token RUNE has fallen back into its downtrend.
Today’s decline below the key Fib 0.382 level underscores RUNE’s technical weakness and overhanging downside risks. The path of least resistance appears lower until SUPPORT can be reclaimed.
RUNE’s 20-day EMA currently stands at $1.455, while the 50-day EMA and 100-day EMA are recorded at $1.284 and $1.219 respectively.
These figures, particularly the relatively high 20-day EMA, suggest a modestly bullish sentiment over the short term.
Meanwhile, the RSI has slightly decreased from yesterday’s 63.14 to 58.09. While this decrease is not drastic, it indicates a slight easing of buying pressure and could signal a short-term consolidation or even a reversal.
However, an RSI value of 58.09 still denotes a prevailing buying interest, which could support the asset’s price in the near term.
Turning to the MACD histogram, there has been no change from yesterday’s -0.022. A negative MACD value can often be a bearish sign, but the unchanged status may suggest that the market is still deciding on its next move.
As of writing, the current price of RUNE stands at $1.541, a drop of 4.58% so far today. This downward movement underlines the current bearish sentiment.
For traders looking to enter or exit positions, be aware of the immediate resistance and support levels.
The immediate resistance for RUNE is the Fib 0.382 level at $1.601, which RUNE has recently failed to overcome. This level will need to be breached if there is to be a renewed bullish move.
On the downside, RUNE finds immediate support at the Fib 0.5 level at $1.469. This is closely followed by the trailing dynamic support of the 20-day EMA at $1.455.
These support levels are critical, as breaking below them could potentially trigger a more significant sell-off.
RUNE is currently in a phase of consolidation with a slight bearish outlook. Traders should keep a close eye on the mentioned support and resistance levels, as well as the RSI and MACD indicators, to gauge the potential for a turnaround in sentiment.
Data-Driven Crypto Success: yPredict Is One of the Best Cryptos to Buy Now
Can age-old statistics be taught new tricks through AI? That’s the premise behind yPredict, a crypto project that raised over $3.66 million so far in its $YPRED token presale.
yPredict seeks to enhance traditional financial forecasting models like ARIMA using modern deep learning for more insightful trading predictions.
yPredict will leverage ARIMA, a model hailing from the 1970s that scrutinizes past patterns to inform future predictions, alongside LSTM and SVM, modern AI models that draw from historical price data to map out potential future price trajectories.
By intertwining traditional statistical analysis and modern AI, yPredict will craft a sturdy and comprehensive approach to crypto price prediction. These models, each with their own strengths, will come together to bolster yPredict’s forecasting capabilities.
Beyond its sophisticated prediction tools, yPredict has an ambitious goal: to level the playing field in predictive analytics.
Its subscription-based Prediction Marketplace is designed to empower financial data scientists to earn from their models while providing traders with a selection of algorithms that align with their trading strategies and assets.
This Marketplace intends to shatter conventional norms in quantitative analysis by transferring power from exclusive hedge funds to everyday traders.
This symbiotic relationship, facilitated by yPredict, strives to disseminate data-driven insights throughout the trading ecosystem.
In addition to the Marketplace, yPredict is developing a suite of complementary platforms.
These include yPredict Analytics for market dynamics analysis, yPredict Terminal for efficient trade execution, and yPredict Repository as a storehouse for historical market data.
As AI solidifies its role in financial systems, yPredict’s presale comes at a time ripe with possibilities.
Anticipations are high for Q3 2023, when $YPRED is expected to make its debut on exchanges, alongside the beta launch of yPredict Repository and Marketplace.
By the end of 2023, beta versions of the Marketplace and Analytics platforms are expected to roll out.
By 2024, these platforms are projected to evolve from their beta stages to fully developed versions, broadening yPredict’s reach across various stakeholders.
With a comprehensive design that promises insights across the trading lifecycle, the demand for its native token, $YPRED, may see an upward trend as the project refines its suite of offerings.
Fantom: Evaluating Recent Trends and Market Sentiment
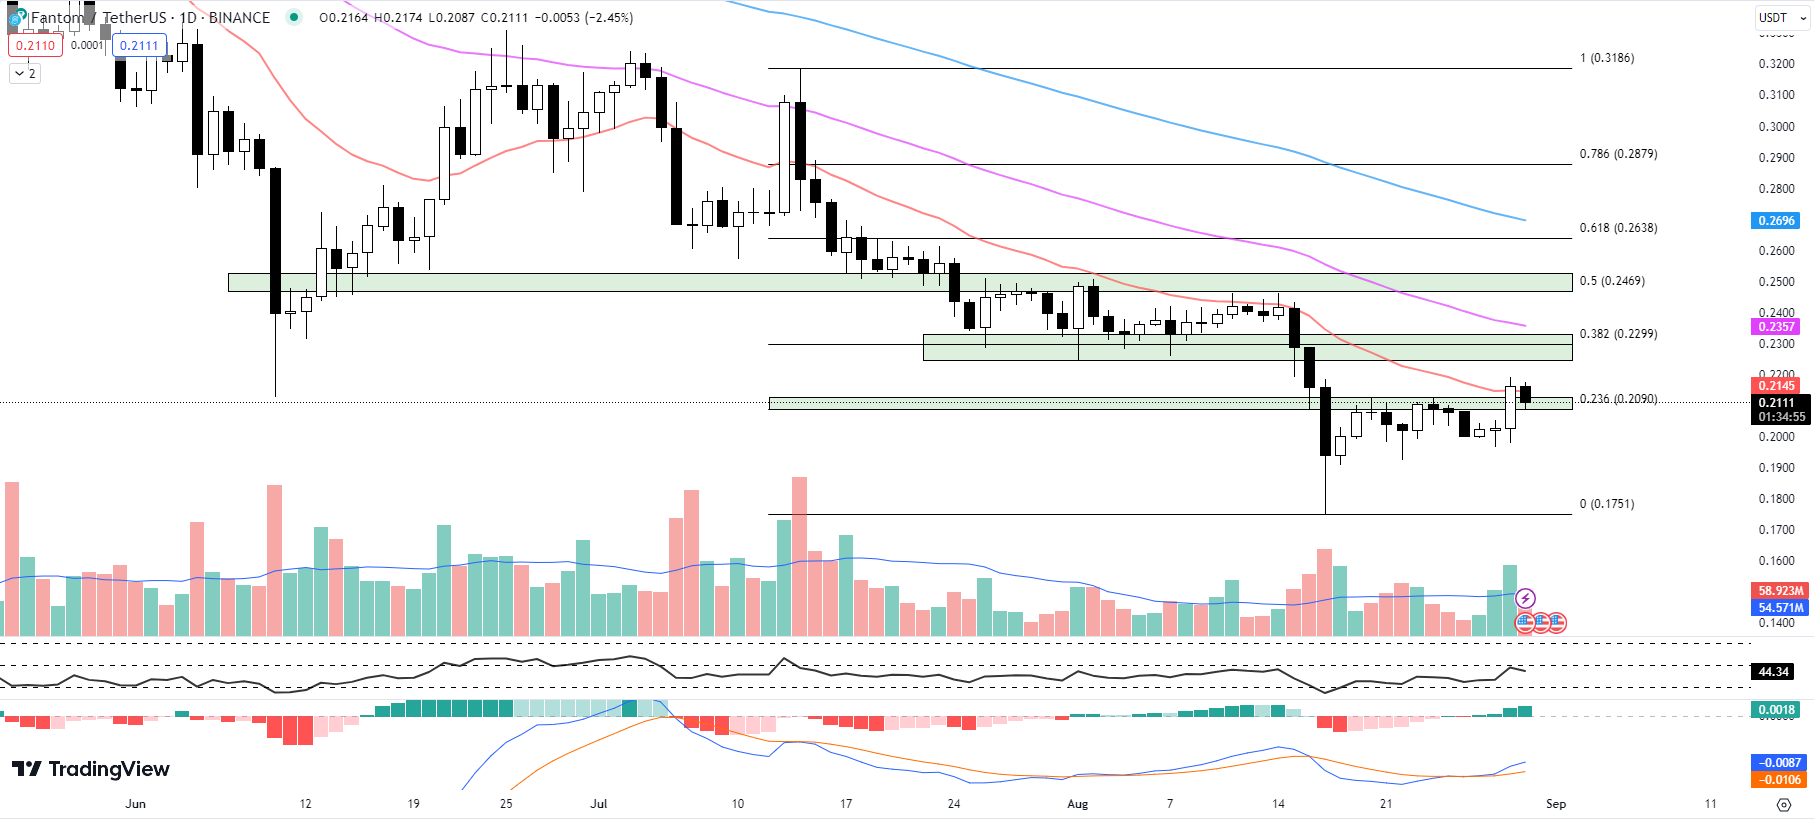
FTM rose 6.76% yesterday, breaking out from the resistance zone of $0.2089-$0.2126. It topped the Fib 0.236 level at $0.2090 briefly before dropping 3.45% so far today.
Interestingly, this downturn in FTM is not supported by trading volume. With FTM’s market cap down 2.13% to $591.7 million and 24-hour volume down 31.51% to $43.6 million, the indicators suggest that today’s downturn may potentially be just a temporary retracement.
This is an encouraging sign for those bullish on FTM, hinting that the Fib 0.236 level might hold as support, a suggestion further enhanced by the rebound from the intraday low of $0.2087 to the current price of $0.2111.
From a moving average perspective, FTM finds itself below the 20-day EMA ($0.2145), the 50-day EMA ($0.2357), and the 100-day EMA ($0.2696).
While this may initially seem like a bearish signal, the EMA lines may also act as dynamic resistance levels. Therefore, a sustained move above the 20-day EMA could trigger a bullish trend reversal.
The MACD histogram has slightly increased to 0.0018 from yesterday’s 0.0014. This slight uptick, albeit minimal, could be indicative of a potential shift in momentum.
The RSI is currently at 44.34, down from yesterday’s 47.60. While it’s not yet in the oversold territory (below 30), it’s edging closer to it, which could potentially signal an upcoming price reversal.
In terms of price levels to watch, the immediate resistance is the 20-day EMA of $0.2145.
Beyond that, there’s a more significant resistance zone of $0.2245 to $0.2329, aligning with the Fib 0.382 level of $0.2299.
On the flip side, the immediate support is found within the horizontal zone of $0.2089 to $0.2126, corresponding with the Fib 0.236 level of $0.2090.
Should FTM print a green candle above the Fib 0.236 level in the next day or two, this could potentially confirm the level as a support zone, which might lead to a potential period of consolidation before moving any further.
Disclaimer: Crypto is a high-risk asset class. This article is provided for informational purposes and does not constitute investment advice. You could lose all of your capital.