Bitcoin Will Probably Retest $25K But Bears Beware, On-chain Indicators Suggest BTC Price in Early-Stage Bull Market


Bitcoin (BTC)’s short-term technical outlook is not looking good.
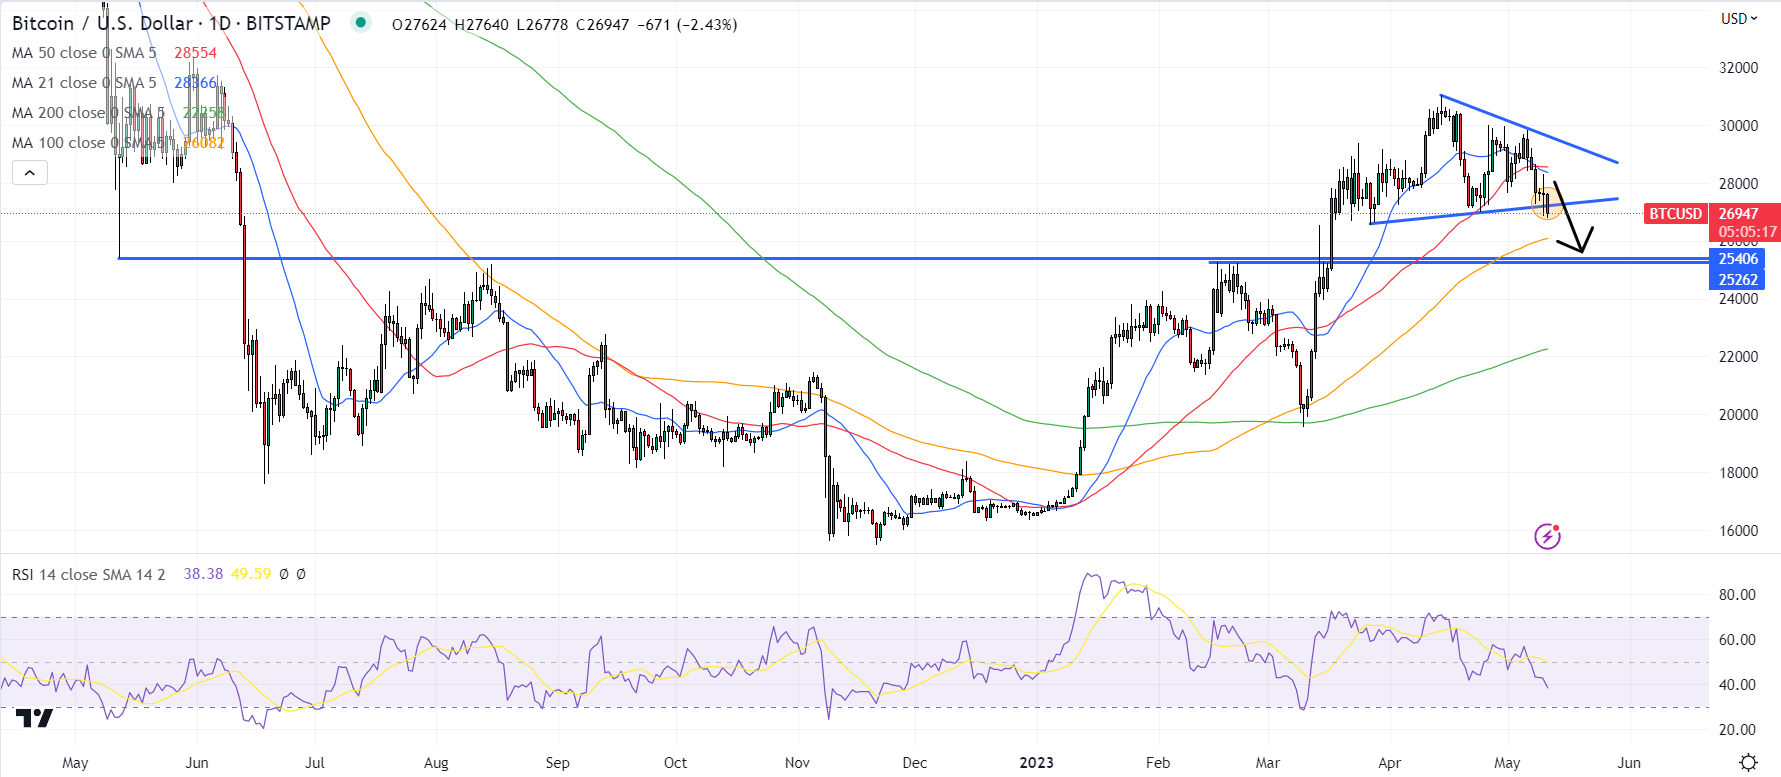
The world’s first and largest cryptocurrency by market capitalization has now pulled more than 13% lower versus the yearly highs it printed back in April to the north of the $31,000 level.
In doing so, it has fallen convincingly to the south of its 21 and 50-Day Moving Averages (both in the mid-$28,000s) and was last changing hands just under the $27,000.
Data this week showed that US inflation, while still hot, is easing, lessening pressure on the Fed to keep interest rates higher for longer.
But Bitcoin is threatening nonetheless threatening a break below the lower bounds of its mid-$26,000s to $31,000ish range that has been in plan since mid-March.
Perhaps more presciently, BTC is also threatening a breakout below a pennant structure that had formed in the past few weeks.
Once these key support levels finally give in, technicians are predicting that a test of support in the $25,200-400 area is on the cards.
But Bitcoin bears beware.
A further 6% drop from current levels won’t validate any long-term bearish Bitcoin thesis just yet.
A drop back towards late-2022 lows under $20,000 still seems exceedingly unlikely against the backdrop of macro conditions that, from Bitcoin’s perspective, are improving (Bitcoin likes a less hawkish Fed and US bank turmoil).
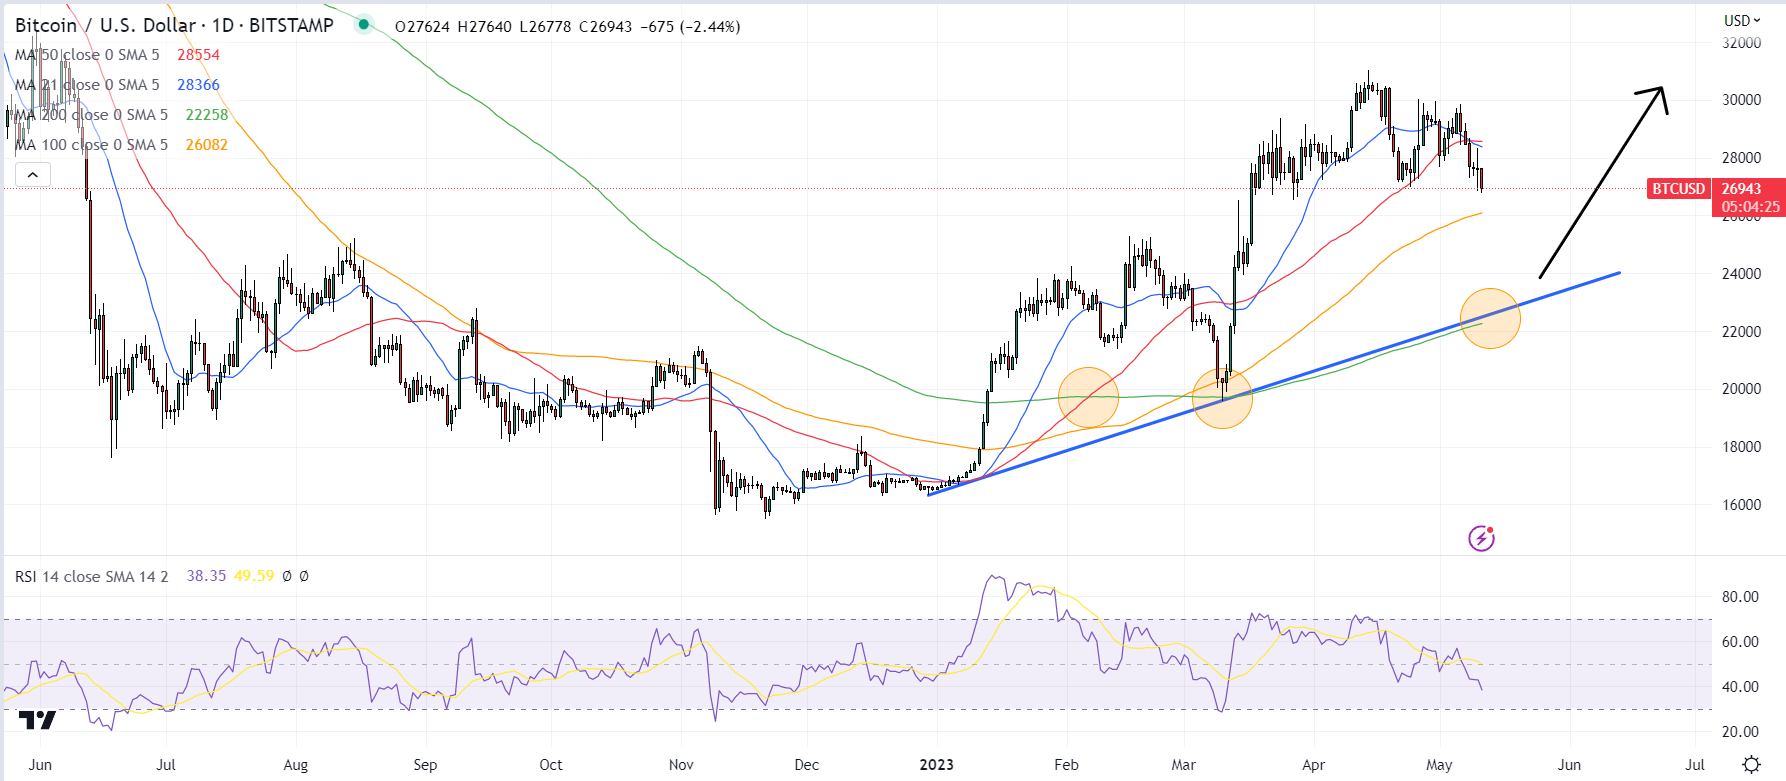
Longer-term technical analysis also shows the bear market is still intact, with Bitcoin still well above its 200-Day Moving Average, above its 2023 uptrend and having experienced a bullish golden cross three months ago.
Another reason to be bullish is that a laundry list of widely followed on-chain indicators are signaling Bitcoin is in the early stages of a new bull market.
Recovering from a Bitcoin Bear Market
Glassnode’s “Recovering from a Bitcoin Bear” dashboard tracks eight indicators to ascertain whether Bitcoin is trading above key pricing models, whether or not network utilization momentum is increasing, whether market profitability is returning and whether the balance of USD-denominated Bitcoin wealth favors the long-term HODLers.
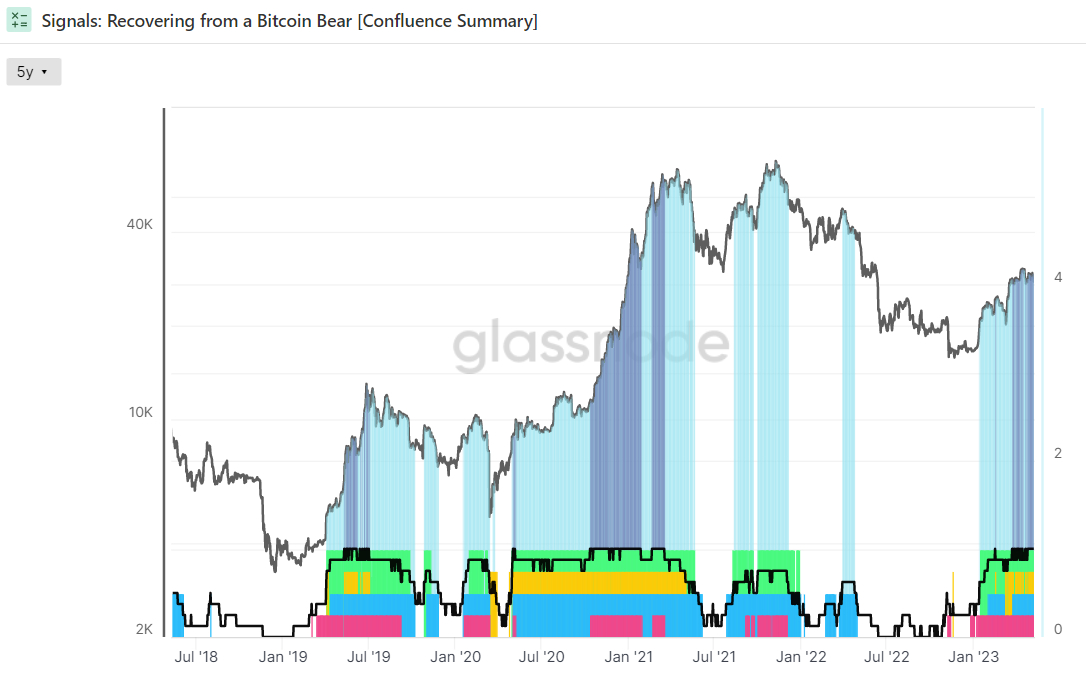
When all eight are flashing green, this has historically been a strong bullish sign for the Bitcoin market.
At the moment, all eight indicators are flashing green.
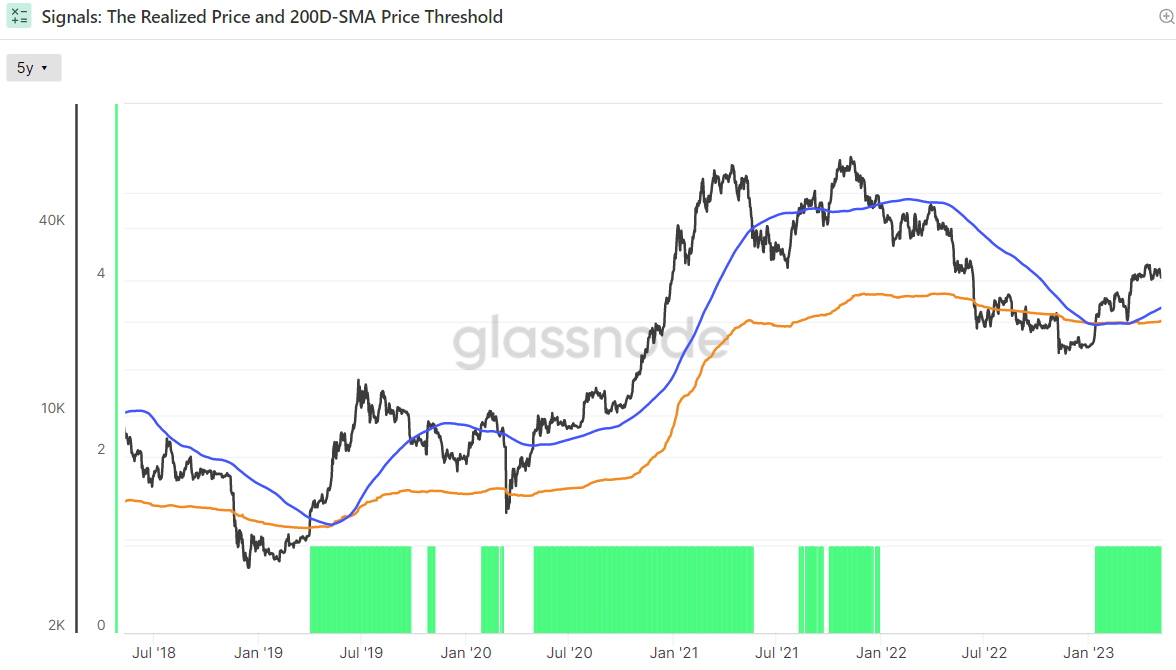
Bitcoin is trading comfortably above its 200DMA and Realized Price, the first two.
A break above these key levels is viewed by many as an indicator that near-term price momentum is shifting in a positive direction.
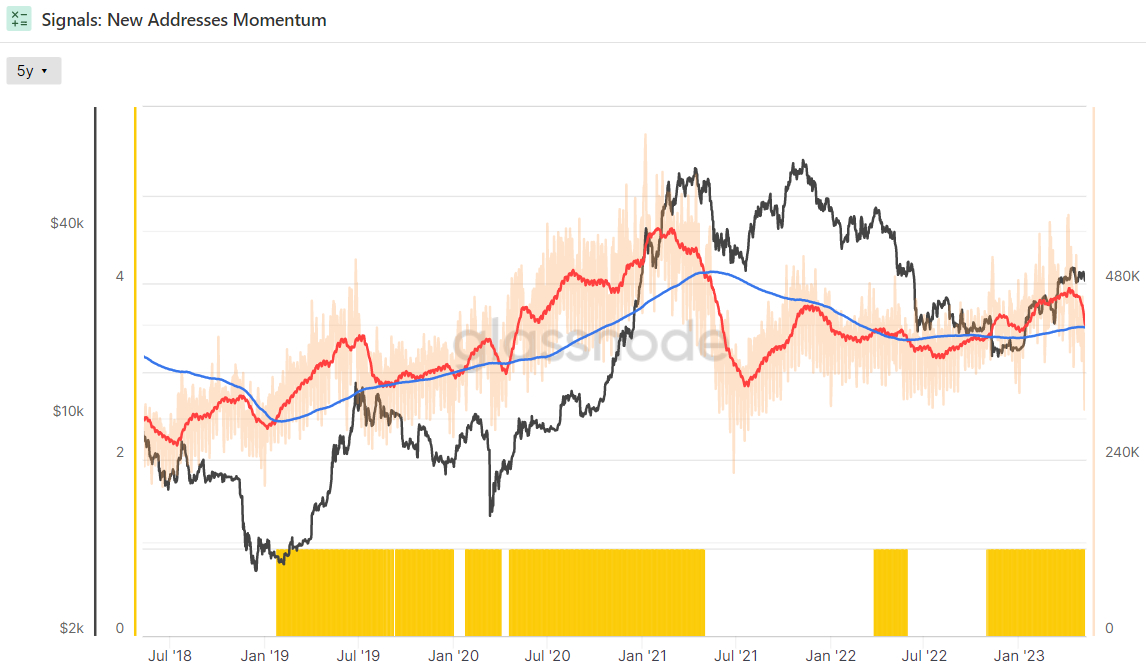
The 30-Day SMA of new Bitcoin address creation moved above its 365-Day SMA a few months ago, a sign that the rate at which new Bitcoin wallets are being created is accelerating. This has historically occurred at the start of bull markets.
Meanwhile, Revenue From Fees Multiple turned positive a few weeks ago.
The Z-score is the number of standard deviations above or below the mean of a data sample.
In this instance, Glassnode’s Z-score is the number of standard deviations above or below the mean Bitcoin Fee Revenue of the last 2-years.
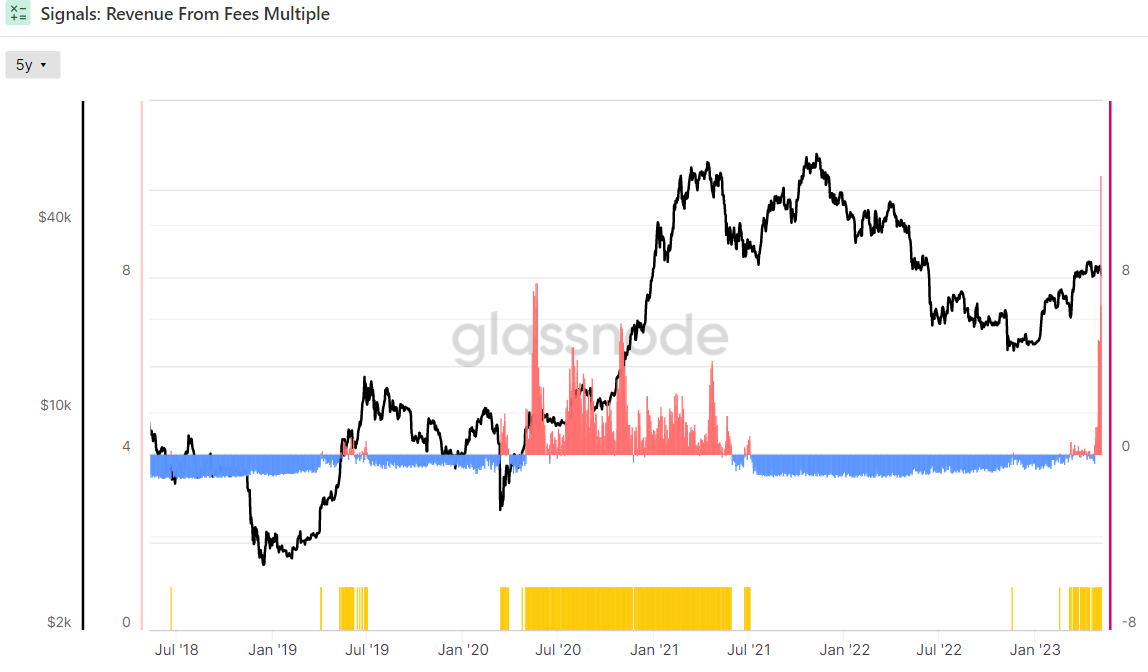
This means the third and fourth indicators relating to whether network utilization is trending positively once again are also sending a bullish signal.
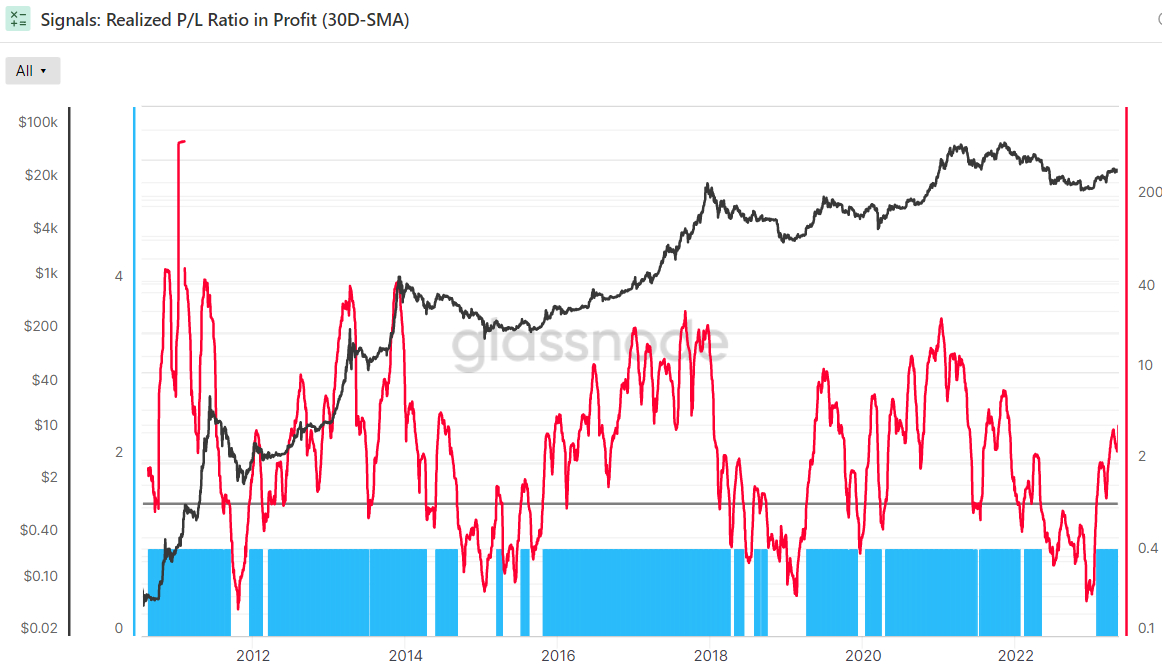
Moving on to the fifth and sixth indicators relating to market profitability, the 30-Day Simple Moving Average (SMA) of the Bitcoin Realized Profit-Loss Ratio (RPLR) indicator above one.
That means that the Bitcoin market is realizing a greater proportion of profits (denominated in USD) than losses.
According to Glassnode, “this generally signifies that sellers with unrealized losses have been exhausted, and a healthier inflow of demand exists to absorb profit taking”.
Hence, this indicator continues to send a bullish signal.
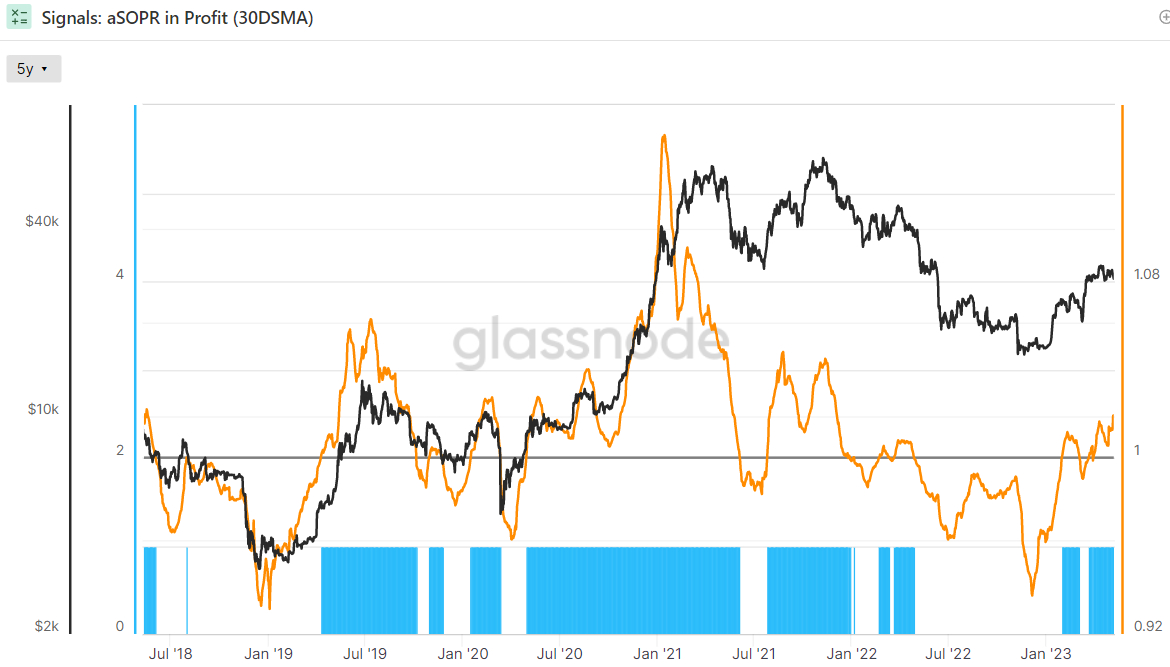
Meanwhile, the 30-day SMA of Bitcoin’s Adjusted Spent Output Profit Ration (aSOPR) indicator, an indicator that reflects the degree of realized profit and loss for all coins moved on-chain is also above one.
That essentially means that, on average over the past 30 days, the market is well in profit.
Looking back over the last eight years of Bitcoin history, the aSOPR rising above 1 after a prolonged spell below it has been a fantastic buy signal.
Finally, there are the final two indicators that relate to whether the balance of USD wealth had sufficiently swung back in favor of the HODLers to signal weak-hand seller exhaustion.
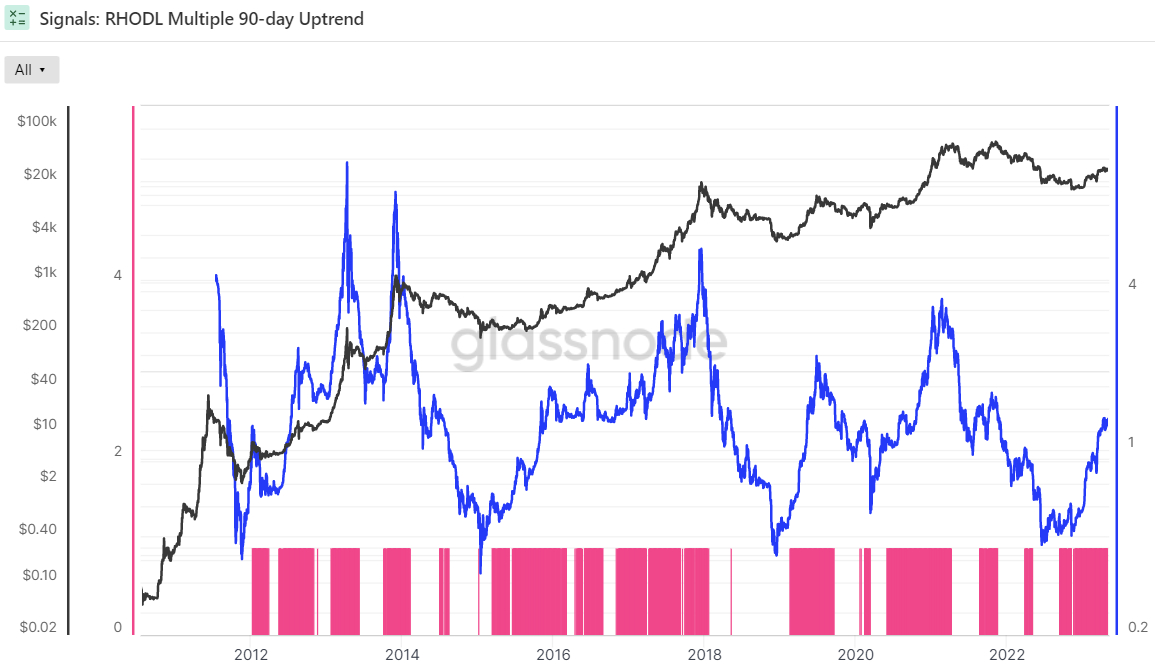
The Bitcoin Realized HODL Multiple has been in an uptrend over the last 90 days, a bullish sign according to Glassnode.
The crypto analytics firm states that “when the RHODL Multiple transitions into an uptrend over a 90-day window, it indicates that USD-denominated wealth is starting to shift back towards new demand inflows”.
It “indicates profits are being taken, the market is capable of absorbing them… (and) that longer-term holders are starting to spend coins” Glassnode states.
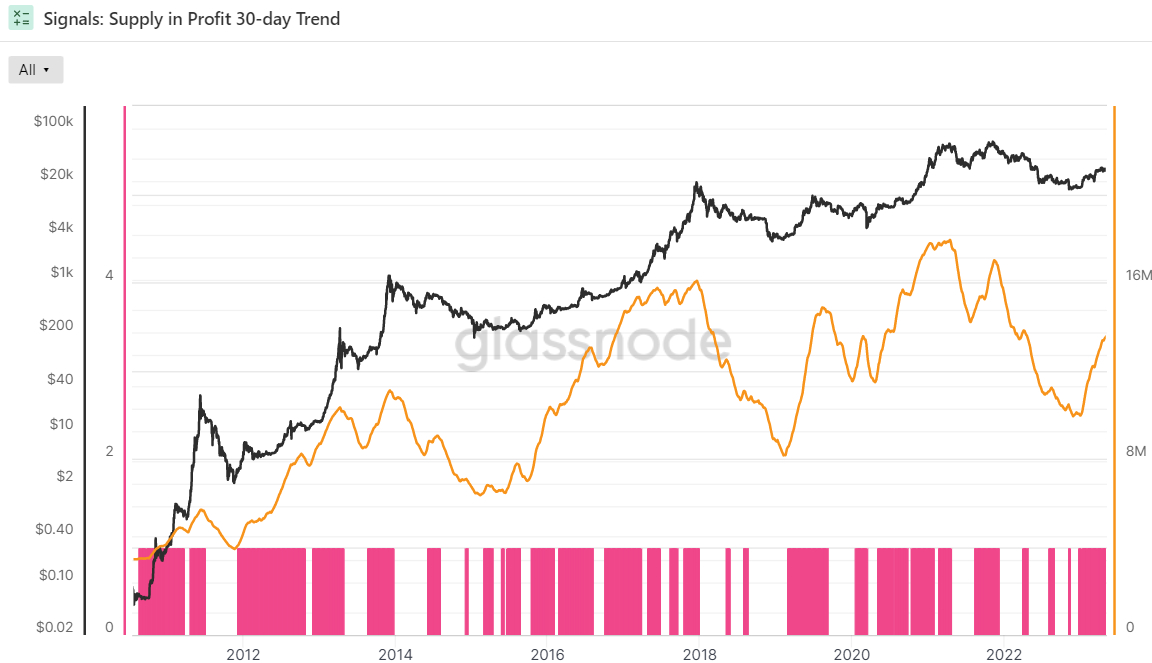
Glassnode’s final indicator in its Recovering from a Bitcoin Bear dashboard is whether or not the 90-day Exponential Moving Average (EMA) of Bitcoin Supply in Profit has been in an uptrend over the last 30 days or not.
Supply in Profit is the number of Bitcoins that last moved when USD-denominated prices were lower than they are right now, implying they were bought for a lower price and the wallet is holding onto a paper profit.
This indicator is also flashing green.
- Elon Musk Grok AI Predicts Incredible XRP Price Target by End of 2026
- Cardano News: ADA Price Just Gave Back Half Its 27% Weekly Rally, Are Whales About to Pull the Rug?
- Sam Altman ChatGPT AI Predicts Insane Bitcoin Price by 2026
- Elon Musk Grok AI Predicts Incredible XRP Price and Bitcoin Price by End of 2026
- XRP Price Prediction: Volume and ETF Inflow Send Ripple Token Higher
2M+
250+
8
70


- Elon Musk Grok AI Predicts Incredible XRP Price Target by End of 2026
- Cardano News: ADA Price Just Gave Back Half Its 27% Weekly Rally, Are Whales About to Pull the Rug?
- Sam Altman ChatGPT AI Predicts Insane Bitcoin Price by 2026
- Elon Musk Grok AI Predicts Incredible XRP Price and Bitcoin Price by End of 2026
- XRP Price Prediction: Volume and ETF Inflow Send Ripple Token Higher
More Articles

