


Bitcoin Price Prediction as BTC Rockets Past $30,000 Level for The First Time Since April – Can BTC Keep Rising?


Bitcoin’s price has surged above the $30,000 level, marking a significant milestone not seen since April.
This remarkable rally prompts the question: Can Bitcoin sustain its upward momentum and continue to rise?
However, it is important to note that Bitcoin faces solid resistance near the $30,700 mark, forming a double-top pattern.
The critical question remains: Will Bitcoin manage to break through this resistance or face a potential drop? Let’s delve into the analysis to gain further insights.
Unemployment Claims Data and Current Account Deficit Report: Potential Impact on Bitcoin Price
The recent release of unemployment claims data and the current account deficit report have important implications for the Bitcoin market.
Here are the key points:
Steady High Unemployment Claims: The number of individuals filing for state unemployment benefits remained at a 20-month high for the third consecutive week.
This trend indicates a potential weakening in the labor market as the Federal Reserve tightens credit conditions.
Last week, 264,000 new claims were filed, matching the previous week’s elevated level, the highest since October 2021.
Economists’ expectations were slightly lower at 260,000.
Unemployment Insurance Weekly Claims
— U.S. Department of Labor (@USDOL) June 22, 2023
Initial claims were 264,000 for the week ending 6/17, unchanged from the previous week's revised level.
Insured unemployment was 1,759,000 for the week ending 6/10 (-13,000).https://t.co/ys7Eg5LKAW
Decrease in Continued Claims: The number of individuals receiving unemployment benefits beyond the first week decreased to 1.759 million.
This figure was slightly below economists’ median estimate of 1.782 million, suggesting a mixed picture in terms of ongoing joblessness.
Widened Current Account Deficit: The US current account deficit, which measures the flow of goods, services, and investments, expanded slightly in the first quarter of 2023.
After three-quarters of narrowing, the deficit grew to $219.3 billion from a revised $216.2 billion in the previous quarter. Economists had projected a widening to $217.5 billion.
US current-account deficit widened $3.1bn to $219bn in Q1
— Gregory Daco (@GregDaco) June 22, 2023
➡️#Trade deficit narrowed $13bn to $201bn
Goods deficit: +$11bn on more exports/less imports
Services surplus: +$2bn
➡️Primary income surplus -$9bn to $50bn (higher rates)
➡️Secondary income deficit: -$7bn to $31bn pic.twitter.com/86CRokJXHB
These economic indicators may influence the sentiment and direction of the Bitcoin price as market participants assess the overall health of the US economy and potential implications for monetary policies.
Bitcoin Price
The current price of Bitcoin is $29,860, and its trading volume in the last 24 hours amounts to $28.8 billion.
Over the past day, Bitcoin has experienced an increase of nearly 1%, and in the last seven days, it has seen a growth of approximately 20%.
With a market cap of $579 billion, Bitcoin holds the top position in the CoinMarketCap ranking.
Bitcoin Price Prediction
Taking a closer look at the technical analysis of Bitcoin, particularly on the daily timeframe, we observe the formation of three bullish candles known as “three white soldiers,” which have propelled the price of Bitcoin towards the $30,000 level.
However, on the daily timeframe, there is a significant resistance around the $30,700 level, forming a double-top pattern that limits the overall upward momentum of Bitcoin.
This resistance level can potentially trigger a corrective move in Bitcoin’s price.
As Bitcoin failed to break through the $30,700 level, a close below this level could lead to a correction, potentially sending the price toward the 23.6% Fibonacci retracement level, which is projected around $29,300.
Further selling pressure could push the price towards the 38.2% Fibonacci level at approximately $28,400.
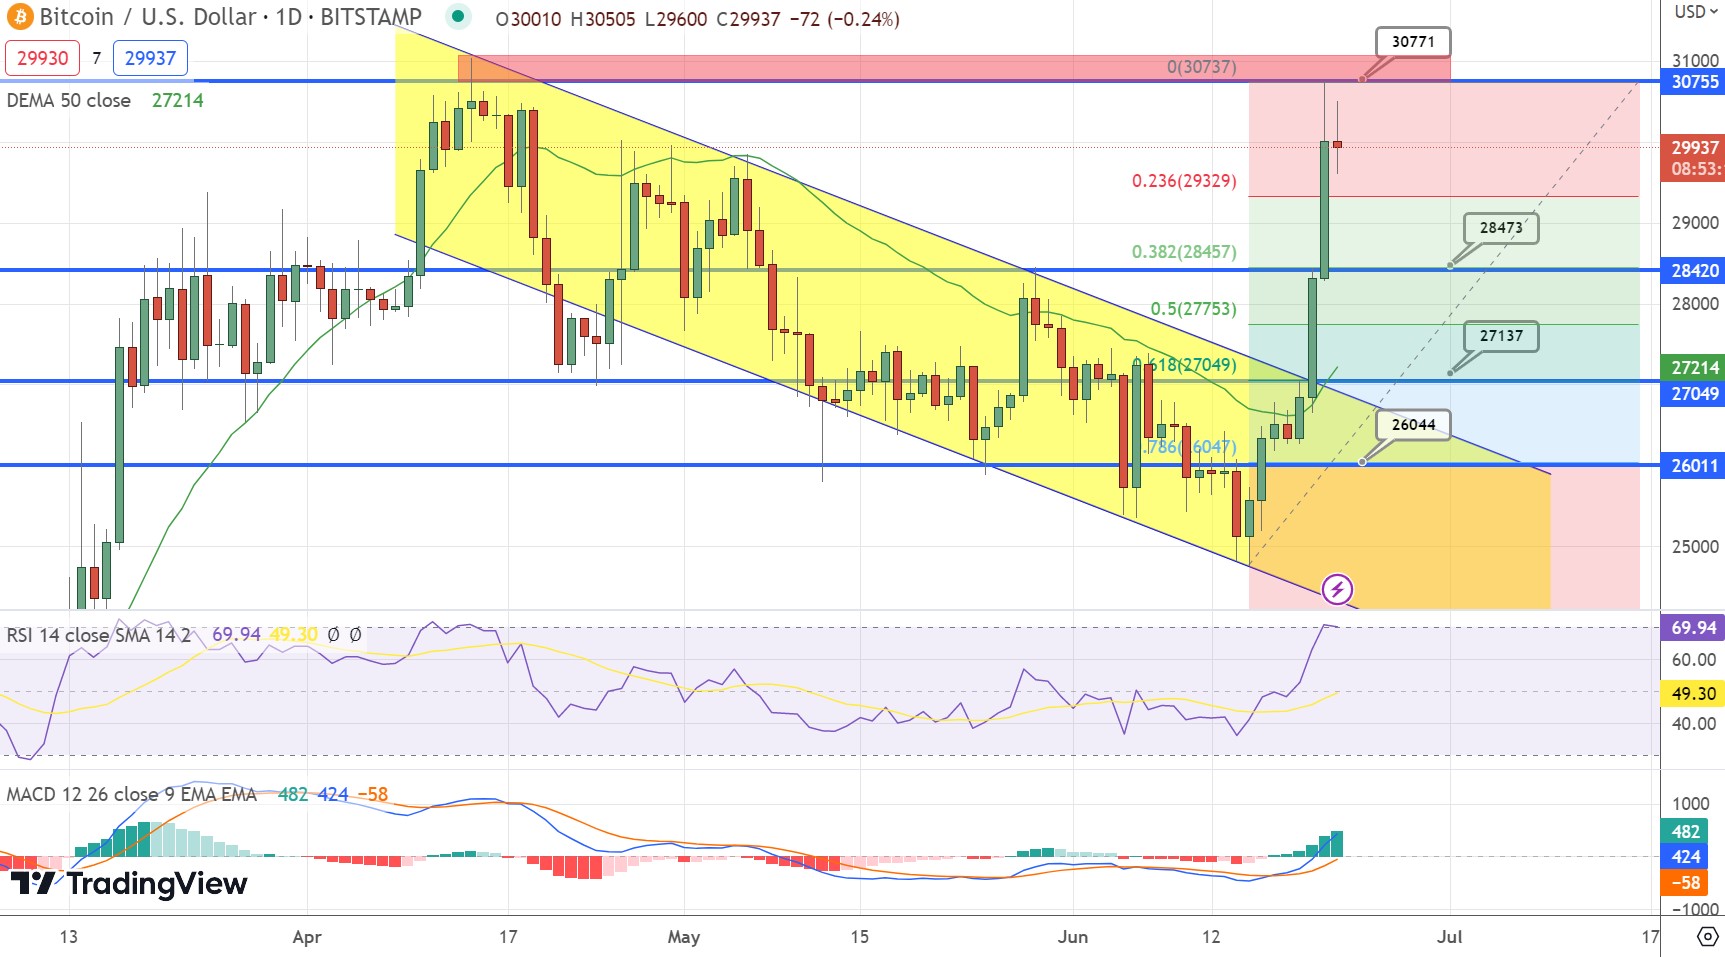
In the event of a more pronounced bearish trend, the next targets could be around $27,750 or $27,000, corresponding to the 50% and 61.8% Fibonacci retracement levels, respectively.
The $27,000 level is particularly significant from a technical perspective as it has previously acted as a resistance level.
Additionally, a downward channel is visible on the daily timeframe chart, further reinforcing the importance of this level.
Currently, the Relative Strength Index (RSI) and Moving Average Convergence Divergence (MACD) indicators both indicate overbought conditions, suggesting that the bullish momentum may be weakening.
However, for those considering a selling position, it is advisable to monitor the $30,700 level closely and look for potential short positions below this level, with stop-loss orders placed above $31,000.
On the other hand, if Bitcoin retraces toward the $27,000 area, it could present an attractive buying opportunity.
Top 15 Cryptocurrencies to Watch in 2023
Stay updated on the latest Initial Coin Offering (ICO) projects and alternative cryptocurrencies with our meticulously curated collection of the top 15 digital assets to watch in 2023.
Our list has been handpicked by industry experts from Industry Talk and Cryptonews, guaranteeing professional recommendations and valuable insights.
Stay one step ahead and explore the potential of these cryptocurrencies as you navigate the dynamic landscape of digital assets.
Find The Best Price to Buy/Sell Cryptocurrency
Disclaimer: Cryptocurrency projects endorsed in this article are not the financial advice of the publishing author or publication – cryptocurrencies are highly volatile investments with considerable risk, always do your own research.


