Bitcoin Price Prediction as BTC Makes New Yearly High – Where is the Next BTC Target?

 Bitcoin has experienced a remarkable surge, surpassing the 31,000 mark, signaling a bullish momentum in the cryptocurrency market.
The recent price movement has defied expectations, as Bitcoin failed to complete a retracement to the 23.6% Fibonacci level.
This upward trend has been fueled by growing optimism and positive sentiment in the crypto market, particularly driven by the recent news of a Bitcoin ETF.
In a significant move, renowned financial institutions such as Charles Schwab, Fidelity Digital Assets, and Citadel Securities have entered the cryptocurrency market, further adding to the positive outlook.
As the price of Bitcoin continues to climb, let us take a look at the technical side to determine the next target for the world’s leading cryptocurrency.
Bitcoin Price
The current price of Bitcoin is $30,608, and its trading volume in the past 24 hours has reached $24 billion.
Bitcoin has experienced an increase of almost 2% within the last 24 hours and nearly 15% over the past week.
It holds the top position on CoinMarketCap with a market capitalization of $594 billion.
The circulating supply of Bitcoin is 19,410,556 BTC coins, with a maximum supply of 21,000,000 BTC coins.
Bitcoin Price Prediction
From a technical perspective on Bitcoin, it faces significant resistance around the $30,700 level, reinforced by a double-top pattern.
On the daily timeframe, Bitcoin briefly surpassed the $30,700 level and reached a high of around $31,500.
However, the candlestick formation with a long wick and body suggests investor indecision, as they could not break through the resistance at $30,700.
This level continues to serve as a major hurdle for Bitcoin.
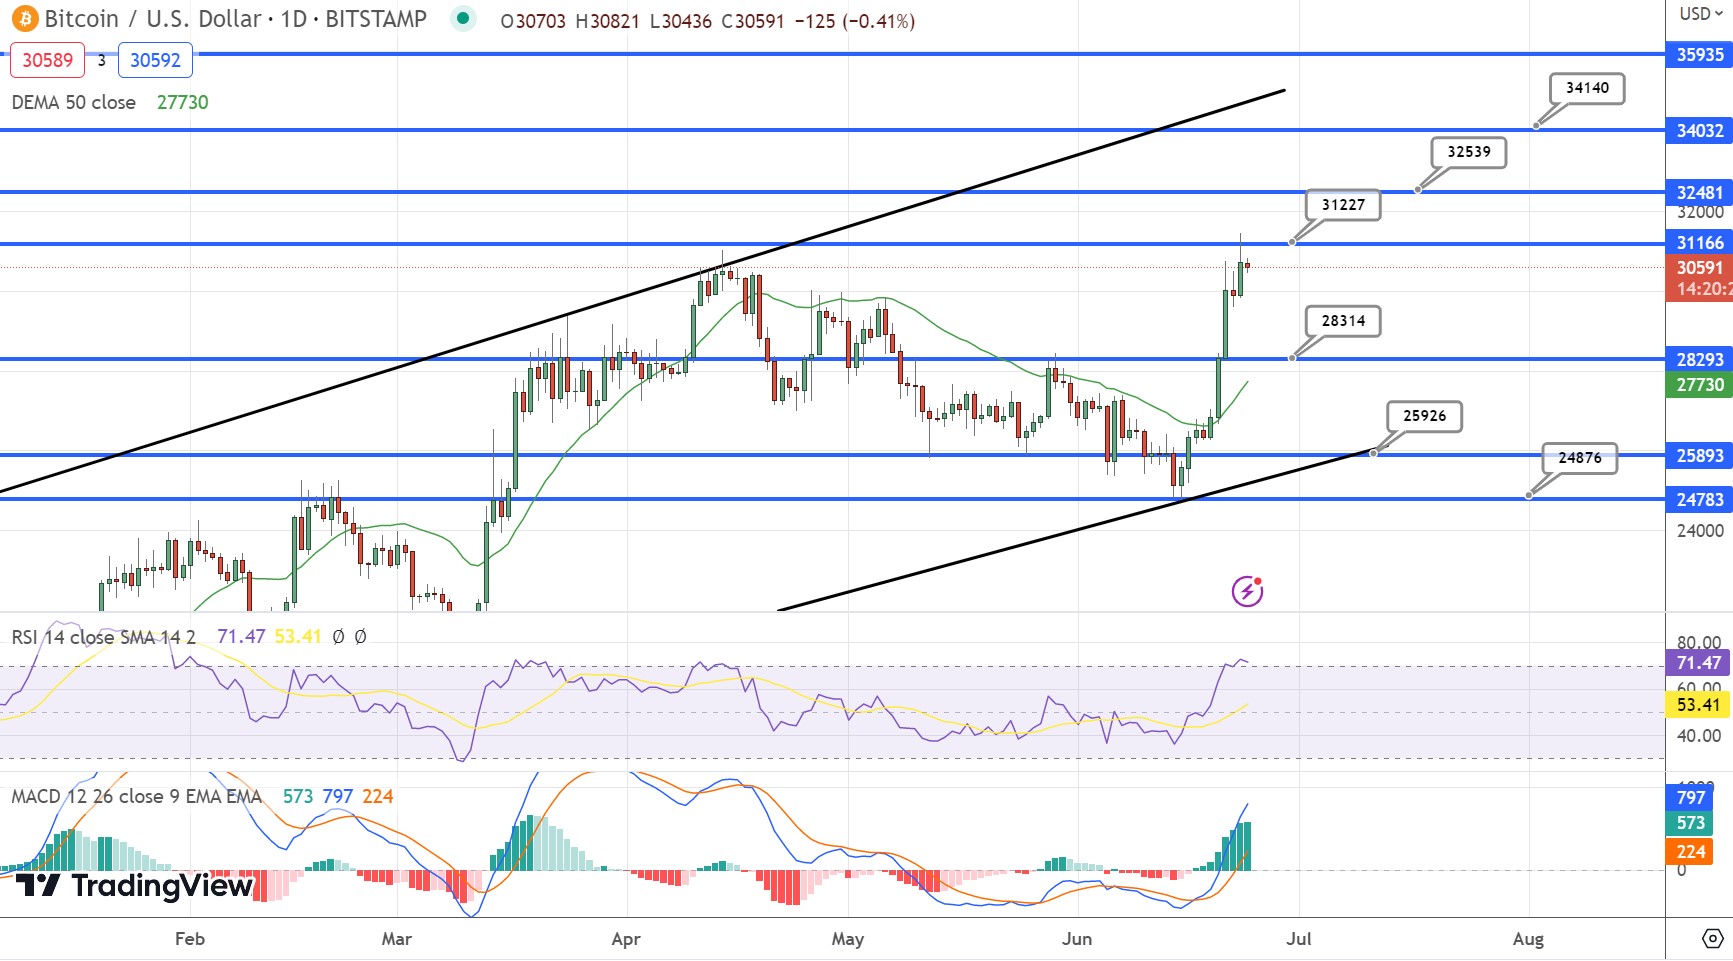
When considering leading technical indicators such as the Relative Strength Index (RSI) and Moving Average Convergence Divergence (MACD), both indicators indicate overbought conditions.
The RSI hovers around 70, while the MACD histogram is significantly above the zero line.
This suggests that investors should consider taking profits before expecting further upward movement in the price of Bitcoin.
In the event of a break below the $30,700 level, Bitcoin has a strong likelihood of experiencing a corrective pullback.
The $30,000 level acts as a psychological support level at the moment, and a break below it could potentially send Bitcoin toward $28,250.
Conversely, a breakout above the $31,250 level could expose Bitcoin to $32,000 or even $34,150.
To summarize, it is advisable to monitor the $31,000 level closely.
A close below this level is likely to trigger a corrective pullback, while a breakout above it has the potential to continue the bullish trend.
Top 15 Cryptocurrencies to Watch in 2023
Stay informed about the latest initial coin offering (ICO) projects and alternative cryptocurrencies by regularly exploring our carefully selected collection of the top 15 digital assets to watch in 2023.
This thoughtfully curated list has been compiled by industry experts from Industry Talk and Cryptonews, ensuring that you receive professional recommendations and valuable insights.
Stay ahead of the game and discover the potential of these cryptocurrencies as you navigate the ever-changing world of digital assets.
Find The Best Price to Buy/Sell Cryptocurrency
Disclaimer: Cryptocurrency projects endorsed in this article are not the financial advice of the publishing author or publication – cryptocurrencies are highly volatile investments with considerable risk, always do your own research.