
Bitcoin Bears Eye Retest of Key $25,000 Support – How Far Might the BTC Price Fall?


After last week’s sharp 10.5% decline, which marked Bitcoin (BTC)’s worst weekly performance so far this year, the BTC price has largely settled on Monday.
Bitcoin was last moving sideways within thin ranges on either side of $26,000 as traders look ahead to the upcoming week.
Will the upcoming raft of US data releases and commentary from Fed policymakers (Fed Chair Jerome Powell is speaking on Friday) push long-dated US government bond yields to fresh multi-decade highs, putting crypto and US stock markets under further pressure?
Will technical selling after last week’s break below the 2023 uptrend and 200-Day Moving Average (DMA) continue to pressure the BTC price?
In the absence of fresh updates regarding bullish Bitcoin narratives such as the raft of spot Bitcoin Exchange Traded Fund (ETF) applications that were filed back in June by Wall Street heavyweights like BlackRock, Fidelity and Vanguard, Bitcoin remains vulnerable to further near-term downside.
Let’s examine how far it might fall.
How Far Might Bitcoin (BTC) Price Fall?
Despite the more than 18% pullback from the multi-year highs it printed back in July near $32,000, Bitcoin is still up 56% for the year.
This rally has been far from a straight line.
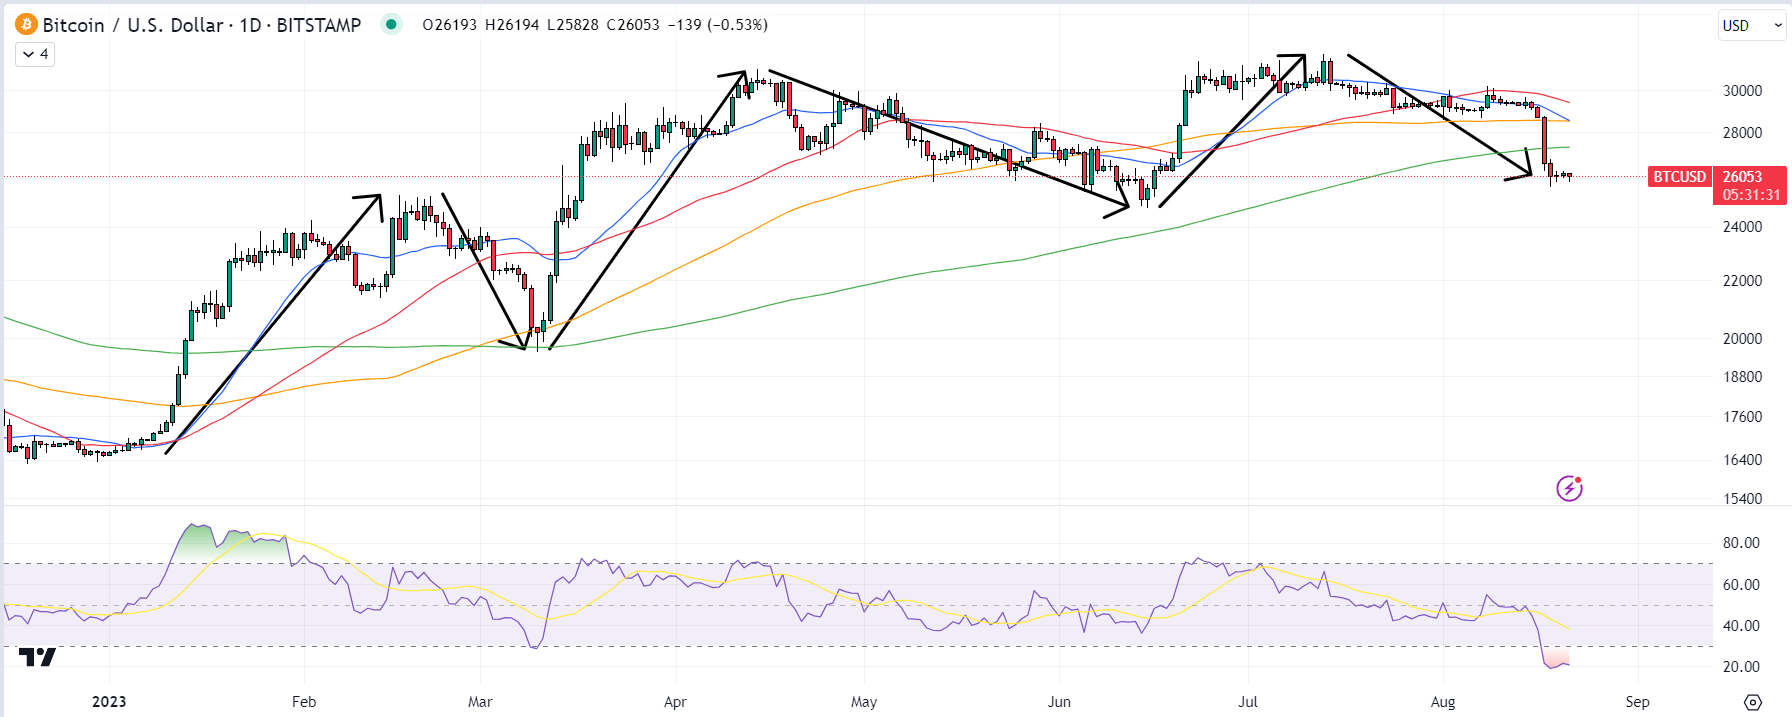
Indeed, 2023’s rally has so far happened in six stages.
The first stage was a rapid more than 50% rally from the year’s starting point around $16,500 to the February highs above $25,000.
The second stage was a 22.5% pullback from the February highs to the March lows under $20,000.
The third stage was a near 60% rally from the March rally to the April highs above $31,000.
The fourth stage was a slightly more than 20% pullback from the April highs to the June lows under $25,000.
The fifth stage was a subsequent near 30% rally from the June lows to the July yearly highs near $32,000.
Finally, the sixth stage, which Bitcoin remains stuck in, is a just over 18% decline from these recent highs.
If the rally so year is anything to go by, Bitcoin might only fally back another 2-4% from July’s highs, before the rally kicks off again.
That could imply lows around the June lows just under $25,000.
But This Pull Back Could Be Worse
However, there are a few aspects of the most recent pullback that make it more concerning than the two major pullbacks previously seen this year.
The last two pullbacks saw Bitcoin remain above its 200DMA, whilst also keeping the 2023 uptrend intact.
The latest pullback has violated both of these vital long-term support levels.
Meanwhile, the pace of the rally slowed substantially in the June/July push higher versus the January/February and March/April rallies, with Bitcoin only able to get just over 2% above its prior April highs in July.
That was a signal of growing buyer exhaustion as the price rose into the low $30,000s.
On-chain metrics are also sending some concerning signals that the recovery from 2022’s bear market may be faltering – just three of the eight on-chain and technical signals tracked in Glassnode’s Recovering from a Bitcoin Bear dashboard are sending a bullish signal.
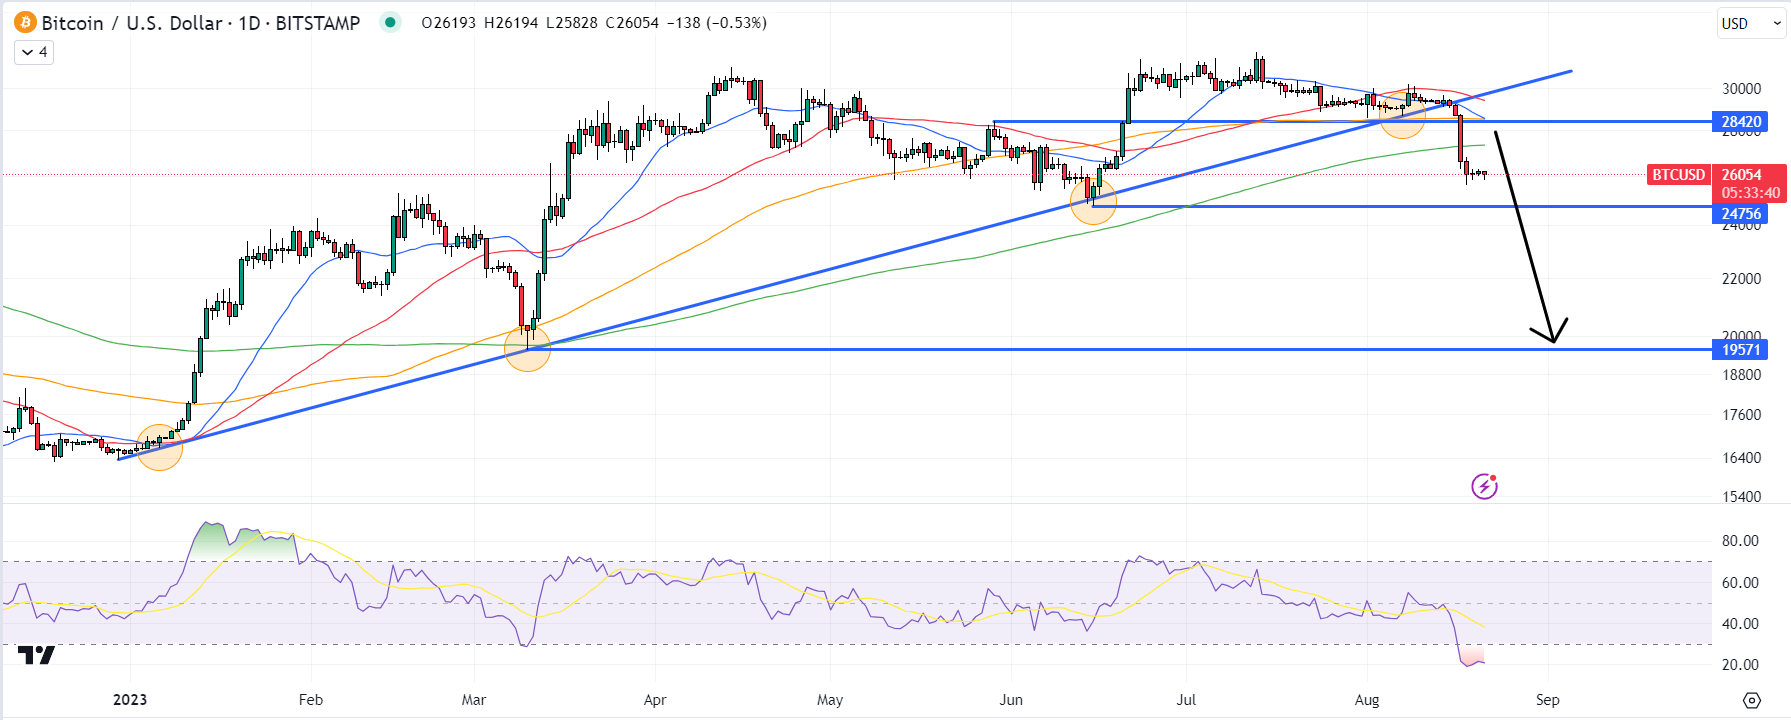
Given the above, Bitcoin is at risk of falling below support at $24,750.
If this level is broken, its clean air all the way lower to $20,000, where Bitcoin’s Realized Price currently sits (i.e. the average price at which each Bitcoin last moved – a proxy for the average price paid).
The fact that Bitcoin is currently heavily oversold as per the 14-Day Relative Strength Index (RSI) indicator could be a saving grace for the cryptocurrency, buying it sometime before the next drop at the very least.
- XRP Price Prediction: Judge in XRP Ruling Delivers Fresh Blow
- Ethereum Price Prediction: Tom Lee Predicts $5 Trillion Ethereum
- Ex-SWIFT CIO Tom Zschach Shuts Down XRP Partnership Claims in Two Words
- Sam Altman ChatGPT AI Predicts Bitcoin Price Will Shock Everyone by End Of 2026
- Crypto News, July 9: Iran Market Fears Fade as Bitcoin and Ethereum Price Shrug Off Another Panic
2M+
250+
8
70


- XRP Price Prediction: Judge in XRP Ruling Delivers Fresh Blow
- Ethereum Price Prediction: Tom Lee Predicts $5 Trillion Ethereum
- Ex-SWIFT CIO Tom Zschach Shuts Down XRP Partnership Claims in Two Words
- Sam Altman ChatGPT AI Predicts Bitcoin Price Will Shock Everyone by End Of 2026
- Crypto News, July 9: Iran Market Fears Fade as Bitcoin and Ethereum Price Shrug Off Another Panic
More Articles

