Best Crypto to Buy Now September 13 – Toncoin, Radix, Bitcoin SV


Delaware Bankruptcy Court officials are expected to rule today on cryptocurrency exchange FTX’s request to liquidate up to $3.4 billion in digital assets.
The potential sell-off has raised concerns about its possible impacts on the already struggling cryptocurrency market.
Given this backdrop, what are the best cryptos to buy now?
🚀 FTX aims to liquidate a staggering $3.4 billion in crypto assets, with Galaxy Digital lined up as the investment manager. The Delaware Bankruptcy Court will rule on this proposal on September 13.
— Rome Blockchain Labs Inc. (@romeblockchain) September 12, 2023
FTX seeks to sell off holdings of Bitcoin, Ether, Solana, and other tokens to raise capital and pay back creditors.
The proposal has raised concerns among U.S. bankruptcy regulators that selling large amounts of crypto assets could further destabilize the market.
In a compromise, FTX agreed to privately update the U.S. Trustee and creditor committees on planned sales to avoid sparking panic selling.
FTX currently holds approximately $685 million in locked Solana tokens, $529 million in FTT, its native token, along with Bitcoin, Ethereum, and other cryptocurrencies.
The exchange proposes selling up to $100 million per week initially, with the potential to increase to $200 million on a token-to-token basis.
Analysts warn the large-scale sell-off could particularly impact Solana, one of FTX’s biggest holdings. However, most Solana tokens are locked until 2025, reducing immediate liquidation fears.
The asset sale comes as FTX has filed a $21 million lawsuit against LayerZero over disputed transactions. These ongoing legal challenges could potentially complicate the timing and feasibility of FTX’s planned liquidation.
Some market observers note asset sell-offs have historically preceded crypto price declines. With the market already on shaky ground, the impending FTX liquidation could bring further turbulence.
With the market eyeing FTX’s liquidation closely, Toncoin, Wall Street Memes, Radix, Bitcoin BSC, and Bitcoin SV are some of the best cryptos to buy now given their robust fundamentals and/or positive technical analysis.
Toncoin (TON) Bounces Back Strongly, Reclaiming Key Price Levels
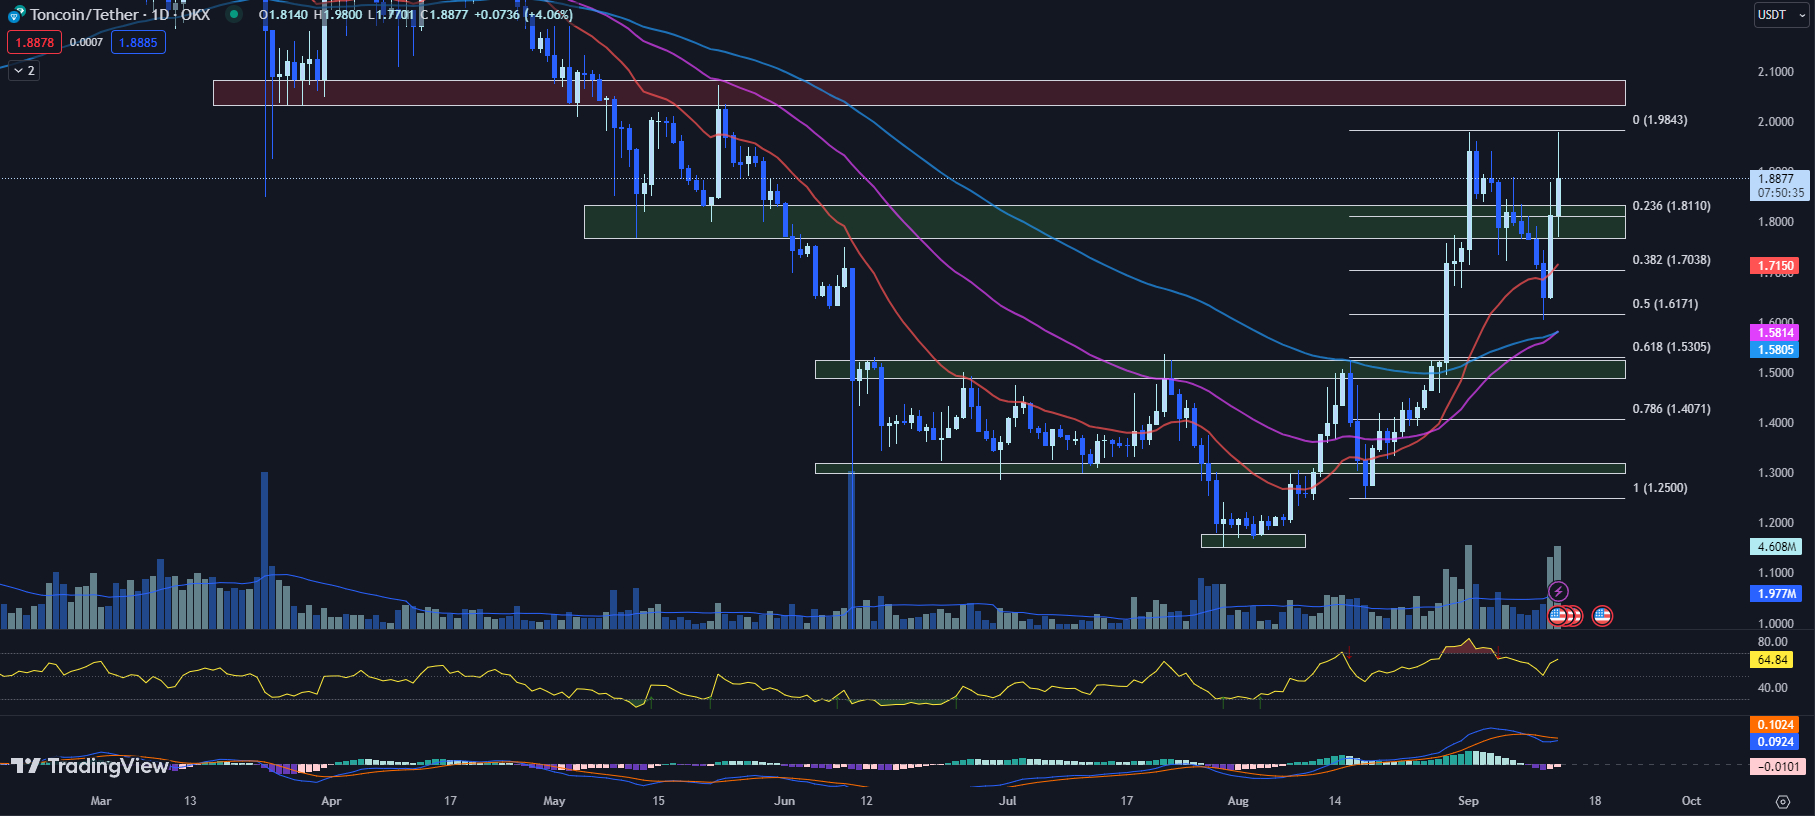
Toncoin (TON) has been showing a substantial recovery over the past two days after finding footing at the Fib 0.5 retracement level of $1.6171 on September 11, bouncing back from a near two-week low of $1.6040.
The cryptocurrency pushed back above its 20-day EMA and the Fib 0.382 retracement level. On the previous day alone, the price increased by 9.95% from its low.
The positive momentum has continued, with Toncoin currently trading at $1.8877 as of writing – representing a 4.06% gain so far today and signifying an ongoing recovery trend.
The technical indicators give further credence to this bullish trend. The 20-day EMA at $1.7139, which TON has successfully recaptured, suggests a short-term bullish trend.
More significantly, a crossover between the 100-day EMA and 50-day EMA, currently at $1.5806 and $1.5814 respectively, occurred after 130 days. This signals a potential upside for TON in the upcoming days.
TON’s RSI of 64.84 is up from yesterday’s 50.75, indicating growing buying pressure, and demonstrating a bullish momentum. Concurrently, the MACD histogram shows an improvement from -0.0174 to -0.0101, indicating a decrease in the selling momentum.
In terms of market statistics, both the market cap and volume are on the rise. The market cap has increased by 7.35% to $6.4 billion, and the 24-hour volume has seen a drastic surge of 93.20% to $63.2 million. These metrics suggest an increasing interest in TON among traders.
Looking at key price levels, TON is facing immediate resistance at its 4-month high of $1.98. This level was retested earlier today, underlining its significance.
If TON manages to breach this level, the next potential resistance zone is pegged between $2.0332 to $2.0822.
On the flipside, immediate support is found at the horizontal support zone of $1.7686 to $1.8334, which coincides with the Fib 0.236 level of $1.8110.
The confluence of short- and medium-term bullish signals implies the Toncoin recovery still has room to run higher. That said, traders must be attentive to potential exhaustion after such a steep rally.
Taking partial profits at targeted resistance levels makes sense to preserve profits while allowing positions to ride further momentum.
WSM Token Presale Success: Will Wall Street Memes Outshine Pepe Coin Post Launch?
The meme coin craze is set for a new chapter as Wall Street Memes (WSM) gears up for its exchange listing later this month. The token launch is backed by one of the most dominant internet communities, Wall Street Memes.
With over 1 million followers across social media platforms, Wall Street Memes has established itself as an influential voice in finance and investing. The community is now looking to tap into the meme coin trend with the launch of its own token, $WSM.
80-year lease paying $300 a month pic.twitter.com/fKcWNQl7SV
— Wall Street Memes (@wallstmemes) September 11, 2023
The WSM token is set to begin trading on exchanges in less than two weeks, according to the project’s official website. The presale round has proven a resounding success, having raised more than $25 million at the time of writing.
For those still interested in participating, tokens can be purchased at a fixed price of $0.0337 prior to the initial listing.
Analysts widely predict the debut will trigger a series of bull runs, possibly even overshadowing the surge by Pepe Coin earlier this year. The hype has partly been fueled by tech billionaire Elon Musk, who has engaged with Wall Street Memes’ social media posts in the past.
However, WSM is not just looking for a short-term price pump. Thirty percent of the token supply is set aside as community rewards, giving long-term incentives to holders. The project recently announced a $50,000 WSM token airdrop for the members of its thriving community.
With the countdown underway, investors are flocking to grab WSM tokens before the price jumps post-listing. The token can be purchased using ETH, BNB, USDT, and credit cards.
Radix (XRD) Seeks to Reclaim Support Amid Market Challenges
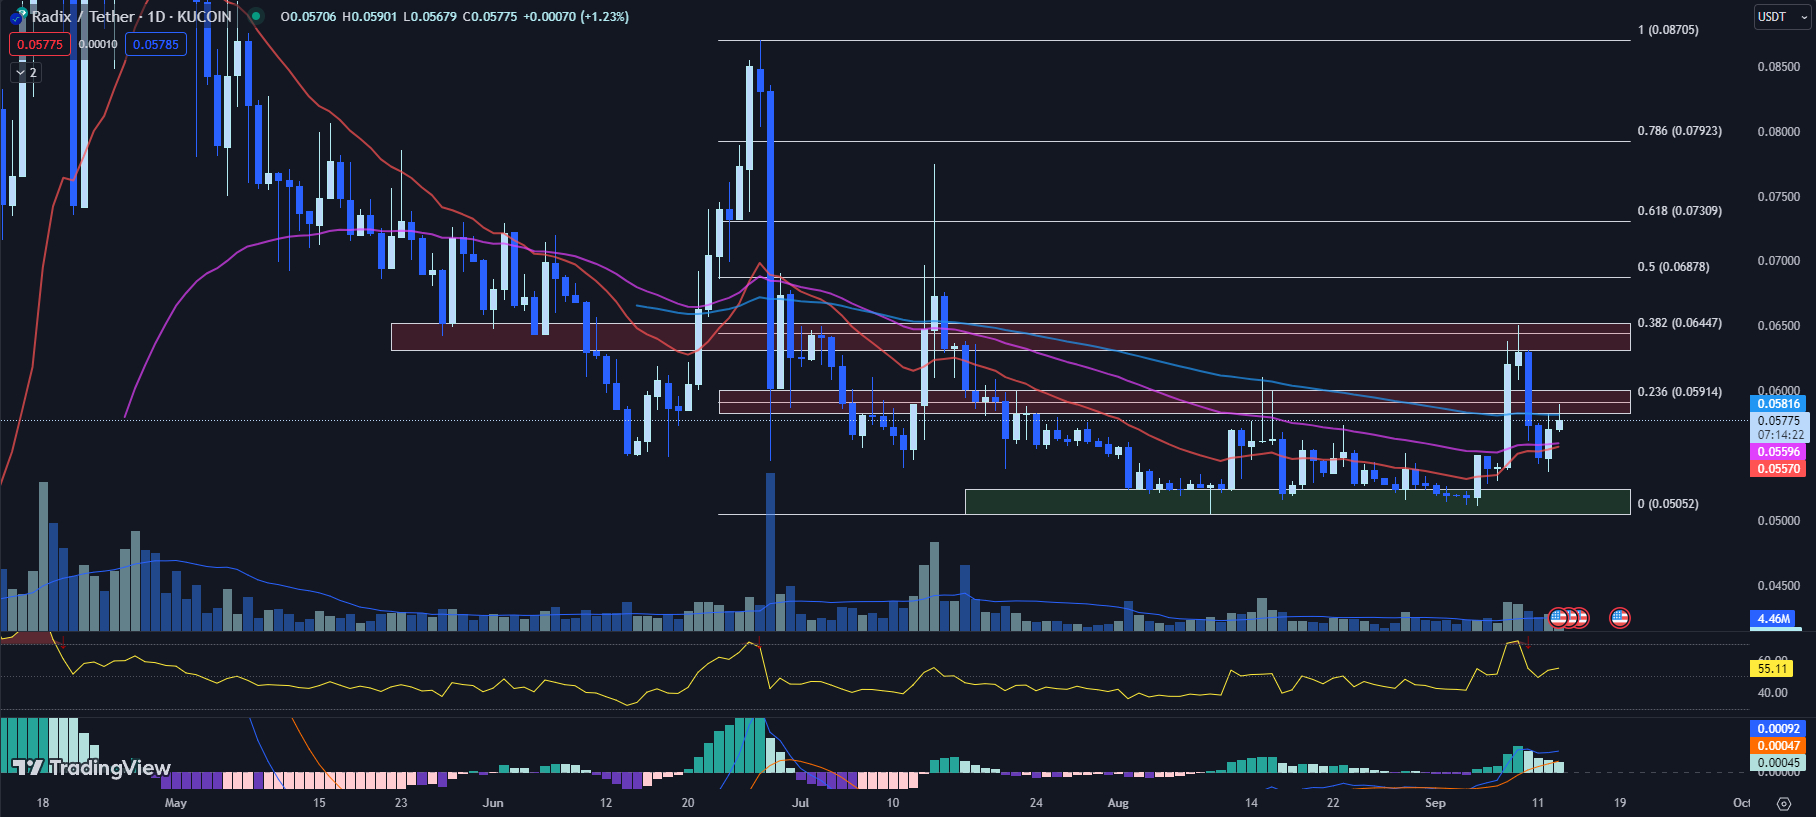
After a significant 13% selloff between September 10 and September 11, XRD is currently trying to recover and retake its 100-day Exponential Moving Average (EMA).
The recent selloff saw Radix breach its 100-day EMA and temporarily fall below the essential horizontal support zone of $0.05833 to $0.06009, which notably aligns with the reverse Fib 0.236 level of $0.05914.
However, the cryptocurrency demonstrated some backbone by bouncing off its 20-day and 50-day EMA with a 3.97% move to the upside yesterday.
XRD is currently trading at $0.05775, a 1.23% increase so far today, as it seeks to once again reclaim its 100-day EMA.
From a technical perspective, Radix is displaying a mix of signals. The 20-day EMA stands at $0.05570, and the 50-day EMA at $0.05596, both currently serving as immediate support levels. The 100-day EMA is located at $0.05816, a critical resistance point for XRD to break.
XRD’s RSI is currently at 55.11, up from yesterday’s 53.77. This rise indicates a growing bullish momentum, hinting that buyers are gradually overtaking sellers in the market.
The MACD histogram also displays a positive shift from yesterday’s 0.0050 to today’s 0.00045. This movement suggests the start of a bullish bias in the market.
Resistance is currently posed by the 100-day EMA of $0.05816, which is closely followed by the horizontal resistance zone of $0.05833 to $0.06009, which is also in confluence with the reverse Fib 0.236 level of $0.05914.
A clean break from these levels could potentially trigger a price rally toward the next horizontal resistance zone of $0.06311 to $0.06521, which aligns with the reverse Fib 0.382 level of $0.06446.
Traders should monitor the 100-day EMA and key resistance levels closely. A clean break above the 100-day EMA could signal a strong buying opportunity. However, if XRD fails to retake the 100-day EMA, the 50-day and 20-day EMAs may provide sufficient support for the short term.
BTCBSC: Buy Bitcoin at 2011 Prices and Earn Staking Rewards; One of the Best Cryptos to Buy Now
Twelve years after Bitcoin first hit the $1 mark, a new token called Bitcoin BSC (BTCBSC) is offering crypto enthusiasts a chance to go back in time and buy at 2011 prices.
With 6 million tokens on sale for $0.99 each in its presale, BTCBSC mirrors Bitcoin’s early circulating supply and price while adding staking rewards.
https://www.twitter.com/Bitcoinbsctoken/status/1701943911642497397BTCBSC is not built on the original Bitcoin blockchain but rather operates on the Binance Smart Chain. This enables features not possible with Bitcoin, most notably staking rewards for holders.
According to the project’s website, BTCBSC staking offers an annual percentage yield of 359% as of writing.
While growing participation is likely to cause this rate to fall gradually, projections suggest the BTCBSC staking rewards will continue towering above the mainstream crypto market APY range of 3-5%.
Staking rewards are distributed whenever a new block is confirmed on the Binance Smart Chain, just as with Bitcoin mining rewards each time a new Bitcoin block is mined. However, BTCBSC uses a Proof of Stake model that is more energy efficient.
BTCBSC will also provide faster transaction times and lower fees made possible by the Binance Smart Chain, which contrasts with Bitcoin’s comparatively slower and more expensive transactions.
The project has already raised over $1.55 million in its first week of presale. This shows there is interest in the concept of a “Bitcoin 2.0” token among cryptocurrency enthusiasts.
The BTCBSC presale will continue raising funds toward its hard cap goal of $6,063,750.
Once achieved, BTCBSC will launch on a decentralized BSC exchange, with 2% of the total supply locked in the DEX liquidity pool to enable efficient trading.
Bitcoin SV (BSV) Struggles: Locked in a Trading Range, Eyes on Key Resistance Levels
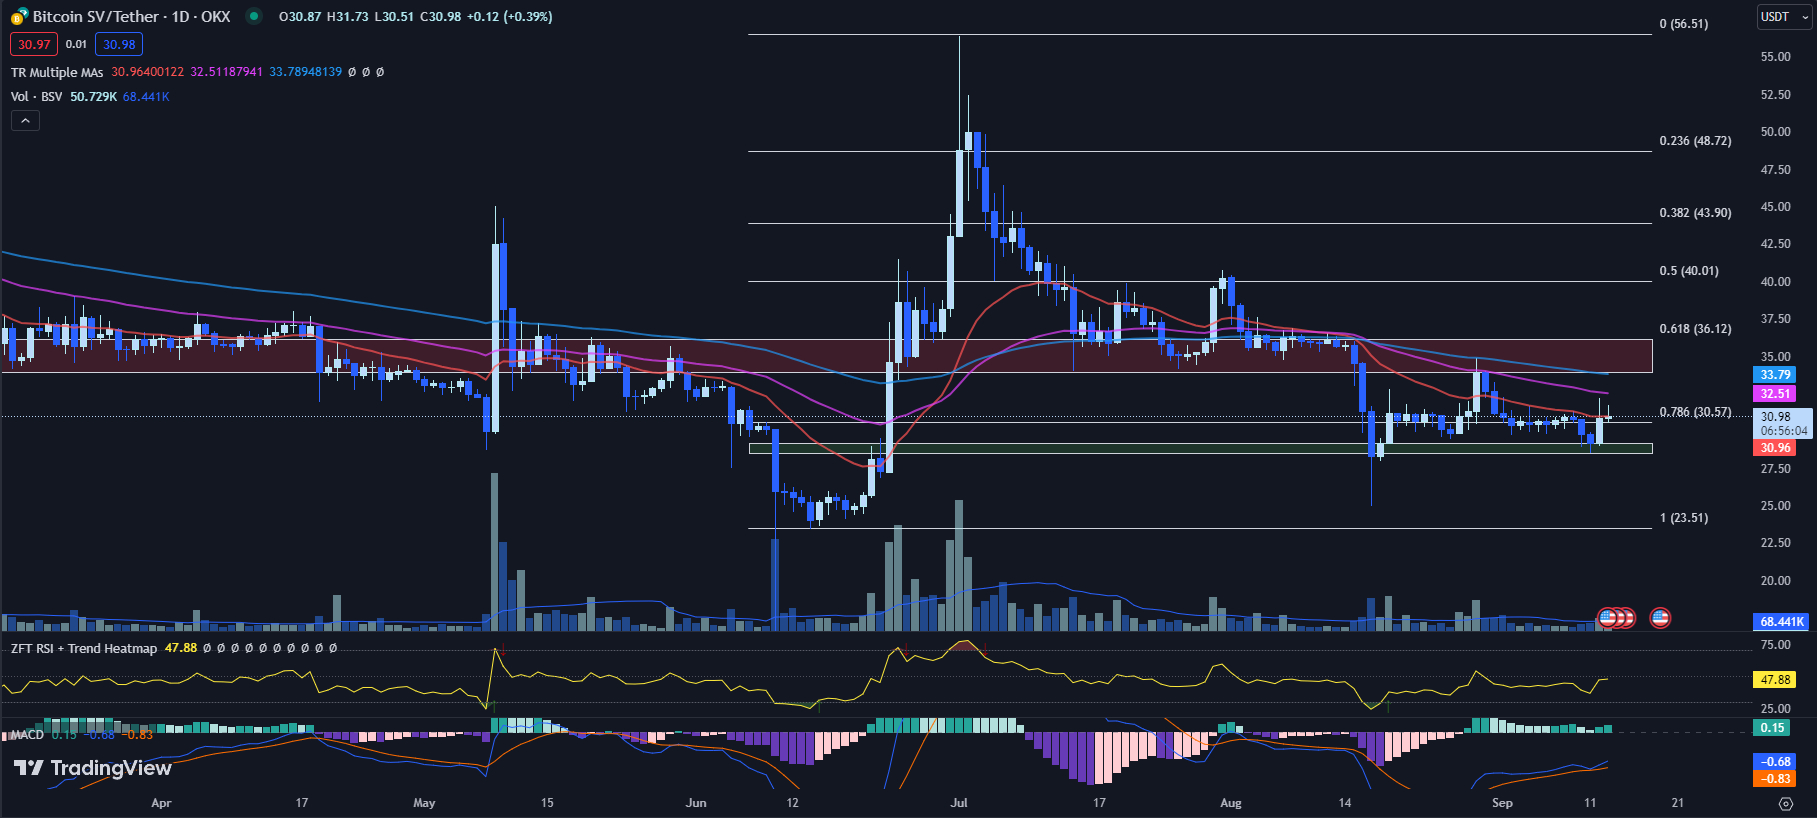
Bitcoin SV (BSV) has been locked in a narrow trading range, tethered around the Fib 0.786 level of $30.57 for the past 27 days. BSV attempted a rally earlier today where at one point it was trading higher than the 20-day EMA to set an intraday high at $31.73.
However, the resistance at this level proved too strong, pushing BSV back down to its current price of $30.98, representing a modest 0.39% gain so far today.
The 20-day EMA, currently at $30.96, proved to be a significant barrier for BSV. Despite today’s surge that momentarily breached this line, the pullback to just above this level indicates the presence of significant selling pressure.
To confirm any bullish trend, BSV would need to convincingly break and maintain above this EMA.
The 50-day EMA at $32.51 presents the next resistance line, a price level from which BSV was previously rejected on August 30. A break above this level would suggest a stronger bullish momentum.
The 100-day EMA, sitting at $33.79, provides a longer-term perspective and would be the next target if BSV embarks on a sustained rally.
Meanwhile, BSV’s RSI has dropped to 44.78 from yesterday’s 47.22. This indicates a growing bearish momentum and suggests that sellers currently have more influence over the price action.
Concurrently, the MACD histogram currently stands at 0.15, slightly up from yesterday’s 0.10, suggesting a slightly growing bullish momentum.
On the downside, immediate support lies at the Fib 0.786 level of $30.57. If this level is breached, the next horizontal support zone lies between $28.51 and $29.16.
While Bitcoin SV has shown signs of life with today’s slight gain and MACD histogram increment, the failure to sustain above the 20-day EMA and the decreasing RSI point toward a bearish bias in the short term.
Traders should watch for a potential break of the immediate support level at the Fib 0.786 mark. A confirmed break above the 20-day EMA, on the other hand, could indicate a short-term bullish reversal.
Disclaimer: Crypto is a high-risk asset class. This article is provided for informational purposes and does not constitute investment advice. You could lose all of your capital.