Best Crypto to Buy Now 10 August – Aptos, Rocket Pool, Maker


U.S. inflation metrics saw a notable rise recently, with the Consumer Price Index (CPI) experiencing a 3.2% increase over the past year leading up to July.
Despite the financial development indicated by this data released by the Bureau of Labor Statistics (BLS) on Thursday, the performance of Bitcoin and Ethereum has been relatively lackluster, with both showing a modest decline of 0.27% and 0.22%, respectively.
In light of this, what are the best cryptos to buy now?
BREAKING: July CPI inflation data shows US inflation rate RISES to 3.2%, below expectations of 3.3%.
— The Kobeissi Letter (@KobeissiLetter) August 10, 2023
Core CPI inflation is now at 4.7%, below expectations of 4.8%.
This is the first monthly increase in CPI inflation since July 2022.
The Fed's job just got a lot harder.
July’s CPI figures represent a slight bounce from June’s when inflation was documented at 3%.
Monthly data shows a 0.2% consumer price rise in July, mirroring the previous month’s increment.
Home prices played a significant role in this trend, accounting for a 0.4% rise which made up 90% of the entire monthly CPI surge.
While traditional markets monitor these numbers with keen interest, major cryptocurrencies such as Bitcoin and Ethereum appeared indifferent to the recent report from the U.S. Bureau of Labor Statistics.
Their values remained around $29,400 and $1,850 respectively, according to CoinMarketCap.
The Federal Reserve is in the process of strategizing how best to tackle the prevailing inflation without thrusting the economy into recession.
This month’s CPI data will certainly be a talking point during the Federal Open Market Committee’s upcoming September session.
In response to rising prices, the U.S. central bank has raised interest rates to deter borrowing. Such adjustments influence both the cryptocurrency and stock sectors.
When interest rates climb, investors often turn their focus to U.S. Treasury bonds and cash reserves, which tend to offer higher yields in such scenarios.
Beginning its anti-inflation efforts 18 months ago, the Federal Reserve embarked on an interest rate hiking journey from near-zero levels.
The institution’s goal is a 2% inflation rate, which Chairman Powell hopes to reach by 2025, if not sooner.
1/1 U.S. gasoline demand rises 1.1% WoW, per @GasBuddy, quelling some demand drop fears. Gas prices continue their ascent with the national average at $3.825/gal, up from $3.538 last month, says AAA. https://t.co/0I972EGYmE
— U.S. Global Investors (@USFunds) August 10, 2023
One factor that could shape future CPI figures is the surge in energy costs. The U.S. national average for a gallon of gasoline hit $3.82, marking a 7% rise from the previous month’s $3.53, as per AAA data.
This spike is attributed to the combination of increased temperatures and reduced oil output.
Reflecting on the Fed’s recent decision, last month observed a 25 basis point rate enhancement, placing the benchmark interest rate at its highest in over two decades.
Chairman Powell emphasized that subsequent rate decisions would be assessed on an individual basis.
Upon excluding volatile components like food and energy, core inflation displayed a 4.7% annual rise up to July, dipping slightly from June’s 4.8%.
This core CPI is highly regarded by the Federal Reserve as it gives a clearer inflation trajectory.
Another key metric under the Fed’s scrutiny is the Personal Consumption Index, slated for release on August 31.
Anticipating future moves, traders, based on CME Group’s FedWatch Tool, predict the Fed to maintain the current interest rates at least until January 2024.
As for the imminent September session, there’s an 88.5% likelihood that rates will remain unchanged.
While leading cryptocurrencies show a limited response to current inflation numbers, Aptos, yPredict, Rocket Pool, Launchpad XYZ, and Maker stand out as some of the best cryptos to buy now due to their strong fundamentals and/or promising technical analysis.
Aptos (APT): Navigating Complex Technical Indicators
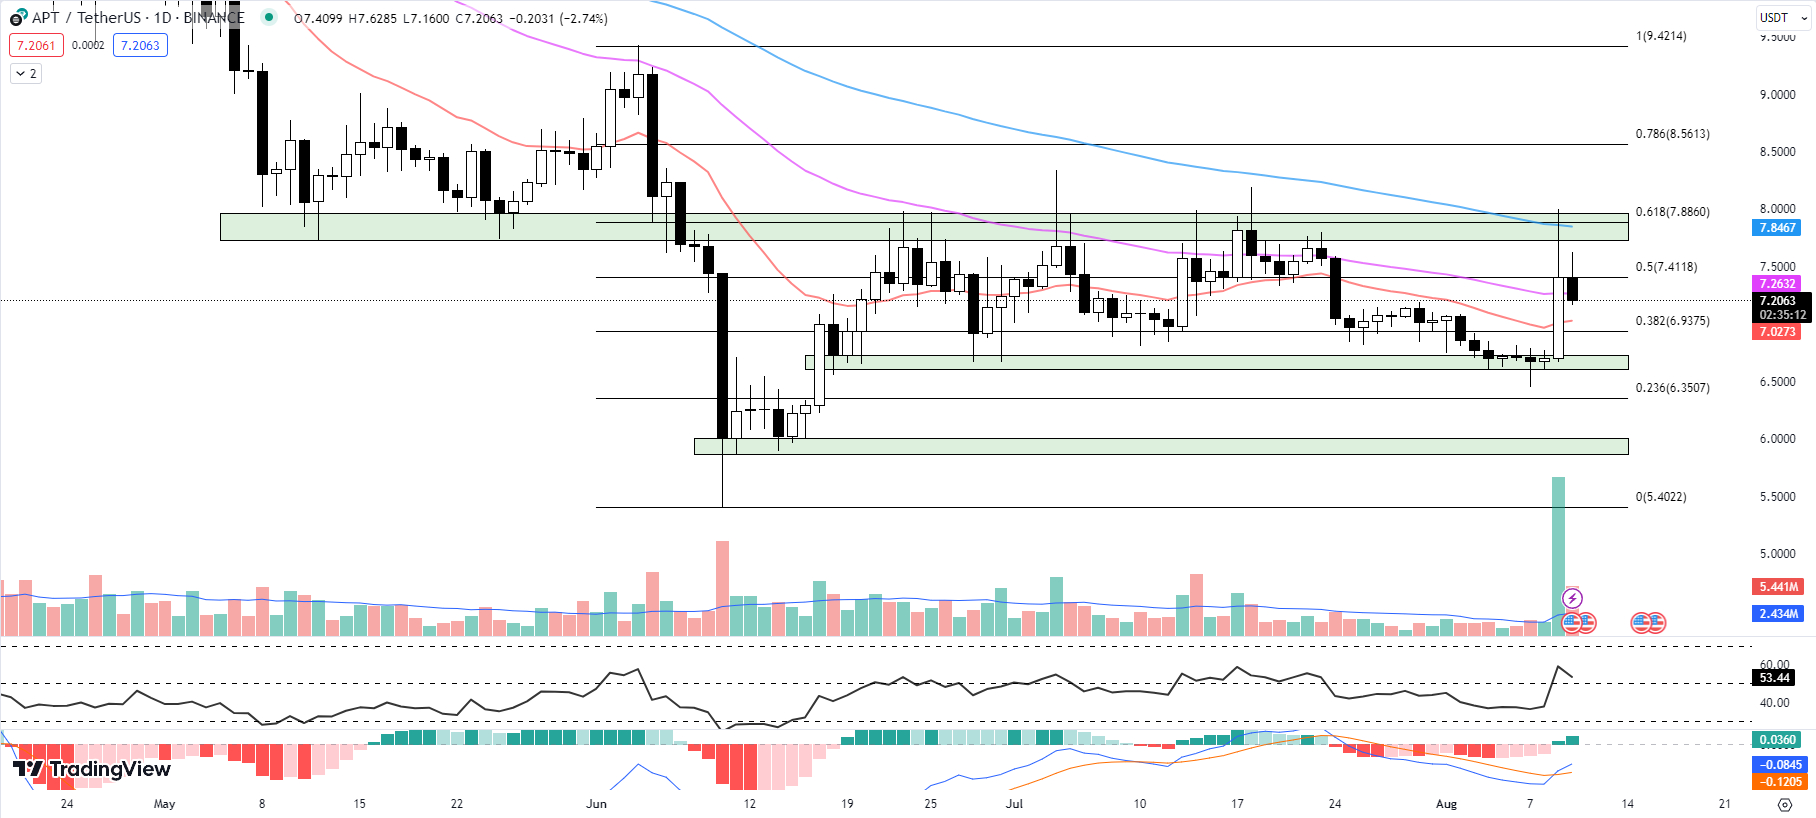
Aptos (APT) experienced a robust 10.52% upside move yesterday, bouncing off its horizontal support zone of $6.6082 to $6.7296.
However, the story is far from complete. A deeper look at the technical indicators uncovers a complex situation where traders need to tread carefully.
Starting with the Exponential Moving Averages (EMA), APT is currently sandwiched between the 20-day EMA at $7.0273 and the 50-day EMA at $7.2632.
The recent inability to hold an intraday high above the triple confluence of resistances at the Fib 0.618 level ($7.8860), 100-day EMA ($7.8597), and horizontal resistance zone ($7.3332 to $7.9687) indicates a critical resistance point for APT.
The RSI stands at 53.44, down from 59.17 yesterday. This reduction in RSI may signal a loss of momentum, corroborated by the MACD histogram’s moderate rise to 0.0360 from yesterday’s 0.0154.
Although the uptrend is still intact, these indicators suggest a potential slowdown or consolidation phase.
Volume and Market Cap dynamics further hint at an uncertain path ahead. The market cap is down by 1.33% to $1.59 billion, and a substantial 39.43% decrease in 24-hour volume to $373 million could be an alarming sign for the bulls.
Currently priced at $7.2063 and moving down by 2.74% so far today, APT is testing the nerves of traders.
Immediate resistance lies at the 50-day EMA of $7.2632, with a further Fib 0.5 level at $7.4118. Traders should watch these levels closely; a close below the 50-day EMA today might indicate a short-term bearish sentiment.
On the flip side, immediate support at the 20-day EMA at $7.0273 and the Fib 0.382 level at $6.9375 offers some comfort for the bulls.
Should the price hold above these levels, it could set the stage for another attempt at breaking the resistance above.
Aptos (APT) is at a critical junction. Both bullish and bearish scenarios have their arguments based on technical indicators.
Traders should remain vigilant, consider tightening stop losses, and look for confirmation through price actions in the immediate resistance and support levels. A break above or below these key indicators may provide the directional cue needed for the next significant move.
yPredict: One of the Best Cryptos to Buy Now for Its AI-Powered Crypto Trading Insights
The dynamic nature of the cryptocurrency market has created an unprecedented need for dependable trading tools.
Traders, faced with the highly volatile nature of cryptocurrencies, are increasingly seeking valuable information to aid their decision-making process.
This is exemplified by the achievement of yPredict. This AI-powered crypto platform has raised over $3.4 million during its presale, highlighting the rising demand for data-driven platforms in the trading industry.
🔍 Unraveling Token Allocations & Project Commitment: The #yPredict Insight 💡🚀
— yPredict.ai (@yPredict_ai) August 9, 2023
Diving into the dynamic world of blockchain and crypto, yPredict's unique tokenomics and ethos recently took the spotlight. Let's navigate through this captivating journey! 🧵
🔑 The Token Story:… pic.twitter.com/9CfnT5BpDT
Built to connect traders to nuanced crypto market patterns, yPredict will employ a suite of AI-driven analytical tools.
Their objective? Sifting through the abundant market data to uncover consistent patterns, offers traders an analytical advantage.
The platform will auto-identify more than 100 chart configurations across varied timelines, assigning each a confidence score rooted in past outcomes.
But it doesn’t stop there. With its sentiment analysis capabilities, yPredict will process news headlines and crypto-centric social media discussions.
This results in positive, negative, or neutral sentiment scores, providing traders with a window into potential market momentum.
Equipped with the capability to evaluate multiple technical indicators based on recent historical data, yPredict’s goal is to give traders a rounded market view.
This holistic approach factors in fundamental, technical, and sentiment data to pinpoint repetitive patterns, enhancing the probability of strategic crypto trading.
Integral to the platform is its utility token, YPRED. This token will grant access to yPredict’s analytical arsenal.
Unlike standard staking perks, yPredict’s staking rewards will correlate with the influx of new platform users, potentially increasing up to 45%.
Venturing beyond analytics, yPredict’s Marketplace will serve as a nexus for adept developers and traders.
Here, financial data mavens can monetize their quantitative models, while traders explore algorithmic trading strategies fitting their risk profiles.
yPredict will retain 20% from each subscription, distributing half of it among YPRED token stakers, with the balance benefiting the model creators.
Other offerings from yPredict include their Analytics and Market Predictions platforms.
While the former focuses on pattern identification, sentiment evaluation, and transaction scrutiny, the latter will offer free price projections for varied crypto assets.
yPredict represents a major advancement in AI-driven fintech platforms, striving to democratize algorithmic trading insights.
By combining financial analysis, NLP, and machine learning, yPredict has the potential to fuel further growth in the fintech industry.
The platform’s mission to provide reliable signals to a wide audience reflects the larger trend of responsible involvement in the cryptocurrency industry.
Rocket Pool (RPL): Bullish Momentum Building Up
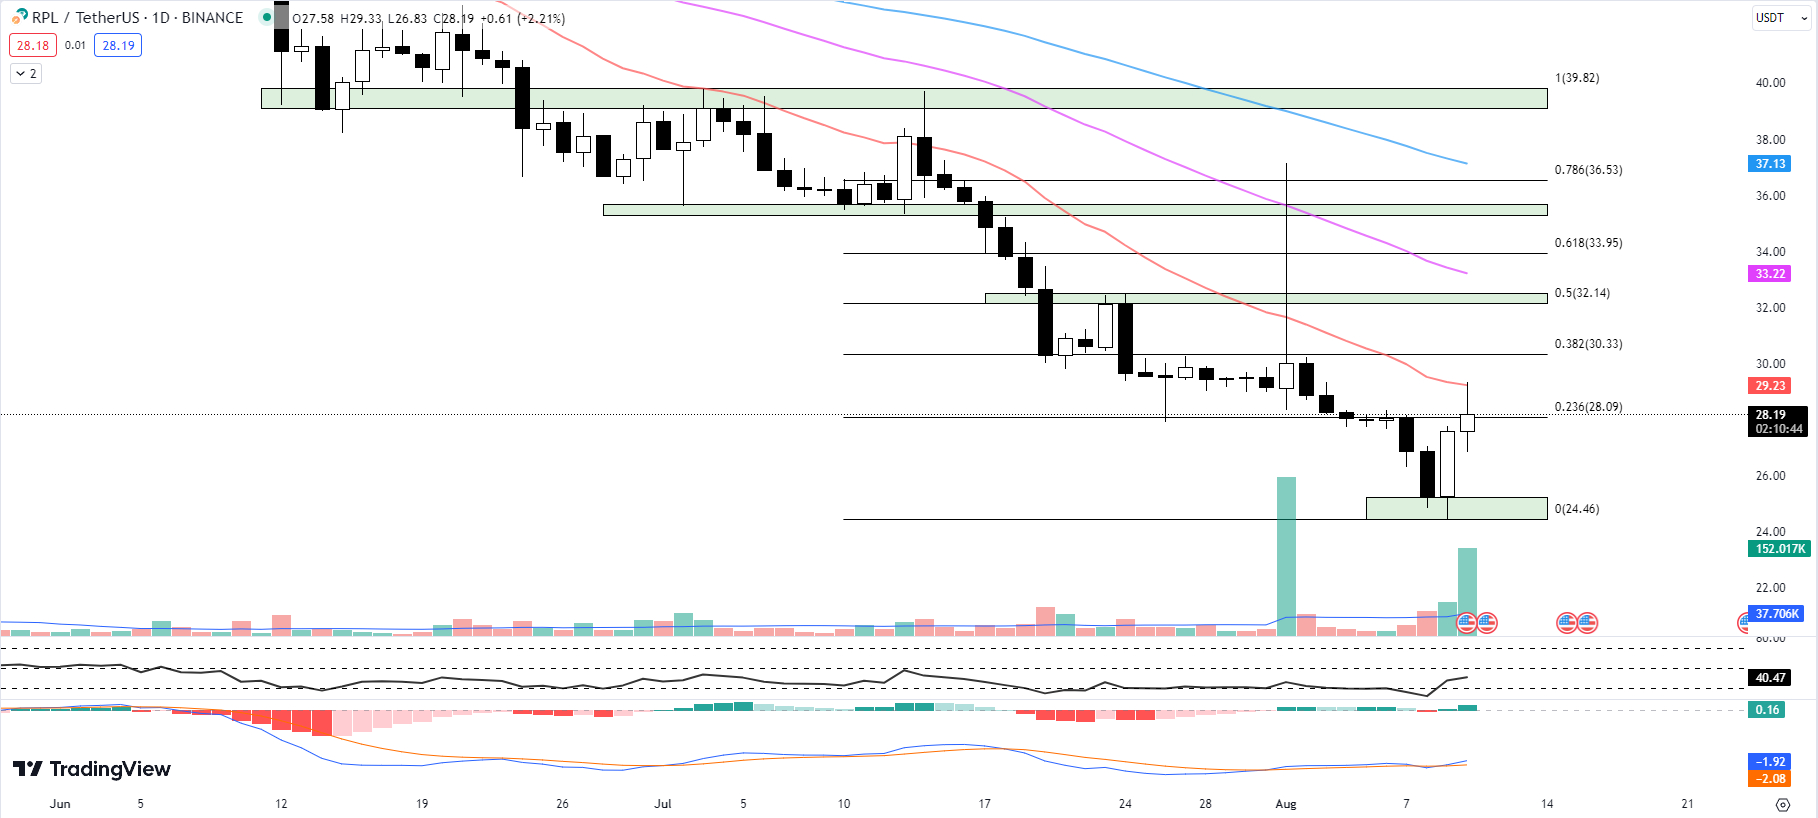
Rocket Pool (RPL) has been showing signs of potential recovery after yesterday’s significant 9.23% move to the upside.
RPL, which found support at its swing low of $24.46 and bounced back to $27.58, is currently trading at a higher value of $28.19, marking a 2.21% increase so far today.
This upward price movement indicates that RPL is attempting to surmount the Fib 0.236 resistance level of $28.09.
The primary technical indicators suggest a mixed picture but with a slight bias towards a bullish scenario.
The 20-day EMA stands at $29.23, while the 50-day EMA is at $33.22, and the 100-day EMA is at $37.13. The fact that the current price is below these averages might suggest that RPL is still in an overall bearish trend.
Meanwhile, the RSI has risen to 40.47 from yesterday’s 37.12. This rise in RSI signals increasing bullish momentum.
A value below 30 is typically considered oversold, while above 70 is overbought. At 40.47, RPL is closer to the oversold territory, suggesting potential upward pressure.
The MACD shows a positive histogram value of 0.16, up from yesterday’s 0.04, indicating buying pressure and a potential bullish crossover.
Adding weight to this bullish scenario is the rise in both market cap and 24-hour trading volume.
The market cap of RPL has risen by 6.07% to $553 million, and the 24-hour trading volume has surged by a striking 86.31% to $17.4 million.
This increase in trading volume often precedes a price change, hinting at further upward movement.
Despite these bullish signals, traders should also be aware of the immediate resistance and support levels.
The immediate resistance for RPL is the 20-day EMA at $29.23, followed by the Fib 0.382 level at $30.33.
The immediate support, on the other hand, is the Fib 0.236 level at $28.09, which RPL is currently trying to surpass.
Although the EMAs suggest a bearish trend, the rising RSI, positive MACD histogram, and increased trading volume hint at a potential bullish reversal.
Traders should watch these indicators closely and react accordingly, bearing in mind the immediate resistance and support levels.
Launchpad XYZ: Empowering Traders With a Comprehensive WEB3 Ecosystem
Launchpad XYZ has begun developing a community-driven ecosystem that is intended to support users in comprehending the web3 digital trading environments.
The company’s website highlights its commitment to offering a wide array of tools and educational resources tailored to meet the needs of both beginners and seasoned cryptocurrency traders.
Break free from traditional financial constraints
— Launchpad.xyz (@launchpadlpx) August 10, 2023
With #LaunchpadXYZ, you're at the helm of your financial journey 🔥
Time to take control
👉https://t.co/6qHqqRBG7F
#Web3 #LaunchpadKnows #Trade #Alts pic.twitter.com/s9kgJPNke8
The platform will offer an array of features for its users. A custom artificial intelligence (AI) assistant called Apollo, for instance, is designed to analyze digital assets and transform data into insights for investment decisions.
Additionally, the company is developing a ranking system called the Launchpad Quotient, which will leverage over 400 data points, including social, financial, and market data.
By providing users with a comprehensive confidence and trust ranking system, this platform will enable individuals to navigate the dynamic cryptocurrency market with confidence and make well-informed investment decisions.
The start-up announced its early successes on its Telegram channel, citing a substantial increase in the signals it has provided for free. This includes trading signals and daily market news updates.
Launchpad XYZ also plans to offer a trading terminal that will route all trades via the company’s decentralized digital assets exchange.
“We’ll focus on attracting market-leading liquidity providers to ensure your trades complete fully on the Launchpad,” stated the company on its website.
Launchpad XYZ is committed to transforming the way people engage with cryptocurrencies, going beyond traditional trading platforms.
It envisions an all-in-one hub that intends to build a humanized, curated portal for accessing the best projects in the blockchain space.
This includes services related to non-fungible tokens (NFTs) and play-to-earn games.
An unbiased window into the latest offerings in web3 is on the agenda, with features like peer-to-peer (P2P) NFT exchange and a proprietary web3 wallet.
To facilitate its web3 platform development, Launchpad XYZ is conducting a presale of its native $LPX token, which has already raised over $1.25 million so far in its second stage.
Major crypto news and analysis websites such as Cryptonews.com, CryptoPotato, and Cointelegraph have mentioned Launchpad XYZ in discussions about top crypto presales this year.
The initiative plans to be a bridge between Web2 and Web3, focusing on “helping brands to onboard the next 10 million Web3 users,” according to the project’s statement.
As the company prepares for its decentralized exchange listing in the third quarter of 2023, its services, AI technology, and educational offerings are being closely watched by industry insiders and potential users alike.
MKR’s Bull Run: Technical Indicators Point to Continued Upside
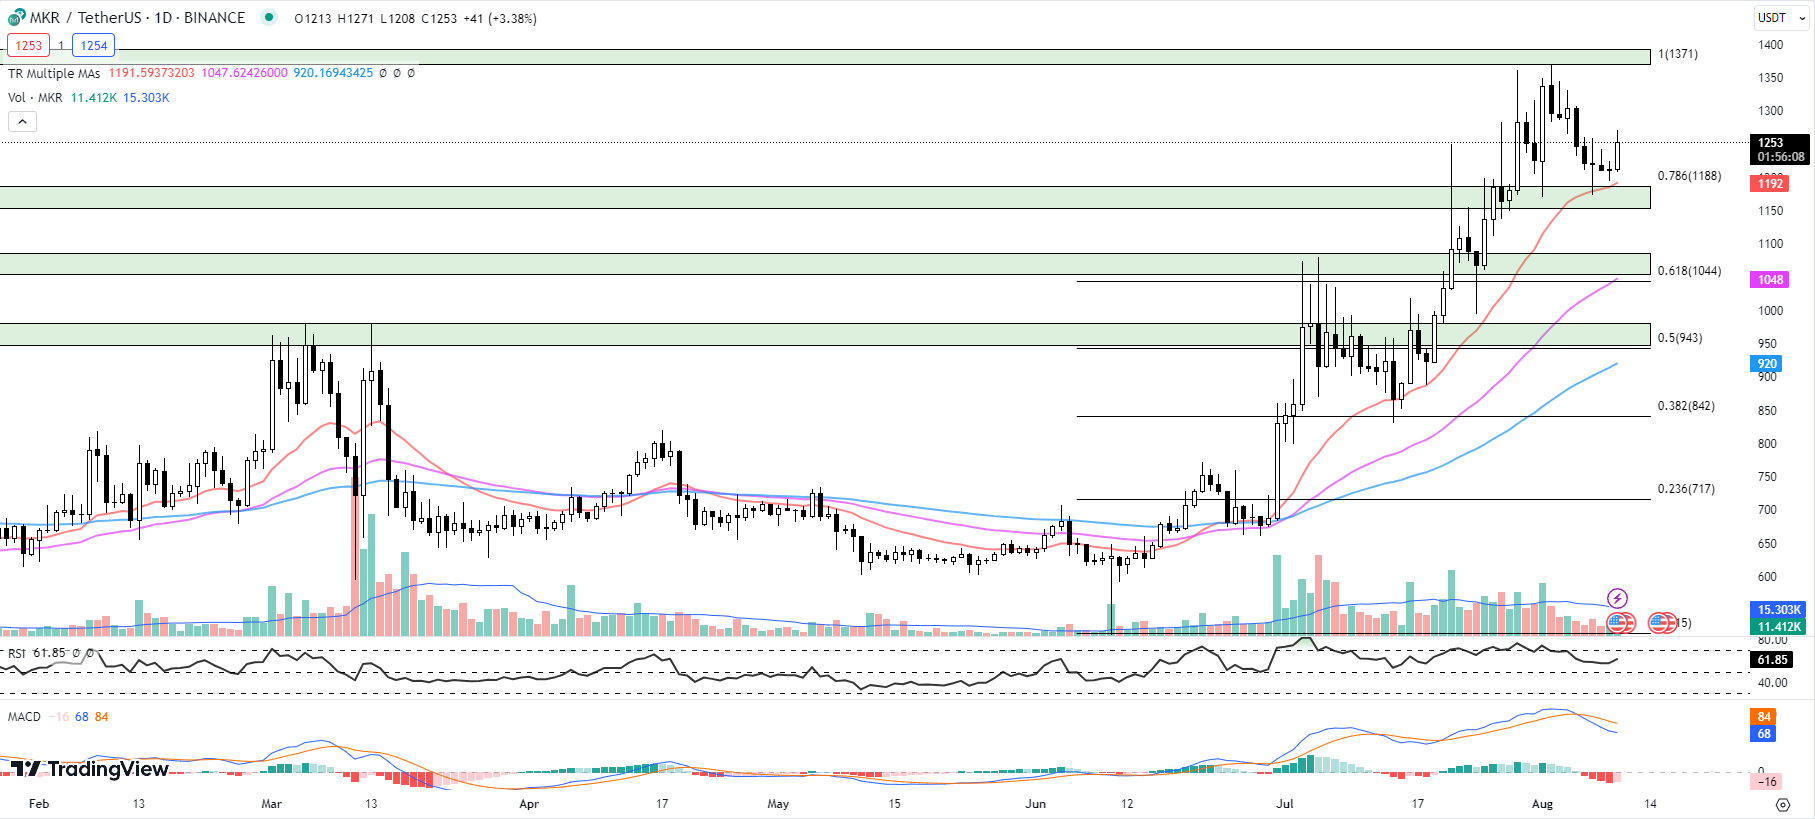
Technical indicators for Maker (MKR) indicate a possible continuation of the bullish trend.
After 7 days of retracement, the cryptocurrency is now showing its first significant upward movement as it trades at $1,253, reflecting a 3.38% increase so far today.
The current price has not exceeded the 20-day average, which stands at $1,192, indicating a sustained short-term positive sentiment.
Meanwhile, the 50-day and 100-day Exponential Moving Averages (EMAs) are notably lower, at $1,048 and $920 respectively, pointing to a bullish trend over the longer term.
The RSI stands at 61.85, a rise from yesterday’s 58.01 level. This measure gauges the speed and change of price movements, with a reading above 50 typically interpreted as a bullish signal.
However, as MKR approaches the 70 levels, the asset may be considered overbought, which could trigger a period of selling pressure.
Traders should keep an eye on this indicator for any further downward shifts that might signal a short-term price reversal.
Looking at potential barriers, MKR faces a horizontal resistance zone of $1,371 to $1,393, a level that has not been seen since May 2022.
This could be the next significant test for the bullish trend. If the price can break through this resistance with substantial volume, it could pave the way for further gains.
On the downside, there is a triple confluence of support at the Fib 0.786 level at $1,188, along with the 20-day EMA at $1,192 and a horizontal support zone of $1,153 to $1,187.
This strong support zone may ward off any significant price declines in the near term.
The current technical indicators for MKR suggest a potential continuation of the bullish trend, but traders should remain vigilant of the key resistance and support levels.
Disclaimer: Crypto is a high-risk asset class. This article is provided for informational purposes and does not constitute investment advice. You could lose all of your capital.