
Why BCH and BSV Halving Data Is a Poor Indicator for Bitcoin Forecasts


Johnson Xu is the Chief Analyst at TokenInsight, a token data and rating agency.
_____

We are moving ever closer to Bitcoin (BTC)’s third halving, while the coronavirus pandemic continues to disrupt the global economy, creating a ripple effect across the global financial market.
The forthcoming halving, coupled with weak bitcoin prices, is forcing the network to undergo an unprecedented cleanse to rebalance – and become a more efficient and healthy network.
Network hash rate reduction has traditionally been seen as a negative indicator that reflects weakness in network security. However, this is not always the case, as sometimes a healthy correction is needed – in order to reset the network and reduce wasteful mining.
The forthcoming halving event is putting SHA-256 miners under significant pressure, as it now looks as though the Bitcoin network will undergo its next major event in less than 30 days’ time.
Bitcoin cash (BCH) and bitcoin SV (BSV) underwent their own network halving events on April 8 and 10 respectively, reducing block rewards from 12.5 to 6.25.
As such, it could be worth taking a closer look at the BCH and BSV markets before and after the halving events – to see if they can shed some light on the matter of block reward halving.
Hashrate and prices
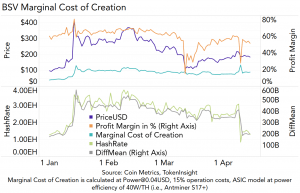
The prices of both BCH and BSV remained within a stable range, both prior to the halving and post-halving.
Both chains’ network hashrates dropped from 3-4 exahash per second (EH/s) to below 1EH/S at its lowest point. Thanks to BCH and BSV’s difficulty adjustment algorithms, the network did not experience a prolonged spike in block time.
The overall hashrates returned to a state of equilibrium and are currently hovering around 2EH/S and 1.5EH/S for BCH and BSV respectively.
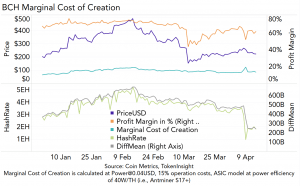
The marginal cost of creation for both BCH and BSV has remained within a relatively constant range, except during the halving days themselves, where we saw an uptick in the marginal cost of creation at a point when both networks experienced major disruption.
The marginal cost of the creation of 1 unit of each respective coin was calculated, serving as a benchmark to understand how healthy a miner’s profit margin is. The healthier the miner’s profit margin, the lower miner selling pressure becomes – as miners try to recoup the costs of generating blocks.
__
__
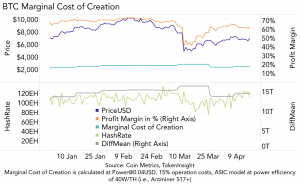
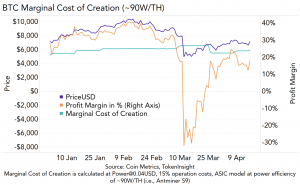
As we head toward the third Bitcoin halving event, we expect the Bitcoin network to experience a significant reduction in network hashrate, effectively rendering the entire previous generation of SHA-256 ASICs, such as Antminer S9s, obsolete immediately after the halving.
This will likely happen due to the significant increase in the cost of creation based on current network difficulty and bitcoin prices.
There is only a 20% profit margin for miners who are running S9s at present with USD 0.04/kW and 15% operation costs. Unless miners can make use of USD0.02/kW electricity prices, which are extremely difficult to find, we believe the majority of S9s will indeed become obsolete.
As such, these devices will exit the Bitcoin network permanently within one to three months after halving takes place.
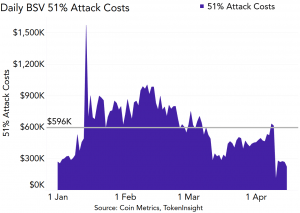
The cost for a consistent 24-hour 51% attack also decreased significantly on both networks, showing its weakest sign for both chains year-to-date (YTD). As such, it would be practically plausible to perform a 51% attack on either the BCH or the BSV chain.
__
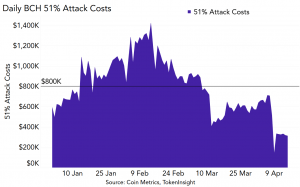
The theoretical 51% attack costs for both the BCH and BSV chains have reverted to January 2020 levels, and more than halved compared to current YTD averages.
As the respective network hashrates of BCH (2EH/s) and BSV (1.5EH/s) account for only a small fraction of the Bitcoin total network hashrate (100EH/s), it would now be easier than ever to perform a 51% attack on either chain by simply diverting sufficient hashrate from the Bitcoin network.
Daily MRIs tell a vastly different story
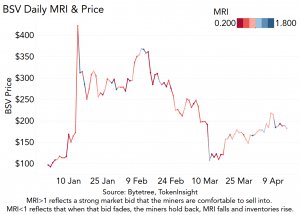
Comparing the three chains’ Miner’s Rolling Inventories (MRIs) and prices, we can see that in terms of YTD, miners are generally not comfortable selling into the BSV market – as indicated by the number of red data points on the diagram.
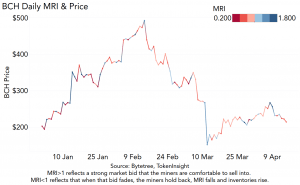
This possibly indicates miners adopting a “bearish” stance on the BSV market. The BCH market is better positioned than the BSV market from miners’ perspectives, as the amount of blue and red are more evenly balanced when compared to the current BSV market.
__
__
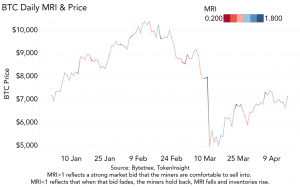
The BTC market appears to be the healthiest of the three chains from a miners’ viewpoint, with a good balance of comfortable selling onto the market (see the blueish data points) and holding back on inventory (reddish data points) based on actual market conditions.
Moreover, it is also leaning further toward a neutral perspective with fewer extreme values (indicated by darker areas) than BCH and BSV figures.
MRI merely serves as one of many market indicators, however. In fact, it may not be effective when evaluating BCH and BSV chains due to (the possibly highly manipulative) nature of the BCH and BSV markets, liquidity and other related issues.
Brace for volatilty
Due to the relative insignificance of the BCH and BSV network when compared to the BTC network, we believe that the recent BCH and BSV halving events cannot serve as a benchmark for BTC’s own forthcoming event.
Instead, it would be much more telling to look at a variety of other indicators, metrics and analysis in order to form a more comprehensive overview of the market.
As we move closer to the third Bitcoin halving event, market volatility is expected in the near future while the Bitcoin network experiences major disruption in the short term. But this should then be followed by a period of self-adjustment, as it reaches a more balanced state post-halving – and ultimately resulting in a more efficient blockchain network.
- Elon Musk Grok AI Predicts Shocking XRP Price in The Next 28 Days
- This ChatGPT AI XRP Price Prediction Should Not Make Sense But It Does
- Elon Musk Accepts Dogecoin for SpaceX Payments as DOGE Stalls Ahead of Historic IPO
- Nobody Wants To Admit Google Gemini AI Might Be Right About XRP Price Prediction
- XRP News: David Schwartz Just Said XRP Is Becoming a Settlement Layer for Stocks and Loans, Is the Infrastructure Actually Ready?
2M+
250+
8
70


- Elon Musk Grok AI Predicts Shocking XRP Price in The Next 28 Days
- This ChatGPT AI XRP Price Prediction Should Not Make Sense But It Does
- Elon Musk Accepts Dogecoin for SpaceX Payments as DOGE Stalls Ahead of Historic IPO
- Nobody Wants To Admit Google Gemini AI Might Be Right About XRP Price Prediction
- XRP News: David Schwartz Just Said XRP Is Becoming a Settlement Layer for Stocks and Loans, Is the Infrastructure Actually Ready?
More Articles

