Bitcoin Price Prediction as US CPI Data is Released – Time to Buy the Dip?


Amidst the release of the Consumer Price Index (CPI) data for August, the Bitcoin price prediction landscape is under scrutiny, prompting a critical question: Is it opportune to consider buying the dip?
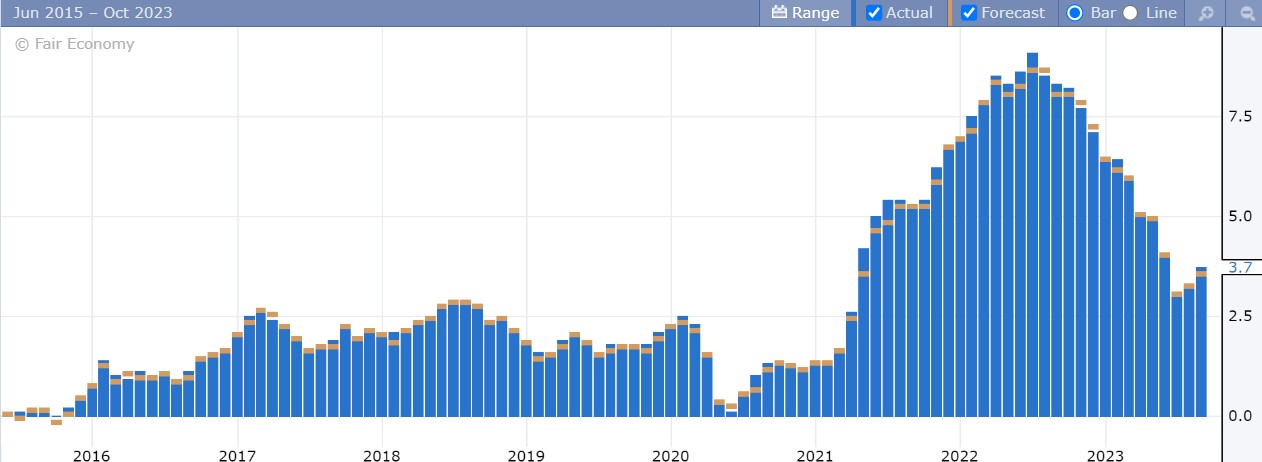
In the latest CPI report, August witnessed a 0.6% increase, aligning precisely with economists’ expectations and marking a notable upswing from July’s 0.2% figure.
On a year-over-year basis, CPI inflation rose to 3.7%, surpassing forecasts that had anticipated 3.6%, and marking a notable increase from the previous month’s 3.2%.
Meanwhile, the core CPI, a metric that excludes food and energy costs, recorded a 0.3% rise, exceeding economist projections of 0.2% and surpassing the prior month’s 0.2% figure.
Nevertheless, the year-over-year view of core CPI witnessed a decline to 4.3%, aligning with economist forecasts and retreating from July’s 4.7%.
These developments in the CPI data form the backdrop against which Bitcoin’s price dynamics are assessed, leading to speculations about the potential wisdom of entering the market amidst these economic shifts.
*US CPI INFLATION Y/Y OVER THE LAST 12 MONTHS:
— Investing.com (@Investingcom) September 13, 2023
*AUG. 2022 +8.3%
*SEPT. +8.2%
*OCT. +7.7%
*NOV. +7.1%
*DEC. +6.5%
*JAN. 2023 +6.4%
*FEB. +6.0%
*MARCH +5.0%
*APRIL +4.9%
*MAY +4.0%
*JUNE +3.0%
*JULY +3.2%
*AUG. +3.7%
🇺🇸 🇺🇸 pic.twitter.com/R07AKf6tbX
Historically, Bitcoin has often been considered a hedge against inflation.
When traditional fiat currencies weaken due to rising inflation, investors often turn to assets like Bitcoin, which are perceived as stores of value.
Bitcoin Price Prediction
Bitcoin‘s technical data shows a robust upward trend, particularly breaking past the key $25,900 mark.
Although this threshold was a consistent challenge in the past, Bitcoin surged beyond it, peaking at $26,500.
This new peak now stands as a challenging double top. After this rise, Bitcoin struggled to stay above $26,500, settling just under $26,000. Now, $25,900 acts as a support level.
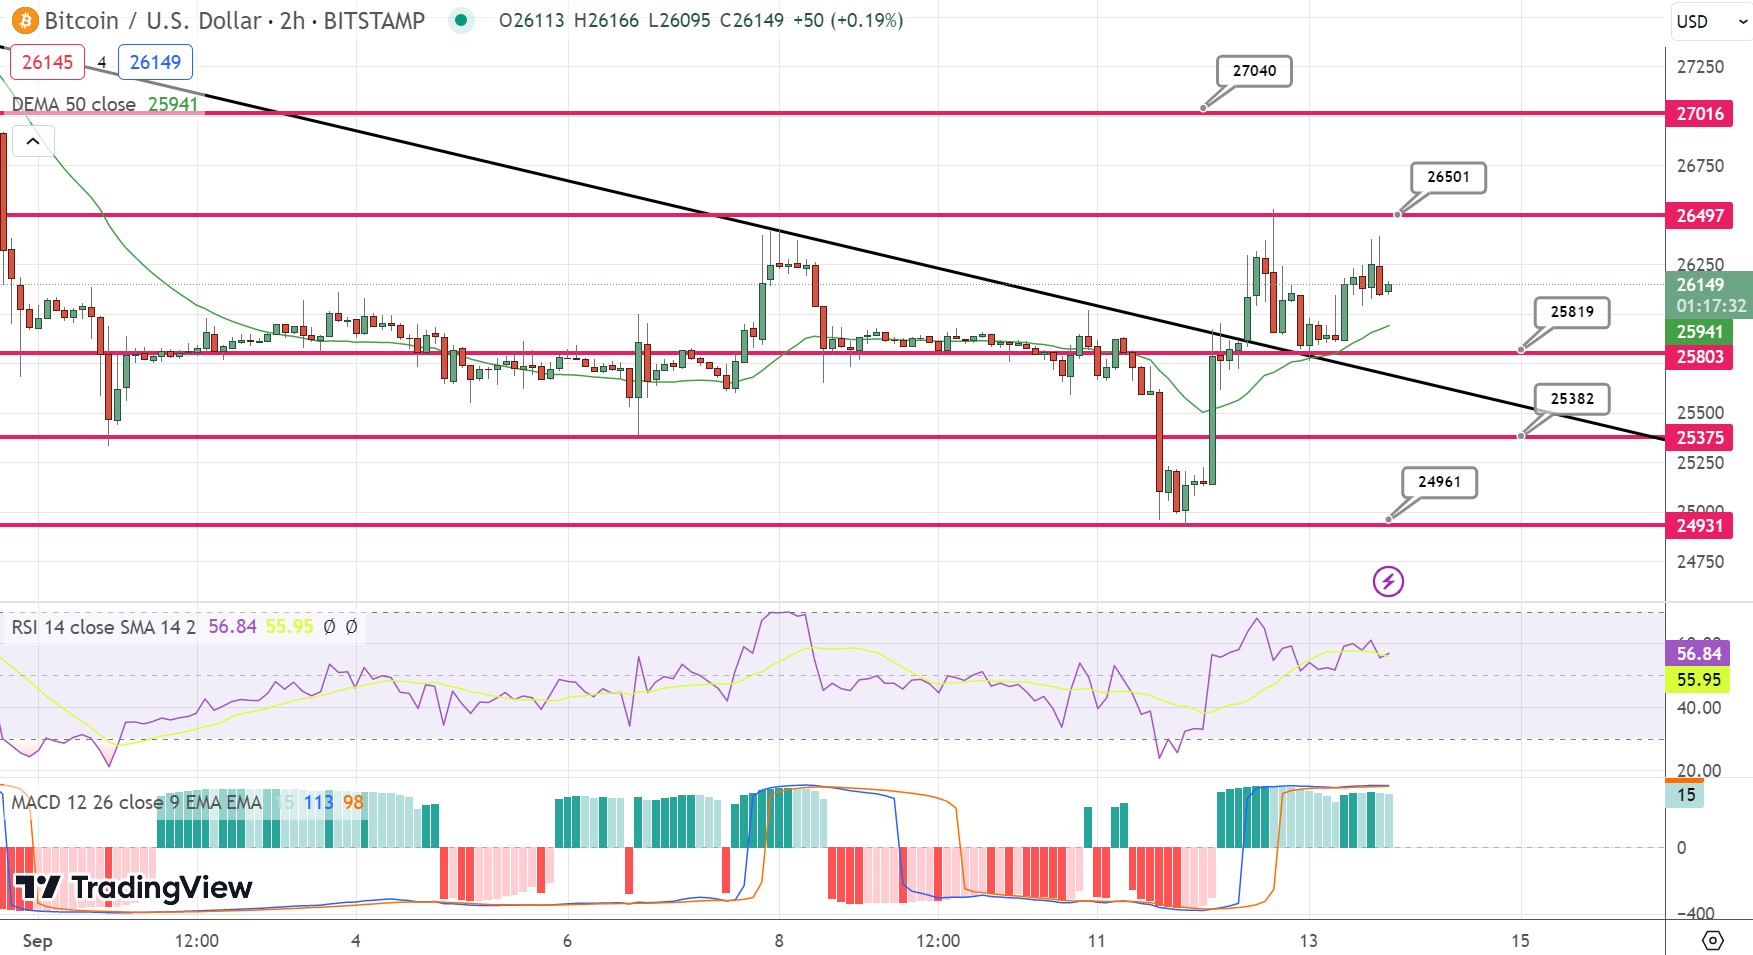
Bullish signs are evident from key metrics like the RSI and MACD, with the 50-day exponential moving average suggesting continued growth, provided Bitcoin stays over $25,600.
Falling beneath this could risk descending to $25,400 or even $24,950. If Bitcoin clears $26,500, it might aim for $27,000 or $27,500.
Essentially, the $26,500 mark is crucial: below it might indicate a bearish shift, while above it suggests ongoing bullish momentum.
Top 15 Cryptocurrencies to Watch in 2023
To stay at the forefront of the digital asset landscape, consider exploring our curated list of the top 15 alternative cryptocurrencies and ICO projects to watch in 2023.
This compilation is a collaborative effort between experts at Industry Talk and Cryptonews, offering you expert advice and insightful perspectives to guide your cryptocurrency investment decisions.
Keep abreast of the latest trends and uncover the potential of these digital assets.
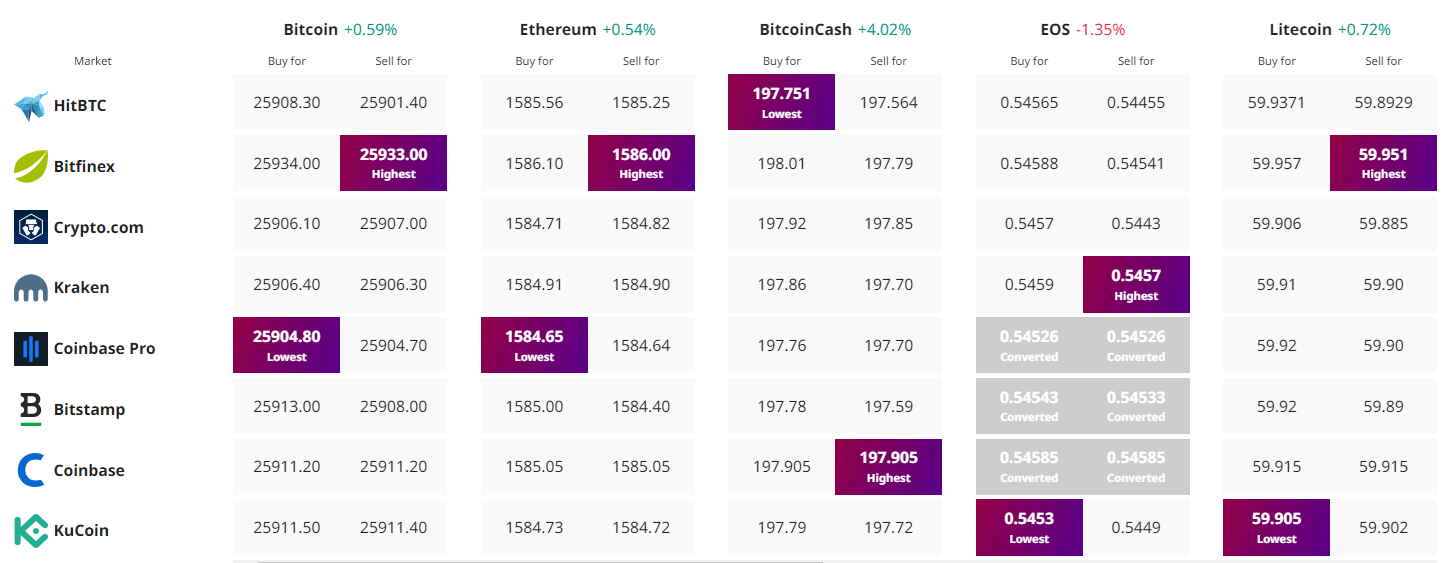
Find The Best Price to Buy/Sell Cryptocurrency
Disclaimer: Cryptocurrency projects endorsed in this article are not the financial advice of the publishing author or publication – cryptocurrencies are highly volatile investments with considerable risk, always do your own research.