Best Crypto to Buy Now in July 2026 – Top Crypto to Invest In
We believe in full transparency with our readers. Some of our content includes affiliate links, and we may earn a commission through these partnerships. However, this potential compensation never influences our analysis, opinions, or reviews. Our editorial content is created independently of our marketing partnerships, and our ratings are based solely on our established evaluation criteria. Read More


Crypto markets are at an inflection point in mid-2026. Bitcoin has consolidated below its all-time high, yet institutional inflows via ETFs remain structurally positive, and Ethereum’s Pectra and Glamsterdam upgrades are actively reshaping its throughput. For investors entering now, the key question isn’t whether to buy crypto; it’s which assets match your time horizon and risk appetite.
We’ve done the work across three categories: lower-risk blue chips for long-term holding, higher-risk altcoins with real short-term momentum, and specialized utility and AI tokens targeting specific growth themes. Every pick below has been evaluated on market cap, on-chain activity, roadmap delivery, and genuine use cases, not just price performance.
The coins below are where our analysts see the best risk-adjusted opportunity right now. Let’s break down each one.
- In This Article
-
- 1. Solana (SOL) — High-Speed, Low-Fee Blockchain for Scalable DeFi and dApps
- 2. BNB Coin (BNB) — Exchange Utility Token Powering Trading Fees and Perks
- 3. Cardano (ADA) — Research-Driven Blockchain Focusing on Security, Scalability, and Sustainability
- 4. Dogecoin (DOGE) — Meme-Based Cryptocurrency Used for Tipping and Online Payments
-
- 1. Define Your Goals
- 2. Understand the Project's Use Case
- 3. Analyze Project Fundamentals: Review the Whitepaper and Roadmap
- 4. Look Into Liquidity, Market Capitalization, and Trading Volume
- 5. Consider Tokenomics
- 6. Scrutinize the Team and Backers
- 7. Analyze Community Size and Strength
- 8. Study the Price History and Track Record
- In This Article
- Show Full Guide
-
- 1. Solana (SOL) — High-Speed, Low-Fee Blockchain for Scalable DeFi and dApps
- 2. BNB Coin (BNB) — Exchange Utility Token Powering Trading Fees and Perks
- 3. Cardano (ADA) — Research-Driven Blockchain Focusing on Security, Scalability, and Sustainability
- 4. Dogecoin (DOGE) — Meme-Based Cryptocurrency Used for Tipping and Online Payments
-
- 1. Define Your Goals
- 2. Understand the Project's Use Case
- 3. Analyze Project Fundamentals: Review the Whitepaper and Roadmap
- 4. Look Into Liquidity, Market Capitalization, and Trading Volume
- 5. Consider Tokenomics
- 6. Scrutinize the Team and Backers
- 7. Analyze Community Size and Strength
- 8. Study the Price History and Track Record
Key Takeaways: Best Crypto to Buy Now
- The best cryptos to buy right now include lower-risk, higher-risk, utility, and AI cryptocurrencies.
- These projects include Bitcoin (BTC), Ethereum (ETH), XRP (XRP), Solana (SOL), and BNB Coin (BNB).
- Some of the reasons why investors are buying crypto right now include institutional momentum, favorable policies, and improvements in technology.
- Investing in cryptocurrency can be risky, and you should evaluate a project before investing.
- To mitigate some risks from investing, consult a professional, diversify, DYOR, and never invest more than you can afford to lose.
Top Crypto Tokens to Buy in 2026: Quick Comparison
| Asset | Current Price | Market Cap | Risk Level | Time Horizon | Primary Use |
|---|---|---|---|---|---|
| Bitcoin (BTC) | $64,656.65 | $1.30T | Lower | Long-term | Store of value |
| Ethereum (ETH) | $1,874.44 | $225.37B | Lower | Long-term | Smart contracts & DeFi |
| XRP (XRP) | $1.11 | $110.65B | Lower | Long-term | Cross-border payments |
| Solana (SOL) | $77.38 | $45.55B | Higher | Short/Long | High-speed dApps & DeFi |
| BNB (BNB) | $576.49 | $1.30T | Higher | Short/Long | Exchange & ecosystem utility |
| Cardano (ADA) | $0.16 | $7.34B | Higher | Long-term | Proof-of-stake smart contracts |
| Dogecoin (DOGE) | $0.074 | $11.00B | Higher | Short-term | Meme liquidity & payments |
| Bittensor (TAO) | $197.44 | $4.15B | Higher | Long-term | Decentralized AI network |
| Hyperliquid (HYPE) | $66.96 | $66.96B | Higher | Short-term | On-chain derivatives trading |
| Hedera (HBAR) | $0.067 | $3.36B | Medium | Long-term | Enterprise dApps & tokenization |
Best Cryptos to Buy with Lower Risk for Long-Term Investment
With millions of digital assets across hundreds of chains, many investors wonder which crypto to buy today for the long term. The answer comes down to stability, which is why blue-chip cryptos should be first in line. They can help investors navigate the extreme volatility typical of this emerging industry.
Don’t get me wrong, this doesn’t mean blue-chips aren’t prone to wild fluctuations. However, their large market capitalizations are like the keels of a vessel, maintaining balance with their massive weight. The best long-term crypto assets represent large markets with millions of users and high trading volumes.
Bitcoin, Ethereum, and XRP are established ecosystems with entire markets built around them. They are suitable for conservative investors still open to crypto exposure. However, one of their main drawbacks is that they can’t offer the upside potential of early-stage projects.
We selected these three lower-risk crypto assets based on factors like market capitalization, trading volume, active user base, and ecosystem size. Let’s look closer at these top options.
1. Bitcoin (BTC) — Original Digital Currency and Leading Store-of-Value Crypto
Key Information:
- Bitcoin price: $64,656.65
- Market cap: $1.30T
- All-time high: $126,173.18
- 24-hour price change: +3.47%
- 7-day price change: +4.23%
- Year-to-Date (YTD) return: -26.16%
Bitcoin  BTC +3.47% is the oldest and most widely adopted cryptocurrency. It has a flawless 15-year track record, a market cap of $1.30T, and is recognized as legal tender in countries like El Salvador. It has officially been classified as a commodity by both the SEC and CFTC. Overall, its decentralized proof-of-work network is unmatched in security and scale.
Bitcoin ETFs (led by BlackRock’s IBIT) have accumulated over $50 billion in assets since launch, and corporate treasury adoption, from MicroStrategy to Trump-backed American Bitcoin, continues to add structural demand. With the halving behind it, the supply shock dynamic favors holders. Bitcoin’s dominance sits above 56%, a level historically associated with cycle maturity before altcoin rotations begin. For any new portfolio, it remains the lowest-friction first buy.
2. Ethereum (ETH) — Smart Contract Powerhouse for DeFi, dApps, and Web3
Key Information:
- Ethereum price: $1,874.44
- Market cap: $225.37B
- All-time high: $4,946.23
- 24-hour price change: +5.17%
- 7-day price change: +7.92%
- Year-to-Date (YTD) return: -37.02%
Ethereum  ETH +5.17% is the backbone of Web3, powering most decentralized apps, NFTs, and DeFi protocols. Its Pectra upgrade has enhanced scalability and performance, reinforcing its position as the most widely used blockchain globally.
Ethereum is mid-cycle in a meaningful upgrade sequence. Pectra (live since May 2026) already increased validator staking limits and improved wallet UX. The Glamsterdam fork, targeting mid-2026, is designed to push transaction capacity well beyond its current ceiling. What this means practically: fees get cheaper, the network handles more traffic, and Ethereum becomes a more credible rails layer for stablecoins and tokenized assets. ETH staking yields currently sit around 3–4% annually, which adds a carry component most blue chips can’t offer.
3. XRP (XRP) — Fast, Low-Cost Settlement Token for Global Payments
Key Information:
- XRP price: $1.11
- Market cap: $110.65B
- All-time high: $3.84
- 24-hour price change: +3.71%
- 7-day price change: +2.54%
- Year-to-Date (YTD) return: -39.44%
XRP ![]() XRP +3.71% is a digital asset built for fast, low-cost, cross-border payments. Transactions settle in seconds for less than a penny, making it ideal for banks, remittance providers, and payment networks moving money globally.
XRP +3.71% is a digital asset built for fast, low-cost, cross-border payments. Transactions settle in seconds for less than a penny, making it ideal for banks, remittance providers, and payment networks moving money globally.
In 2026, the XRP Ledger gets upgrades that make it simpler and more useful. The new Permissioned Domains (XLS-80) allow you to use human-readable addresses as opposed to the long wallet strings. XRP’s case strengthened materially in 2026.
Ripple’s $1 billion acquisition of GTreasury, a corporate treasury platform, signals a direct move into the institutional payments stack, not just cross-border retail flows. Multiple asset managers have filed for XRP spot ETFs in the US, and approval odds have risen following clearer SEC guidance. The XRP Ledger itself is adding native lending and permissioned domain features, broadening the on-chain use case beyond remittance. At its current market cap, it remains a high-conviction payments bet.
Top Cryptos to Buy with Higher Risk for Short-Term Investment
Growth-oriented investors leaning toward more risk would be more tolerant of volatility. In fact, short-term gains derive from price fluctuations, so it makes sense to explore the most volatile crypto assets.
These altcoins have more upside potential than blue chips, often showing larger percentage moves. But as you know, the catch is that volatile assets are unpredictable and can swing against you at any moment.
To eliminate extreme risks, such as sudden collapses or rug pulls, we handpicked the best short-term crypto assets among the countless options. Unlike blue chips, these more volatile cryptocurrencies are suitable for day trading.
Our list of scalable altcoins may be the ideal starting point for anyone asking which crypto to buy today for the short term. It includes Solana, BNB, Cardano, and Dogecoin, offering a mix of large Web3 ecosystems and community-backed meme coin exposure.
We paid attention to their market cap, ecosystem activity, relevant partnerships, and social media traction. Below are the top choices.
1. Solana (SOL) — High-Speed, Low-Fee Blockchain for Scalable DeFi and dApps
Key Information:
- Solana price: $77.38
- Market cap: $45.55B
- All-time high: $294.16
- 24-hour price change: +3.39%
- 7-day price change: +0.25%
- Year-to-Date (YTD) return: -37.65%
Solana ![]() SOL +3.39% is a very fast blockchain, handling around 960 transactions per second as of July 2026, with almost no fees, even when many people use it at once. Its built-in time-stamping system helps it stay quick and smooth, making it a favorite for DeFi apps, NFTs, and busy trading platforms.
SOL +3.39% is a very fast blockchain, handling around 960 transactions per second as of July 2026, with almost no fees, even when many people use it at once. Its built-in time-stamping system helps it stay quick and smooth, making it a favorite for DeFi apps, NFTs, and busy trading platforms.
It is all about reliability and speed in the Solana 2026 story. Firedancer introduces a second validator client, eliminating the risk of cutover, and pushing higher throughput. Alpenglow is seeking higher finality and reduced latency. As the compute limits become larger and the token transfers reduce in cost, the fees decline. The latter combination facilitates the operation of DeFi, gaming, and meme trading.
The meme coin and consumer app ecosystem on Solana, including pump.fun, Tensor, and Dialect, have driven some of the highest retail on-chain activity of any chain in 2025–2026. That user base is a genuine competitive moat, not just a speculative tailwind.
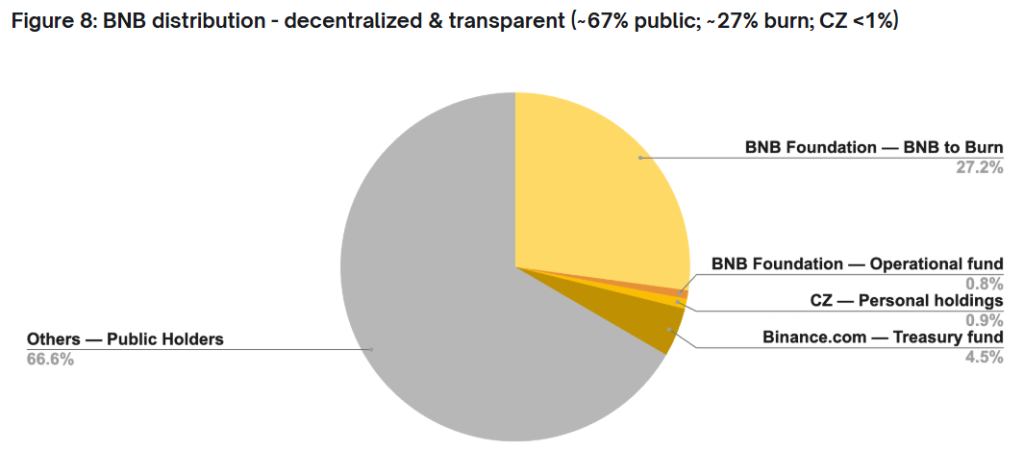
2. BNB Coin (BNB) — Exchange Utility Token Powering Trading Fees and Perks
Key Information:
- BNB price: $576.49
- Market cap: $77.70B
- All-time high: $1,370.98
- 24-hour price change: +1.27%
- 7-day price change: +2.59%
- Year-to-Date (YTD) return: -32.63%
BNB  BNB +1.27% is widely viewed as a good buy thanks to its utility, broader applications, and being the native token of the BNB ecosystem. It makes paying trading fees on Binance much cheaper, as the platform usually offers discounts of around 25%, increasing profit for frequent traders. It also gives holders access to exclusive token sales and new project launches on Binance Launchpad.
BNB Chain’s 2026 upgrades focus on speed, smoother trading during traffic spikes, and better reliability. The chain is also moving to a dual-client setup, so one client prioritizes stability while the other pushes performance. If you use DeFi often, that combination can make BNB more practical to hold and use.
BNB’s investment case rests on two things: Binance’s continued market share dominance (still the largest CEX by volume), and BNB Chain’s growing ecosystem beyond the exchange. BNB Chain’s 2026 roadmap introduces a dual-client architecture for better stability and performance, and the chain is aggressively targeting DeFi TVL with lower fees. BNB also benefits from Binance’s quarterly burn program, the deflationary mechanic that has removed billions from supply over the years.
Its risk: regulatory pressure on Binance remains the single biggest overhang.
3. Cardano (ADA) — Research-Driven Blockchain Focusing on Security, Scalability, and Sustainability
Key Information:
- Cardano price: $0.16
- Market cap: $7.34B
- All-time high: $3.10
- 24-hour price change: +3.23%
- 7-day price change: -1.52%
- Year-to-Date (YTD) return: -50.86%
Cardano is a leading blockchain platform that uses proof-of-stake consensus, called Ouroboros, to support smart contracts and dApps. Its main goal is security, as it focuses on providing a highly secure and scalable infrastructure while emphasizing academic research and peer-reviewed development.
Cardano’s 2026 story is execution, not promises. The Voltaire governance era handed on-chain control to ADA holders, a structural first for a major L1. Hydra (layer-2 scalability) is moving from testnet to more active deployment, and Midnight, the privacy sidechain, is targeting regulated finance use cases where confidentiality is non-negotiable. For investors, the staking yield (currently ~3% annualized) provides an income floor while waiting for ecosystem growth to materialize.
4. Dogecoin (DOGE) — Meme-Based Cryptocurrency Used for Tipping and Online Payments
Key Information:
- Dogecoin price: $0.074
- Market cap: $11.00B
- All-time high: $0.75
- 24-hour price change: +2.98%
- 7-day price change: +3.91%
- Year-to-Date (YTD) return: -38.90%
Dogecoin  DOGE +2.98% is a solid option for high-volume traders thanks to its deep liquidity on major exchanges and steady daily turnover. It runs on a Scrypt-based Proof of Work system, keeping the network decentralized and still mineable with widely available hardware.
DOGE’s investment case is more speculative than technical in 2026, and being honest about that is what makes it credible. The bull case rests on X (formerly Twitter) payment integration (still in development), Elon Musk’s continued public support, and the asset’s unmatched retail liquidity. DOGE remains among the top 5 most actively traded tokens on every major exchange. If the X pay integration ships with a DOGE option, the retail demand spike could be substantial. If it doesn’t, DOGE reverts to community speculation. Size it accordingly.
Best Crypto Projects for Specialized Investors — Utility and AI Tokens
While large smart contract networks like Ethereum, Solana, and BNB Chain cover many use cases, some investors prefer clearer themes. Utility and AI tokens stand out because they focus on specific services, link directly to real-world demand, and can show more obvious growth paths.
Some of the best utility tokens include HYPE and HBAR, which power a trading hub and a dApp ecosystem, respectively. A special category to explore is Layer 2 solutions built around Ethereum, which have become indispensable for their scaling potential.
Elsewhere, top AI crypto coins like TAO have also been among trending coins since the AI craze began. Growth-oriented investors may look to these and other utility tokens for day trading and short-term gains.
We selected a few coins that dominate their niches, have gained traction, represent mature markets, and remain well-positioned for future growth. Check them out below.
1. Bittensor (TAO) – Decentralized AI Network Rewarding Open Machine Learning Contributions
Key Information:
- TAO price: $197.44
- Market cap: $4.15B
- All-time high: $769.13
- 24-hour price change: +0.62%
- 7-day price change: -3.40%
- YTD return: -10.84%
Bittensor ![]() TAO +0.62% is a decentralized blockchain protocol tailored for machine learning (ML) and artificial intelligence (AI). It offers an open marketplace where developers and users can share, train, and even exchange AI models without requiring permissions.
TAO +0.62% is a decentralized blockchain protocol tailored for machine learning (ML) and artificial intelligence (AI). It offers an open marketplace where developers and users can share, train, and even exchange AI models without requiring permissions.
When buying Bittensor, it rewards contributors with the native token TAO, encouraging them to become a collaborative intelligence economy. Moreover, Bittensor’s core architecture combines subnets, a blockchain layer, and an API that, mixed together, offer a wide range of AI services and applications.
2. Hyperliquid (HYPE) — High-Performance Trading Chain for Derivatives and On-Chain Order Books
Key Information:
- HYPE price: $66.96
- Market cap: $66.96B
- All-time high: $76.76
- 24-hour price change: +5.42%
- 7-day price change: -1.90%
- Year-to-Date (YTD) return: +166.46%
Hyperliquid  HYPE +5.42% is redefining crypto trading with ultra-fast, on-chain perpetual futures that rival centralized exchanges. Built on a custom Layer 1, it offers sub-second settlement while maintaining full transparency and self-custody, an ideal blend for serious traders.
Hyperliquid is moving beyond perpetuals with HIP-4, adding “Outcome Trading” for prediction markets and bounded, options-style contracts. You post full collateral upfront, so there’s no leverage, margin calls, or liquidations. Markets can be time-limited and priced via auctions instead of external oracles. Trades settle in USDH, and builders can create custom event markets.
3. Hedera (HBAR) – Enterprise-Focused Network Using Hashgraph for Fast, Cheap Transactions
Key Information:
- HBAR price: $0.067
- Market cap: $3.36B
- All-time high: $0.56
- 24-hour price change: +2.33%
- 7-day price change: -2.94%
- Year-to-Date (YTD) return: -36.82%
Hedera  HBAR +2.33% is powered by Hashgraph, not traditional blockchain, enabling thousands of fast, secure transactions per second with sub-cent fees. Its enterprise-grade tech is built for real-world use, attracting major partners like Google, IBM, and Dell for applications in tokenization and micropayments.
With its innovative structure, Hedera is tackling problems others haven’t solved, like fair transaction ordering and sustainable scalability. Its tech is already being used in CBDCs, supply chains, and AI data validation.
Why Are Investors Buying Crypto Right Now?
Investors buying crypto now are positioning ahead of a potential macroeconomic and market-cycle turn, even as short-term volatility remains elevated. Despite recent price swings, several structural and behavioral factors are supporting renewed buying interest.
One major driver is the expectation of easier monetary policy. Many investors believe interest rates are closer to their peak than to another meaningful rise. Historically, crypto assets, particularly Bitcoin and Ethereum, have benefited when liquidity conditions improve.
Another factor is “buy-the-dip” cycle thinking. Following a sharp pullback and the clearing of excess leverage, market sentiment has shifted from overheated optimism to cautious realism. For long-term investors, this reset is viewed as constructive rather than bearish, creating opportunities to accumulate assets at more attractive valuations.
Institutional normalization also continues, even if short-term flows look weak. While ETF inflows have softened recently, crypto is now a recognized component of diversified portfolios. Many institutions keep allocating gradually.
On the supply side, there is growing conviction around scarcity. Long-term holders have largely remained inactive, reducing the amount of supply available on exchanges. This dynamic reinforces the belief that downside risk may be more limited unless broader macro conditions deteriorate sharply.
Importantly, crypto demand is no longer driven solely by price speculation. On-chain utility, including stablecoins, payments, tokenization, and decentralized finance, continues to show real-world usage even during downturns. For some investors, buying crypto represents exposure to financial infrastructure rather than a short-term trade.

Finally, contrarian sentiment is playing a role. Periods of fear and negative headlines often attract experienced investors looking for asymmetric upside. When sentiment indicators are depressed, the risk-reward profile can become more compelling if conditions stabilize or improve.
How to Evaluate a Cryptocurrency Before Investing
In bull cycles, a crypto market can uphold numerous assets, yet they are not the ones that are resilient in the long term. It is advisable to perform a careful assessment of the cryptocurrencies before committing financial resources to them that extends beyond their price. These are some of the main factors to be considered.
1. Define Your Goals
Cryptocurrencies have become a diverse market, so it’s important to start by defining your specific goals. Do you seek long-term, steady growth, or are you ready to actively trade for short-term gains? Blue-chip coins may be better suited for long-term growth, while scalable altcoins can offer quicker returns, although they carry higher risk.
2. Understand the Project’s Use Case
Once you select a cryptocurrency that fits your goals, you should check its use case and see what specific problems it solves.

Some crypto coins may power one-stop, industry-agnostic chains, while others focus on specific sectors. Always check whether the use case is still relevant and offers long-term value. For example, metaverse projects are currently in standby mode, while AI and payment coins are thriving.
3. Analyze Project Fundamentals: Review the Whitepaper and Roadmap
Most crypto assets have a whitepaper outlining their mission and key concepts. Ideally, this comes with a well-designed webpage and a clear roadmap. Take your time to read these.
Sometimes, whitepapers introduce revolutionary innovations. Think about zkSNARKs, decentralized AI networks, oracles, or restaking. If you catch these trends early, you could get in before most investors even notice.
4. Look Into Liquidity, Market Capitalization, and Trading Volume
Market capitalization, trading volume, and liquidity are also key metrics of a crypto asset, which are important factors. High market capitalization is an indication that the investors have confidence in a certain undertaking. High volume of trade and growth in its market size indicate that the project is being captured very fast.
Typically, the coins with large capitalization can be assumed to be more responsible, whereas small-cap and early-stage projects have low liquidity and considerable volatility.
5. Consider Tokenomics
Tokenomics refers to the economic principles defining aspects like a token’s total supply, pace of token unlocks (vesting schedule), distribution model, allocation, deflationary mechanisms, and other financial dynamics.
You should look for healthy tokenomics models that prioritize organic growth and community building rather than benefiting the team and private investors in a disproportionate way.
6. Scrutinize the Team and Backers
Speaking of the team, you should do a background check and analyze the history of team members. Have they held key executive roles at reputable companies in the past? Many blockchain developers and managers come from established fintechs or other well-known entities.
For example, the team behind Facebook’s abandoned Libra project split into two main groups and went on to build Aptos and Sui, two Layer 1 chains that have experienced rapid growth.
When it comes to meme coins and small-cap crypto projects, anonymous teams have become the norm. Still, there are specialized security firms that can audit team profiles without revealing their identity.
7. Analyze Community Size and Strength
You’d be interested in crypto coins backed by large and engaged communities. This is a strong indicator of a project’s strength and momentum, especially in the case of meme coins. In fact, for them, community engagement can be the primary driving force.
Check the cryptocurrency’s social media presence, including activity on X, Telegram, Discord, or Reddit. Projects with passionate and loyal communities can be more resilient during market downturns.
8. Study the Price History and Track Record
If you want to invest in established crypto projects (a.k.a. dino coins), look at their past price charts and how they handled tough periods, such as the 2022–2023 crypto winter. Newer projects may not have much history, but you can still study how their sector performed or compare them with coins that have similar token structures.
What Are the Risks of Investing in Cryptocurrency?
Cryptocurrencies represent a new asset class that is still finding its place alongside traditional markets. In the meantime, they carry a significantly higher risk, which is to be expected of emerging trends.
Take the dot-com bubble in the 2000s, for example. While many low-quality online projects failed, it didn’t mean the internet itself had no value. Similarly, as the crypto market matures, here are the main risks you should know about.
📈 High Volatility
Crypto assets are notorious for their volatility. This is a significant risk even for blue-chip coins. Still, Bitcoin and Ethereum are creating the trends rather than following them. Therefore, they’re more stable and resilient.
Small-cap coins show much higher volatility and carry significant risk for traders using leverage.
🧑⚖️ Lack of Regulation
One of the big problems of crypto is that its regulatory environment is very fragmented and inconsistent across jurisdictions. For example, in China, the world’s second most populous country, crypto is completely banned, while in the European Union, it has a dedicated and relatively friendly regulatory framework.
In the US, still the biggest crypto market by volume and usage, the rulebook is patchy and varies across regulators and states. Things are slowly getting clearer, though, with FIT21 passing the House in 2024 and the GENIUS Act now outlining how stablecoins and watchdog roles should be handled.
🔒 Security Risks
You will often hear that blockchain offers unmatched security. While this is true for Bitcoin and perhaps a few other established Layer 1 chains, the broader Web3 ecosystem built around these chains is plagued by security risks, such as vulnerable smart contracts and coding flaws.
In late 2025, two major incidents reflect the security weakness in decentralized finance (DeFi). Balancer Protocol lost over $116 million in a cross-chain exploit targeting its V2 pools, marking one of the largest crypto security breaches this year.
A few hours later, Stream Finance discovered that an external fund manager had lost $93 million of its fund assets, causing its stablecoin Stream USD (xUSD) to lose its peg and crash.
To reduce the risk of similar events, it’s safer to use crypto projects that have been audited by well-known security firms such as Certik or Halborn.
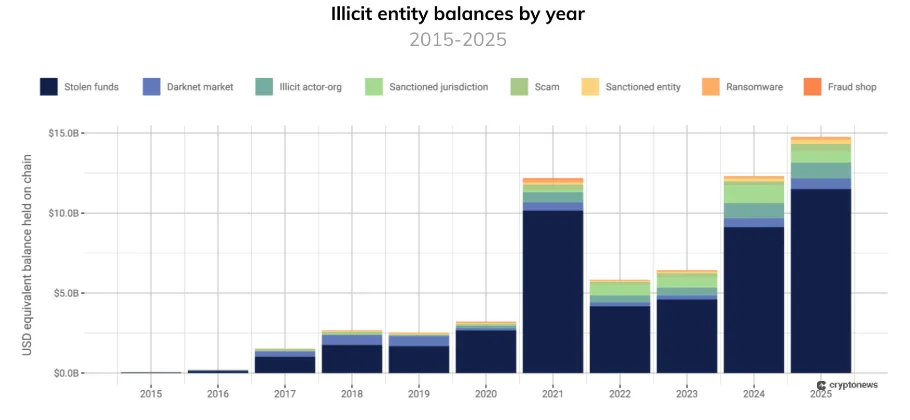
🧑💻 Scams and Hacks
Due to the lack of crypto literacy, criminals and hackers are taking advantage of the situation and carrying out social engineering activities and using hacking attacks targeting both centralized and decentralized systems.
Chainalysis noted in October 2025 that illicit organizations had close to 15 billion dollars worth of funds, and stolen funds constituted the biggest portion. It is a new record peak, in part, explained by an increase in the price of crypto assets in 2025.
Rug pulls, Ponzi schemes, pig butchering, and other social engineering devices are all scams that are constantly being developed by criminals, and with AI getting more popular, diversity increases.
🌎 Market Manipulation
While analyzing key metrics, you should know that data can be distorted due to market manipulation, as many small projects use bots to inflate market cap and volume figures to create the false impression of success. This is a serious problem in crypto, affecting DeFi, NFTs, and the broader Web3 sector.
For example, CryptoSlam found that 42.52% of NFT trading on Ethereum links to wash trading, a manipulative practice where the same group buys and sells NFTs to inflate volume data.
Risk Management Tips for Investing in Crypto Projects
Many investors find the crypto space appealing for its high-growth opportunities, but the risks are also high. Here are a few basic principles and steps to protect your capital.
🔍 Do Your Own Research
Before investing in any crypto project, take the time to research it thoroughly. Check out our guide on evaluating a cryptocurrency, and review each aspect, from the whitepaper and team to tokenomics and community engagement.
Don’t just rely on social media hype or your friend’s advice.
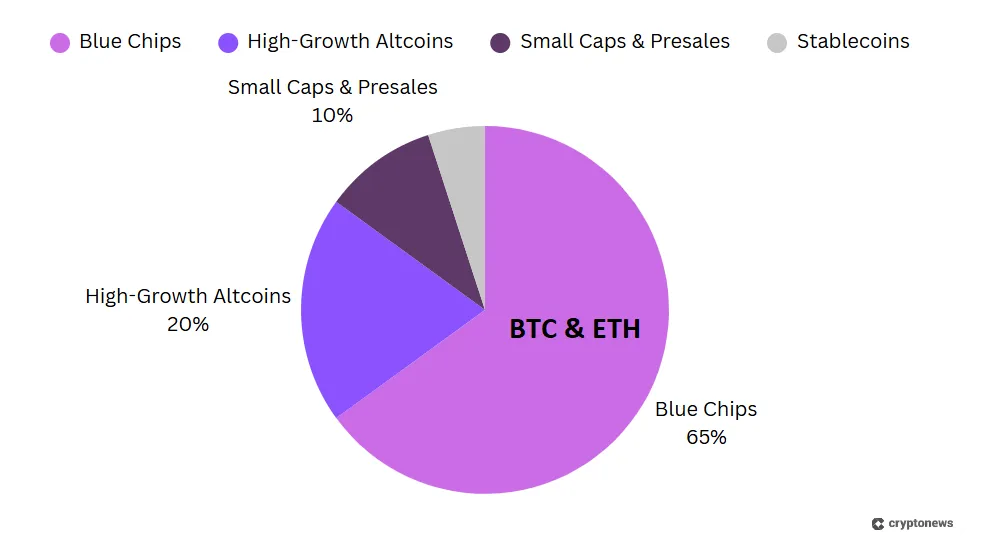
📚 Diversify Your Cryptocurrency Portfolio
One of the best ways to mitigate risk is to diversify your crypto exposure by allocating across different cryptocurrency types, including blue-chip and small-cap coins.
🧑💼 Consult With a Professional
If you have capital but aren’t sure how to get started in crypto or what the legal and tax implications might be, it’s wise to consult with a financial advisor or crypto-savvy professional.
Again, don’t believe anyone promoting themselves as a crypto expert; look for a reputable individual or firm that can guide you.
💸 Invest Only What You Can Afford to Lose
It may sound like a cliché, but never invest more than you can afford to lose. Crypto markets are highly speculative, and you should never sell your car or house, or dip into your savings, chasing the “next big thing.”
Methodology: How We Rated the Best Cryptos to Buy
To curate this list of the best cryptos to buy, our crypto analysts collectively dedicated over 300 hours to research. They evaluated factors like historical performance, long-term potential for growth, current price, utility, and security. Here’s how we researched and weighted each criterion. For more information, please read our full research methodology.
Market Performance (25%)
We reviewed the coin’s price action over the past week and up to 12 months, examining both short-term fluctuations and longer-term trends. We also considered its overall market value to understand its position and weight in the wider crypto market.
Utility and Use Cases (20%)
We looked at how cryptocurrency is used in real life, paying attention to any features or applications that make it stand out. We also reviewed the technology behind it and recent updates that strengthen its practical use.
Community and Adoption (15%)
To analyze the adoption by the community, we have examined the relevance and liveliness of the project on X, Reddit, Telegram, and other forums. We also examined the practical applications, both among merchants and applications themselves, as well as by regular people, since broader usage tends to be more indicative of a healthier ecosystem.
Development Team (15%)
We researched the development team’s track record and reputation; while we don’t dismiss newcomers, past experience and successful projects help build credibility. We also checked how open the team is with updates, progress reports, and challenges, because the more the community knows, the more confident people feel about buying and holding the coin.
Security (15%)
We evaluated the security design of the blockchain, including its consensus mechanism and resistance to common attack vectors. On top of that, we reviewed any past security incidents or bugs and assessed how quickly and effectively the team responded and fixed them.
Regulatory Compliance (5%)
We checked whether the cryptocurrency operates in line with relevant regulations in its main regions, since compliance is key for long-term survival and institutional interest.
Roadmap and Future Plans (5%)
We reviewed the project’s roadmap to see if it sets out clear, realistic updates and milestones that can guide future growth.
These scores together gave us a full view of each cryptocurrency’s strengths and potential, allowing us to assign a rating to every coin recommended on this page.
Conclusion: Our Take on the Best Crypto to Buy Right Now
The best cryptos to buy right now include XRP, Bitcoin, Solana, and Ethereum. XRP stands out in terms of real-world adoption, while Bitcoin remains the most reliable long-term store of value.
To determine if a crypto is worth buying, you need a data-driven approach, analyzing its key metrics, long-term potential, real-world utility, tokenomics, regulatory compliance, and unique selling point.
However, even when arguments are backed by fundamentals, choosing the “best” cryptocurrencies ultimately depends on your financial goals and risk tolerance. Aggressive growth-oriented investors will likely be interested in tokens with strong upside potential, while conservative investors may stick with blue chips.
Match your goals and your risk appetite to the right asset, and never invest more than you can afford to lose.
Buy Crypto with Best WalletFrequently Asked Questions (FAQs)
Which crypto has the most potential in 2026?
Is Bitcoin and crypto the same?
What are the most popular cryptocurrencies?
What has been the most active cryptocurrency in 2026?
What is the best crypto to invest in with $1,000 right now?
What are the best niche cryptocurrencies?
References
- CoinPedia via TradingView: XRP ETF Approval Could Trigger Massive Supply Shock
- The Wall Street Journal: Trump Brothers-Backed Bitcoin Mining Company Is Set to List on Nasdaq
- GTreasury: Ripple Breaks into Corporate Treasury with $1B GTreasury Acquisition
- Reuters: US Fed to trim rates twice more this year; 2026 rate path very unclear
- Chainalysis: Illicit entity balances chart
- Amb Crypto: Ethereum: How ETH’s 2026 upgrades aim to reshape the network
- HTX: Ripple Dev Says Get Ready For 2026, All The New Things Coming For XRP
- BNB Chain: Tech Roadmap 2026
- ZyCrypto: Charles Hoskinson Unveils Cardano’s 2026 Master Plan
- Yahoo Finance: Hyperliquid Moves Toward Prediction Markets With New Proposal
2M+
250+
8
70


About Cryptonews
Our goal is to offer a comprehensive and objective perspective on the cryptocurrency market, enabling our readers to make informed decisions in this ever-changing landscape.
Our editorial team of more than 70 crypto professionals works to maintain the highest standards of journalism and ethics. We follow strict editorial guidelines to ensure the integrity and credibility of our content.
Whether you’re looking for breaking news, expert opinions, or market insights, Cryptonews has been your go-to destination for everything cryptocurrency since 2017.