Best Crypto to Buy Now August 31 – Maker, Mantle, dYdX


The U.S. Securities and Exchange Commission (SEC) announced on August 31 that it will postpone decisions on proposed rule changes related to spot Bitcoin exchange-traded funds (ETFs) until October.
The SEC is postponing judgments on proposed rule changes that would allow Fidelity (Wise Origin), VanEck, WisdomTree, Invesco, and others to offer spot Bitcoin ETFs on various exchanges.
With the SEC pushing back the Bitcoin ETF ruling, what are the best cryptos to buy now?
Decisions are delayed until October 16 for most applicants, with Valkyrie Investments pushed back to October 19.
This continues a cycle of ETF applications, delays, and rejections by the SEC. If rejected in October, applicants could submit new proposals to restart the process.
Many see the latest round of ETF applications as promising, however, especially BlackRock’s proposal.
BlackRock has a high success rate for past ETFs and plans to use Coinbase for surveillance-sharing. Most other applicants modeled proposals after BlackRock.
While no spot Bitcoin ETFs have received SEC approval so far, many remain hopeful for October.
With major financial institutions increasingly proposing Bitcoin ETFs, the SEC faces growing pressure.
However, the agency continues taking a cautious approach regarding crypto-based funds for mainstream investors.
Meanwhile, bitcoin’s price has reacted with volatility to the recent news. The cryptocurrency gained after Grayscale’s legal win, topping $28,167 on August 30. But Bitcoin then gave back those gains after the SEC’s latest deferral, falling 5% so far today to trade at $25,928.
With bitcoin ETF proposals in regulatory limbo, analysts propose diversifying into overlooked altcoins with upside potential.
Maker, Wall Street Memes, Mantle, Launchpad XYZ, and dYdX are some of the best cryptos to buy now thanks to their robust use cases and/or upbeat technical analysis.
Maker (MKR): A Potential Bullish Breakout
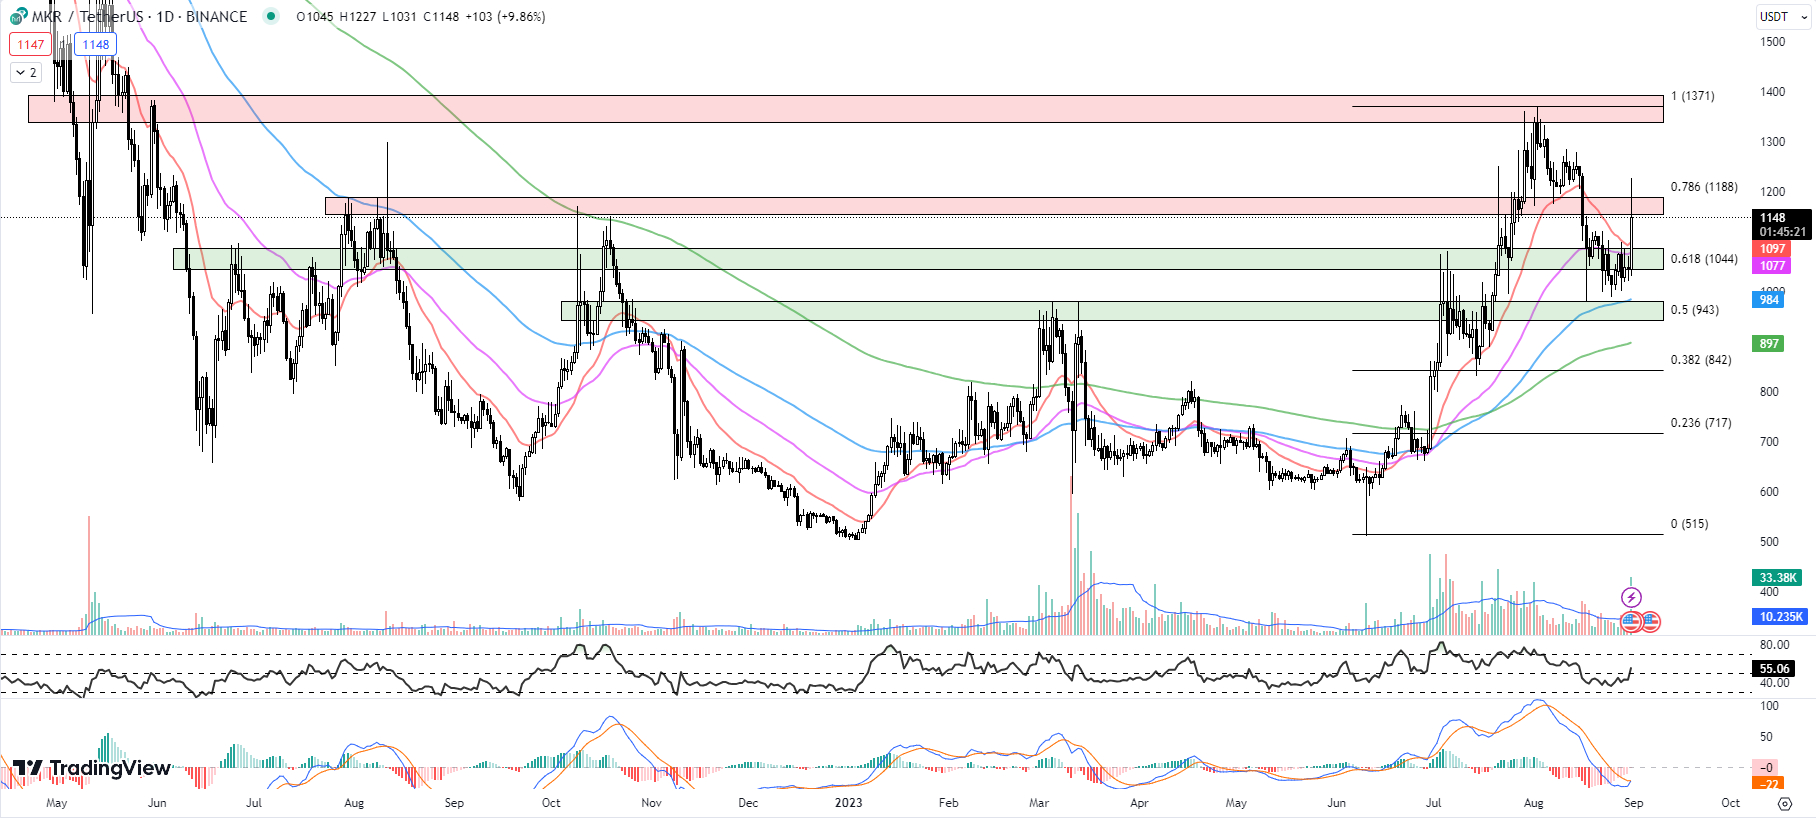
Maker (MKR) has been a standout performer today, with its price surging by 9.86% so far today after two weeks of consolidation.
Despite an intraday high that saw prices rise by more than 17%, MKR was unable to successfully break through its immediate resistance levels.
As the trading day continues, MKR is now attempting to close above the 20-day EMA at $1,097. A look at the technical indicators shows a potential uptrend in the offing.
The 20-day EMA ($1,097), 50-day EMA ($1,077), and 100-day EMA ($984) are all positioned sequentially, suggesting that the bulls are in control.
A successful close above the 20-day EMA could signal a bullish trend in the short term.
The RSI has also risen from 42.76 to 55.06. This indicates that buying pressure is increasing and could potentially push the price higher.
The MACD histogram shows a reading of -0, up from -9, indicating a potential bullish crossover. A bullish MACD crossover typically suggests that it’s a good time to buy as upward momentum is increasing.
Maker’s market cap has grown by 10.15% to $1.1 billion, and its 24-hour trading volume has also seen a significant increase of 144.17% to $140.2 million.
These increases in market cap and volume, combined with the current price of $1,148, suggest an increased investor interest in MKR.
On the upside, MKR faces a horizontal resistance zone between $1,153 and $1,187. A break above this level would confirm the bullish trend and could potentially lead to further upward movement.
On the downside, the 20-day EMA at $1,097 provides immediate support, followed by a horizontal support zone between $1,044 and $1,086.
This support zone is in confluence with the 50-day EMA at $1,077 and the Fib 0.618 level at $1,044. These levels could provide strong support in case of a price correction.
Based on the above technical analysis, traders should monitor MKR closely for a successful close above the 20-day EMA, as this could signal a bullish trend.
Meanwhile, keeping an eye on the RSI and the MACD can provide further confirmation of this trend.
In case of a price correction, the mentioned support levels could provide buying opportunities.
However, a break below these support levels could indicate a bearish trend, and traders should adjust their strategies accordingly.
Join the WallStreetBets Movement with WSM: One of the Best Cryptos to Buy Now
Wall Street Memes (WSM) has carved out its place as one of the most successful cryptocurrency presales of 2023, securing over $25 million from early backers.
With the support of over 1 million community members, this project is set for a potential price surge when it lists on major crypto exchanges in 27 days.
Wall Street Memes leverages the anti-establishment sentiment of the popular WallStreetBets Reddit community.
The $WSM token’s low presale price has made it widely accessible, attracting hordes of buyers. At just $0.0337 per token, WSM has very low barriers to entry for everyday investors.
Presale buyers will also benefit from an automatic 30% listing bonus when the token hits exchanges.
In August, an anonymous cryptocurrency whale purchased $1 million worth of WSM tokens. The mystery buyer made two large purchases – one valued at 460 ETH ($840,000) and another worth 93 ETH ($160,000).
This significant investment from an institutional player lends validity to WSM as a promising investment with the potential for major growth.
Unlike most projects, WSM does not award any tokens to founders or developers. Instead, 30% of the supply goes to community rewards, 20% funds liquidity, and 50% is available during the presale event.
This fair distribution model has helped build a community of more than 1 million followers across social media.
With major exchange listings just weeks away, Wall Street Memes presents a unique opportunity to get in early on a project with massive community backing.
Mantle (MNT): A Mixed Bag of Bullish and Bearish Indicators
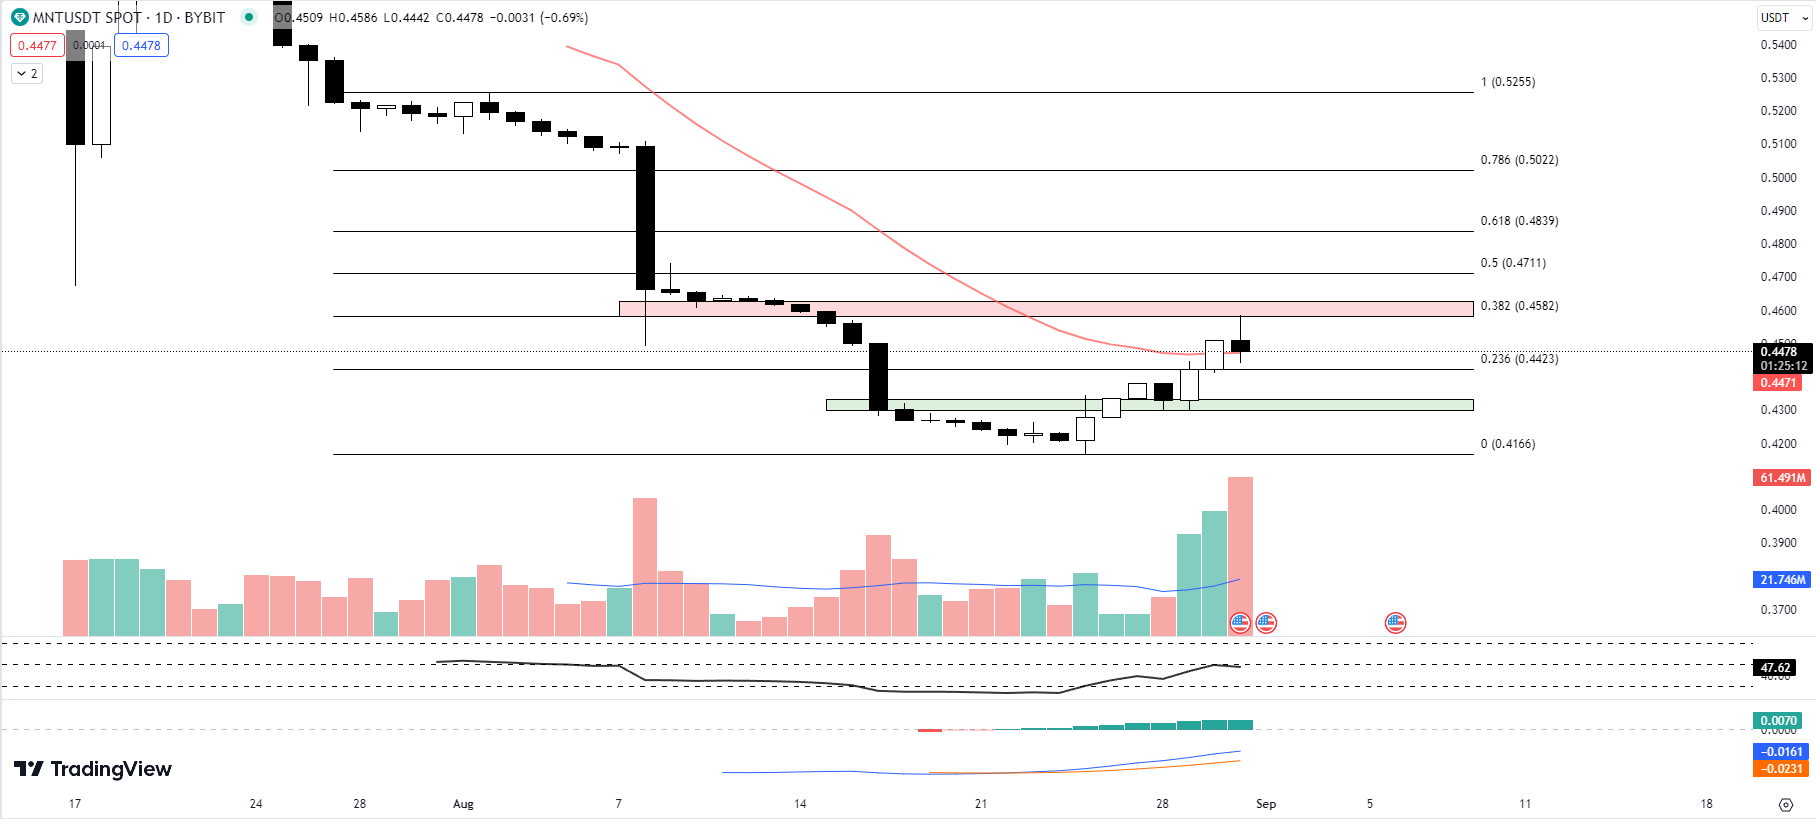
Mantle (MNT), has been displaying promising signs in its recent bullish activity, bouncing off the Fib 0.236 level at $0.4423 and the 20-day EMA yesterday with a 1.97% move to the upside.
However, an early surge that pushed MNT to an intraday high of $0.4586 was met with selling pressure, causing a slight reversal to its current level of $0.4478.
A 0.69% decline so far today suggests a mixed trading environment for MNT.
MNT’s 20-day EMA currently stands at $0.4471. The proximity of this level to the current price suggests a delicate balance between buying and selling pressure.
If MNT sustains above this level, it could signal a continuation of the bullish trend.
Meanwhile, the RSI has dipped slightly to 47.62 from yesterday’s 49.54. This reading, positioned in the neutral zone, does not indicate an overbought or oversold condition, maintaining the likelihood of continued price volatility.
The MACD histogram has seen a slight increase to 0.0070, up from yesterday’s 0.0067. This positive divergence could foretell a bullish momentum in the near future, provided it is supported by other indicators.
The market capitalization has seen a minute decrease of 0.09%, standing at $1.45 billion so far today.
However, a notable increase in the 24-hour trading volume by 9.73% to $15.9 million underlines the increased trading activity.
This rise in volume, despite the price decline, indicates a strong selling pressure, which traders should monitor closely.
The immediate resistance for MNT lies in the horizontal resistance zone of $0.4582 to $0.4626, aligning with the Fib 0.382 level at $0.4582. Breaking this resistance could pave the way for a further bullish rally.
On the flip side, if MNT fails to hold above the 20-day EMA, it could seek support at the Fib 0.236 level at $0.4423.
Traders are advised to keep an eye on the evolving market conditions and watch for confirmations from the aforementioned technical indicators.
The delicate balance of buying and selling pressures could sway the market sentiment in either direction, and prudent traders will be prepared to react accordingly.
Launchpad XYZ: Unlocking Your Web3 Potential with One of the Best Cryptos to Buy Now
Launchpad XYZ is ushering in an era of easy and accessible Web3 participation. This cryptocurrency startup is offering an impressive 19% bonus on its $LPX token presale.
However, the bonus is set to expire in less than a week, giving prospective investors limited time to obtain LPX tokens at a reduced price.
Launchpad XYZ seeks to provide easy access to cryptocurrency and blockchain technology through user-friendly tools for trading, analytics, and community interaction.
The company’s core product suite will include an NFT discovery platform, decentralized exchange, Web3 wallet, and token analysis tools.
Integral to Launchpad XYZ’s ecosystem is its $LPX token. LPX holders will be able to access benefits such as discounted trading fees, early access to NFT mints, play-to-earn games, and community badges.
Launchpad XYZ plans to list LPX on major exchanges in Q3 2023.
With the presale ending soon, Launchpad XYZ intends to kickstart the next phase of its roadmap focused on user acquisition and platform development.
LPX is currently available for purchase directly through Launchpad XYZ’s website. The total token supply is capped at 1 billion, with a fully diluted market capitalization projected at $70 million post-listing.
DYDX: Signs of Imminent Breakout Amid Tight Consolidation
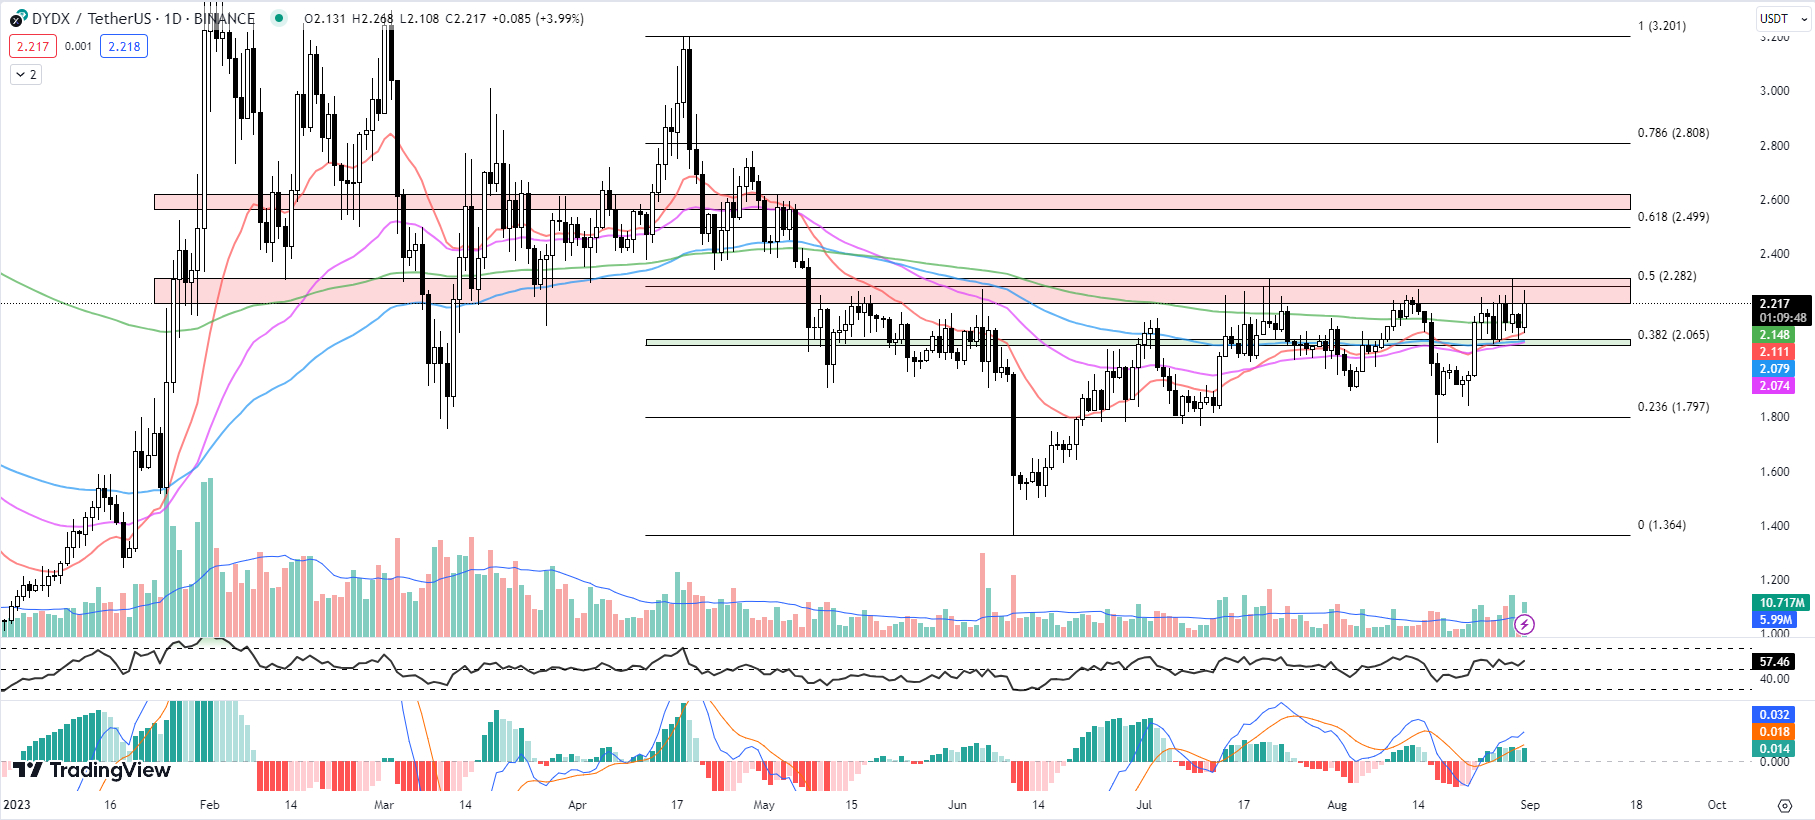
DYDX has been observed to be in a tight consolidation phase for the past week, trading between the Fib 0.382 level of $2.065 and the Fib 0.5 of $2.282.
The close proximity of its Exponential Moving Averages (EMAs) strongly suggests impending price volatility, which may soon lead to a significant breakout or breakdown.
The 20-day EMA, currently at $2.111, lies just above the 50-day EMA of $2.074 and the 100-day EMA of $2.079, highlighting the possibility of an upward price movement.
DYDX’s RSI currently stands at 57.46, up from yesterday’s 52.77. This suggests that buying pressure is increasing, although it is still not in the overbought territory (above 70), giving room for further upside.
Additionally, the MACD histogram has also marginally increased to 0.014 from yesterday’s 0.012, indicating a growing bullish momentum.
An increase in both the market cap and trading volume further strengthens the case for an incoming price movement.
The market cap has risen by 4.02% to $346.2 million, and the 24-hour trading volume has seen a significant jump of 75.14% to $83.7 million.
DYDX is currently trading at $2.217, up by 3.99% for the day. It’s approaching a resistance zone, which lies between $2.220 and $2.310, in confluence with the Fib 0.5 level of $2.282. This could prove a challenging barrier for the cryptocurrency to overcome.
On the downside, immediate support is expected at the 200-day EMA, followed by the 20-day EMA.
The next level of support lies at the Fib 0.382 level of $2.065, which coincides with the 100-day and 50-day EMAs.
Traders are advised to keep a close eye on these levels and the aforementioned indicators.
The technicals suggest that a move is imminent, and the direction will likely be dictated by whether DYDX can successfully break through the resistance zone or if it falls back to its support levels.
Disclaimer: Crypto is a high-risk asset class. This article is provided for informational purposes and does not constitute investment advice. You could lose all of your capital.